-
-
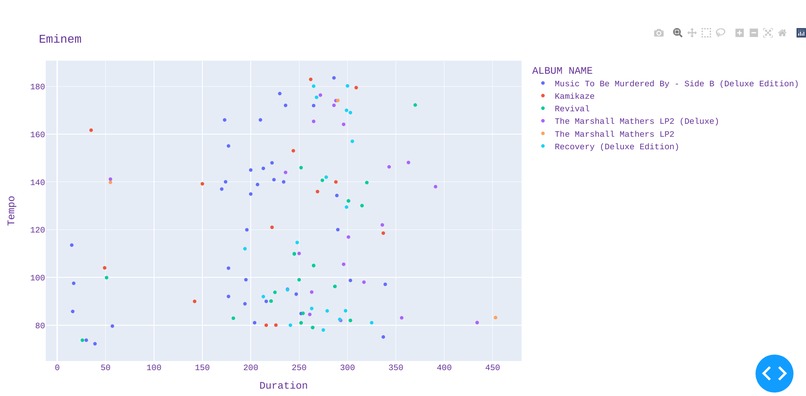
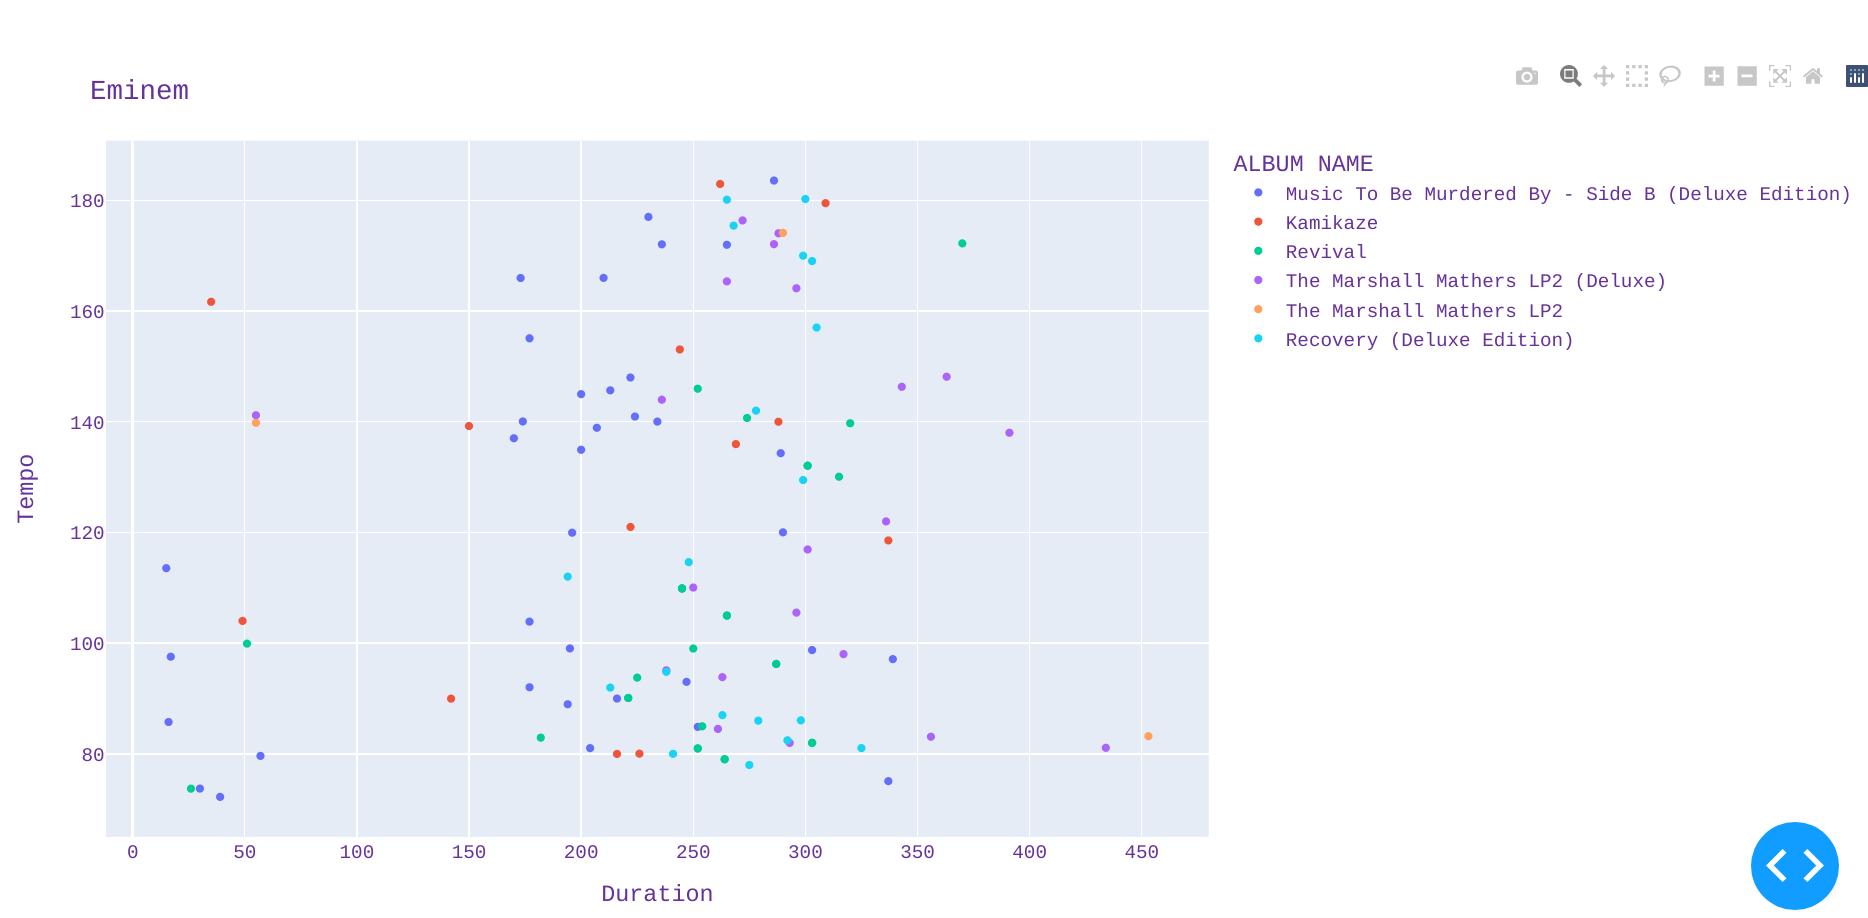
Bottom half
-
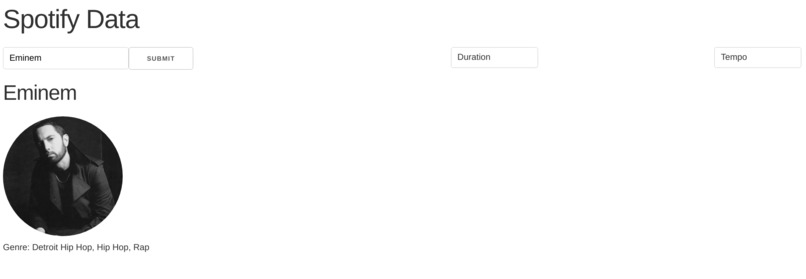
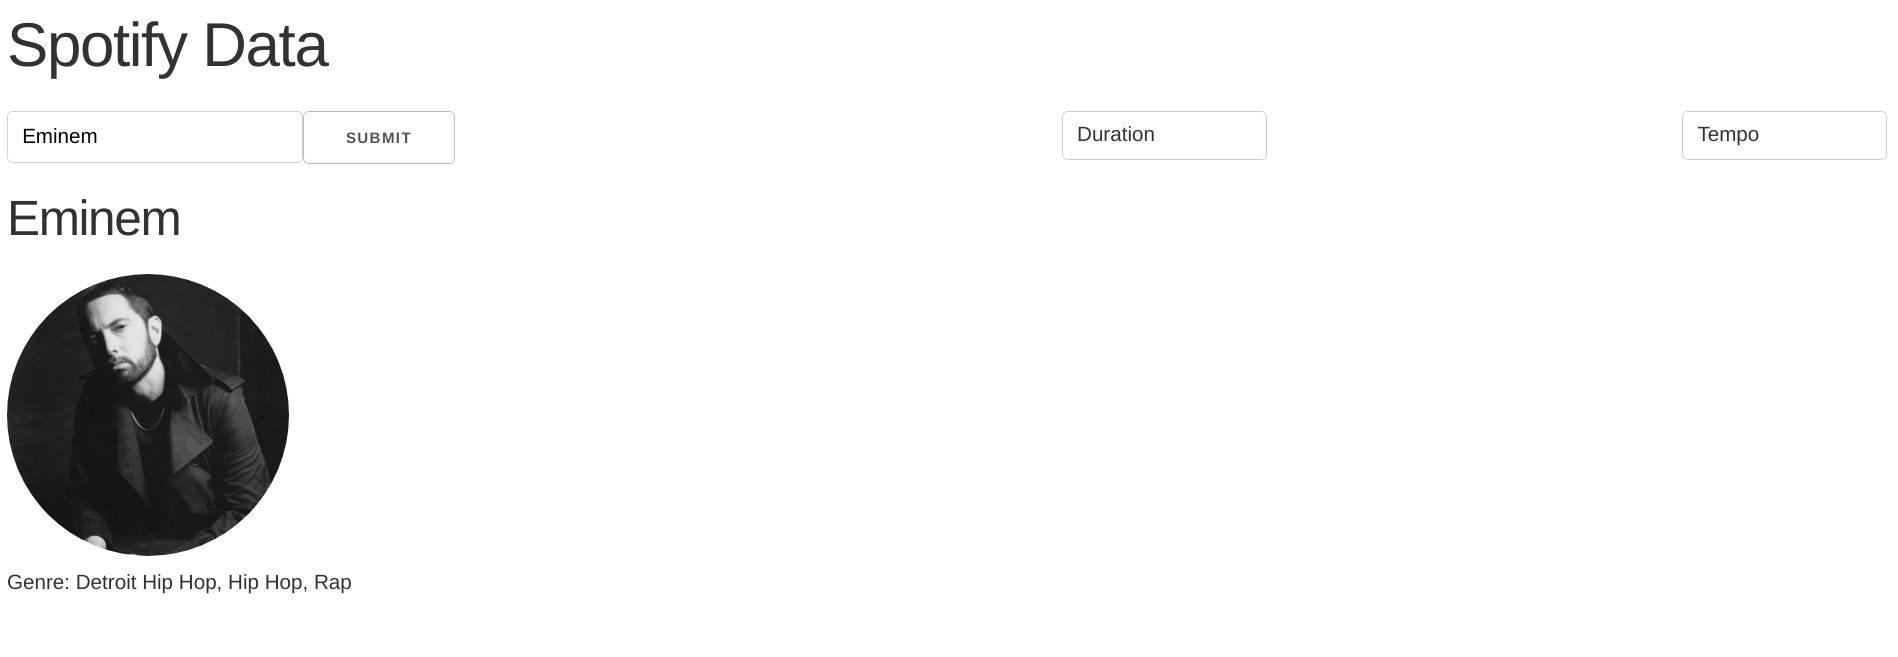
Top half of website
Project Details
We created a user interface to generate visualizations describing the music of Spotify artists. The user inputs an artist and is then able to easily plot parameters of the music. Some of the parameters include:
Song duration Publication date Tempo (beats per minute) Energy (perceptual measure of intensity/activity) Valence (how positive/negative a song is)
What We Learned
After struggling to get things deployed, we spent a majority of our time trying to style things so that they looked half decent. There is still quite a bit of work to do in this area:
Working with API’s Working with keys and tokens HTML, CSS, web development Working with Git Deploying products Managing websites Working with data frames A little bit of music theory
Challenges We Ran Into
The majority of the day went surprisingly smoothly until it came to styling the webpage. After much frustration, we got something that our team is proud of. Challenges: Styling the website Figuring out what services are needed to deploy the web app and website Our lack of understanding of Git came back to haunt us Parsing messy data Edge cases when using the API
Accomplishments
We got a web app off of the ground in less than a day and got a pretty good application tacked onto. The tool used here is something that we can definitely see ourselves using in the future, not only to compare songs by an artist but also to find similar songs by other artists.
We also learned an absolute ton about web development as well as a bunch of other useful technologies. Interfacing with an API and being able to use the Dash framework will definitely come in useful in the future.

Log in or sign up for Devpost to join the conversation.