-
-
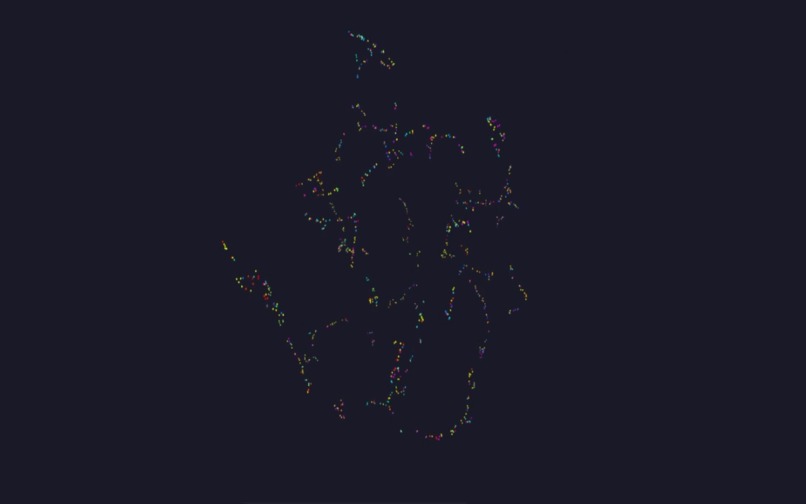
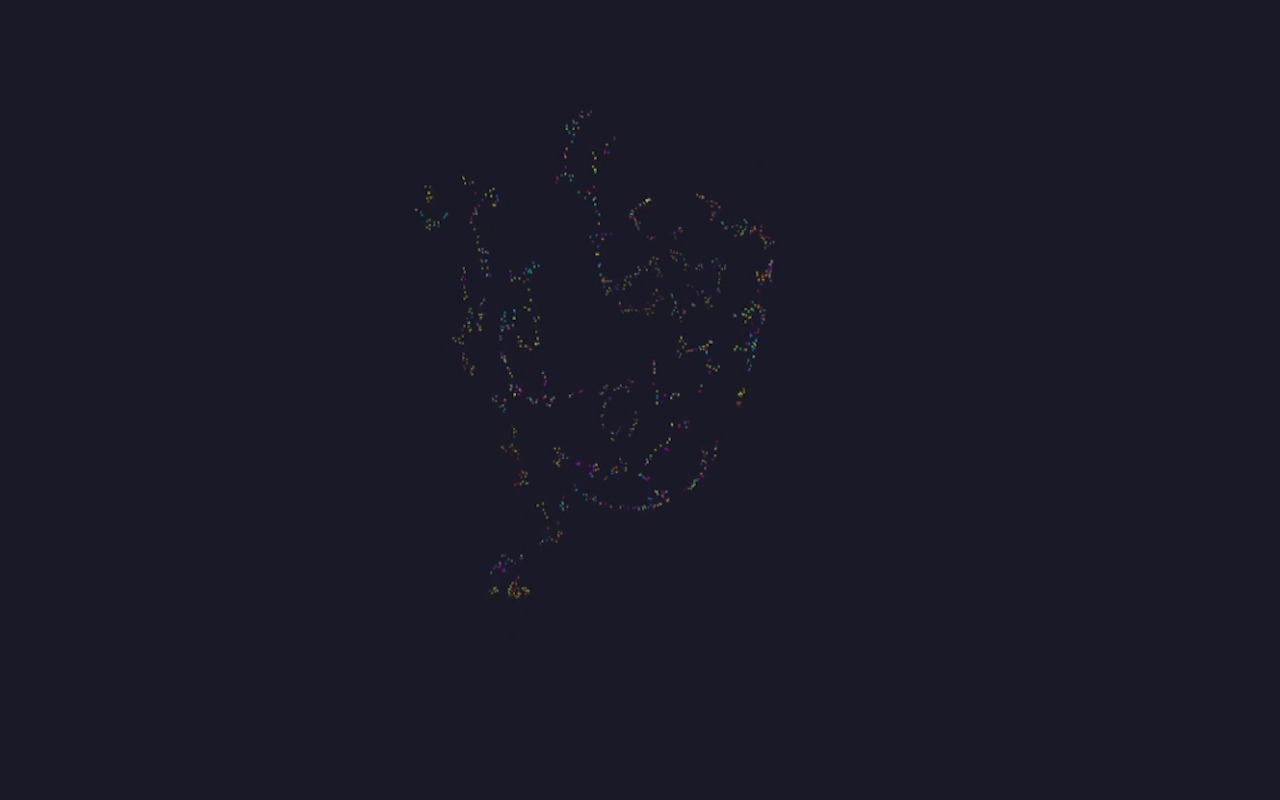
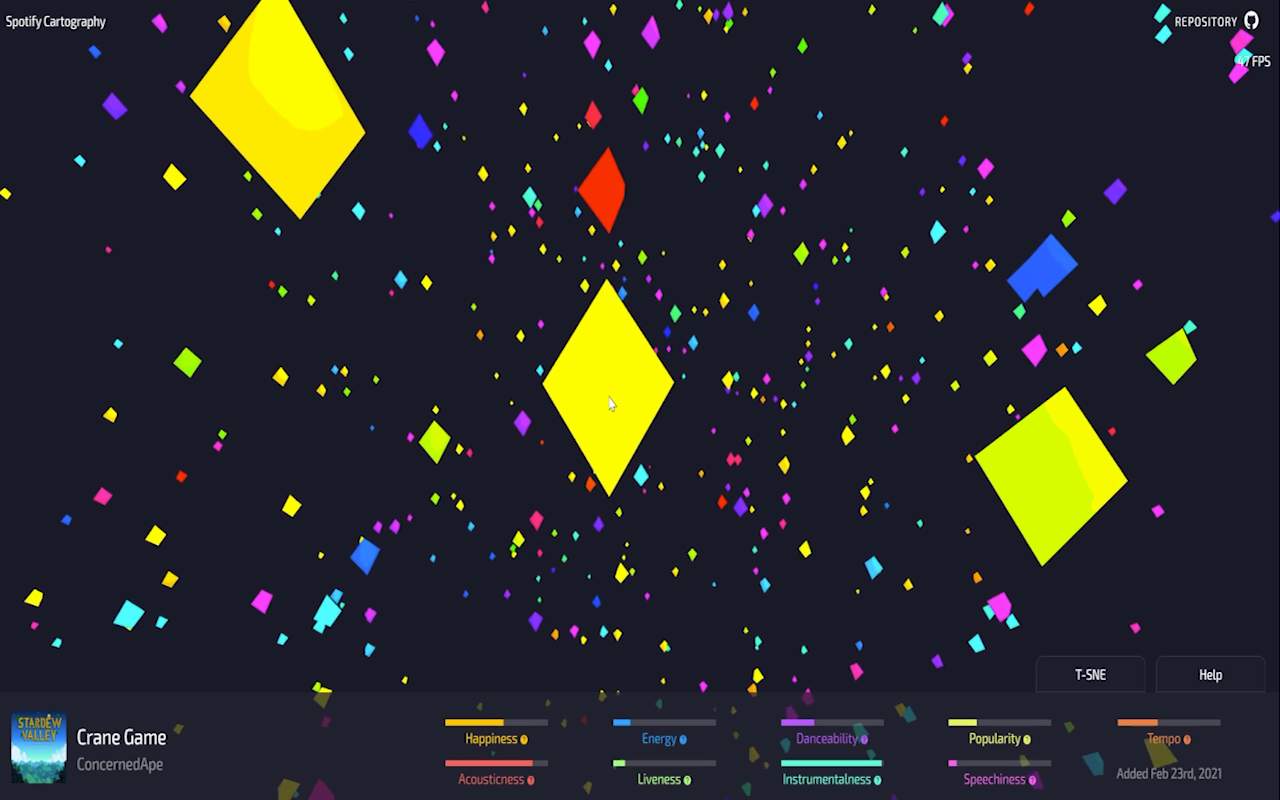
Example three-dimensional map 2
-
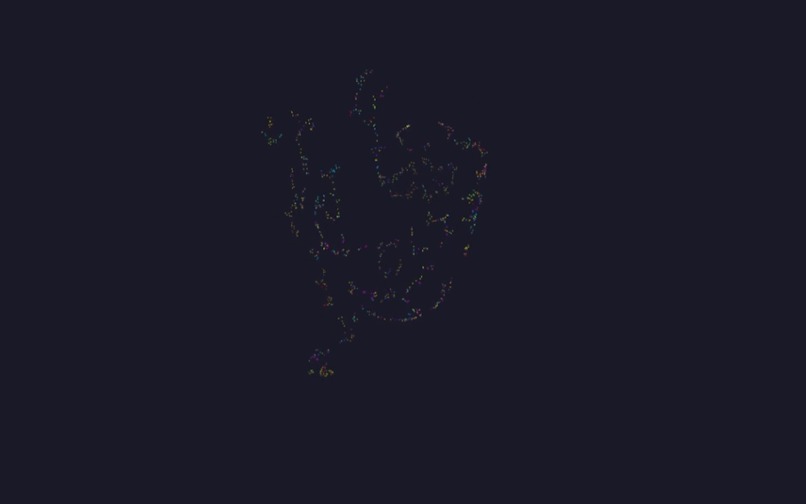
Example three-dimensional map 1
-
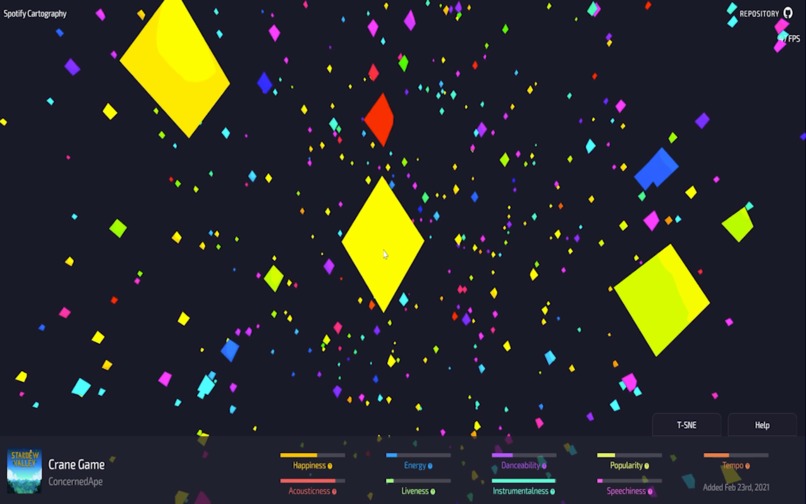
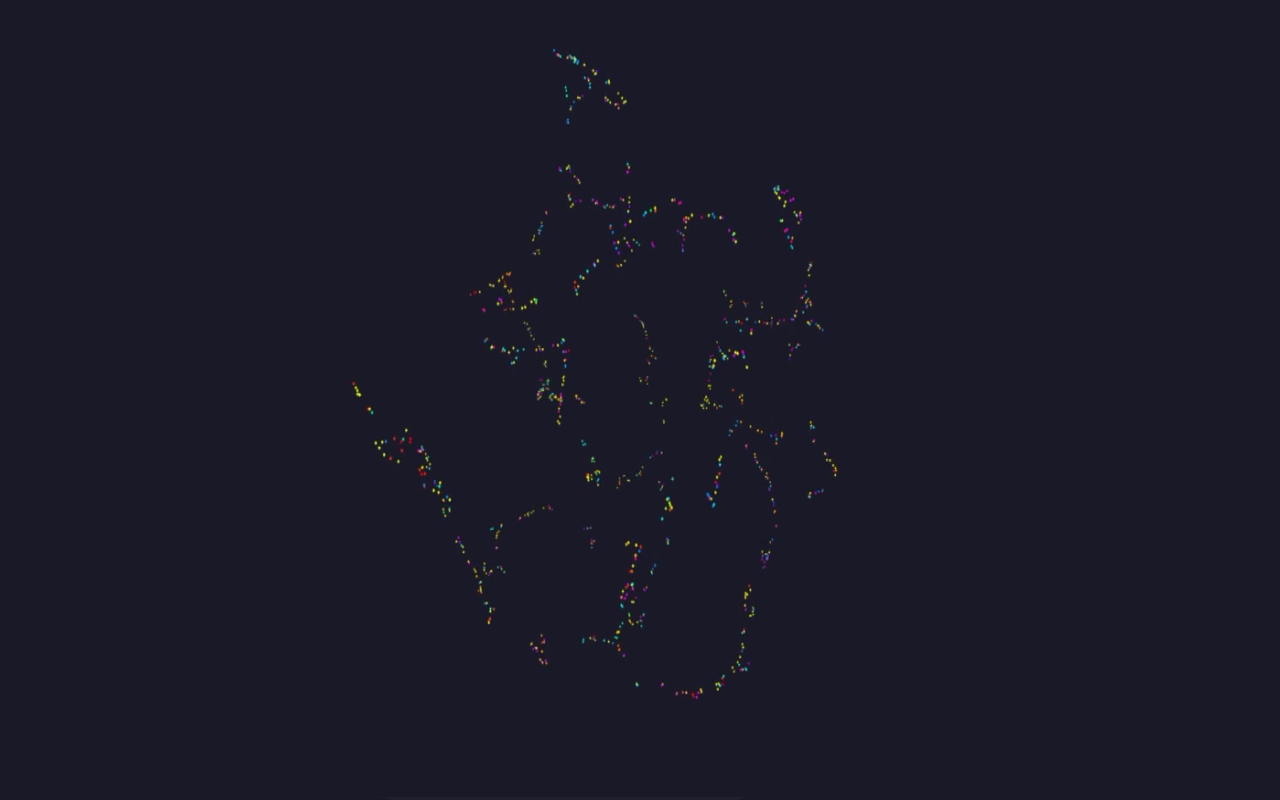
Viewing songs on the three-dimensional map 1
-
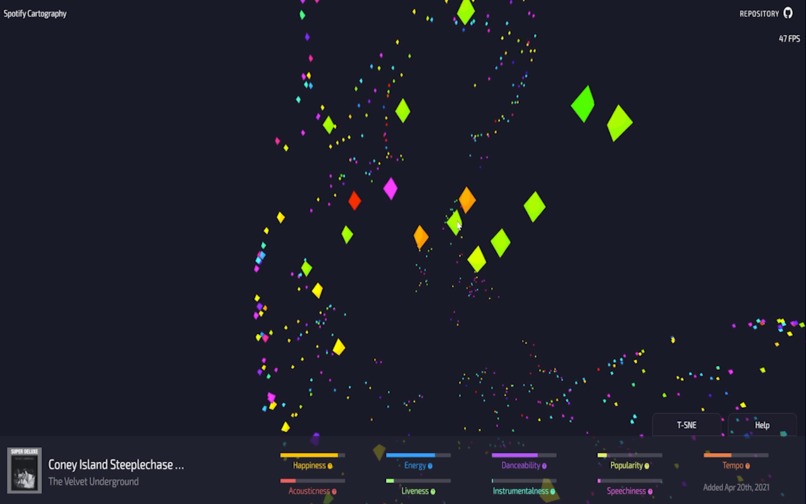
Viewing songs on the three-dimensional map 2
-
Landing page!
-
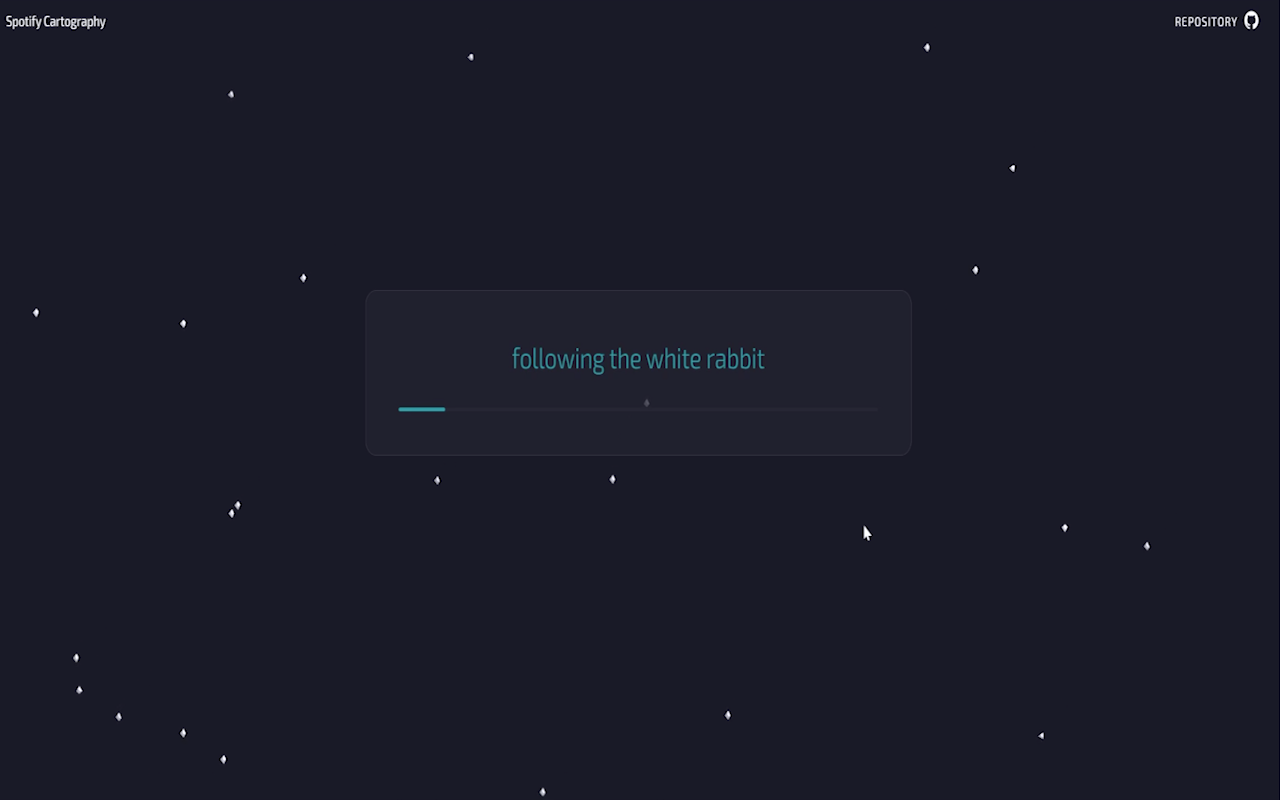
Loading page with messages


Inspiration
I love music, but navigating my music has always been a challenge. I have almost 400 playlists on Spotify and keep on adding more songs. I'm always looking for better ways to organize my music.
I've been obsessed with Spotify's API for a while. It not only offers access to my entire library but also statistics on each song that Spotify has generated using machine learning. Spotify can tell you how happy a song is, how energetic it is, what's the likelihood it was performed live is, and other cool statistics.
While making charts of my happiest or least energetic songs is entertaining, I've always wanted to apply t-SNE to the data to see how it'd pan out.
What it does
Log in to Spotify Cartography with your Spotify account, and it will request every song you've saved to your Spotify library as well as each song's "audio features", or statistics mentioned earlier.
Spotify Cartography will then run the data through t-SNE to generate a 3D map of similar songs, allowing you to fly through your library, viewing clusters of similar songs. Use left-click, right-click, and middle mouse buttons to orbit around the scene.
Songs are color-coded based on when you added them, so you might find a pocket of songs added around the same period when you were super happy, or lacking energy.
Hovering a track will show you all of its data, including the cover art, title, artists, and audio features. You can control-click any track node to play it in Spotify!
How I built it
The website was built using Vue.js; I'm a big fanboy of Vue. The Vuex store was used for most data, as it's global and allows me to manage the mutation of the data.
The 3D graphics were done using Three.js. There's a lot to learn and plenty more optimization to be done as far as the 3D scene. I'm new to 3D libraries so I did whatever was quick and dirty!
I used the Spotify API to request saved tracks and audio features. The chef's kiss was adding Spotify's Web Playback SDK, which allows the website to become a playback device, and receive real-time data on playback. Pain to implement, tiny small additional features. The only benefit really is avoiding rate limits.
The npm library @keckelt/tsne was used for processing the data. At first, I was interested in implementing it myself based on the papers I found, but shortly realized it was best left for another time.
Past that, a lot of time, love, and patience.
Challenges I ran into
Three.js on the other hand was completely new to me, as I had never worked with a 3D library before. I had dabbled in p5.js for 2D rendering, but Three.js was a learning curve. I had to tinker around for a long time and refactor a couple of times before things started working.
Finding the right t-SNE library was a disaster. At first, I tried karpathy/tsnejs which I had to copy and paste, then convert to Typescript. After that didn't work, I moved on to the npm package tsne-js, which broke on me as well. I finally found the npm package @tensorflow/tfjs-tsne, only to work with it for hours and discover it had been abandoned by its creators and was only compatible with @tensorflow/tfjs@0.14.2, which still didn't work for me. I finally settled on an npm library @keckelt/tsne which worked and moved on. This wasted a lot of time and became the biggest hurdle for the project.
Accomplishments that I'm proud of
The application itself is fun to play with. I have had this dream of running t-SNE on the data, and I'm so happy it worked. I can't wait to add VR, playlist selection, and other fun tools that allow people to explore this space more.
Breaching into 3D rendering was difficult, but worked out in the end. I'm proud I was able to figure it out and make Three.js work for me. That would have been a deal-breaker.
What I learned
I learned I need to test libraries out with sample data before I commit to using them. Realizing most t-SNE libraries weren't going to work for me was a real bummer.
I learned a lot about 3D rendering and the power of Three.js, I hope to implement it in future projects.
What's next for Spotify Cartography
A VR extension would be awesome! I own an Oculus Quest 2 and would love to experience this 3D map of my music in VR.
Tools to allow users to select areas and generate playlists based on the songs inside would be nice, or multiple selections. The goal is to allow the user to group music and then create something based on their groupings.
Boid Boogie / Spotify Cartography?
Spotify API only allows new apps to manually enter 25 individuals to log in with new applications until they receive a quota extension and review. This can take up to 6 weeks.
By using an API key for a previous project, https://github.com/andyruwruw/boid-boogie, I can use it's unlocked API key to allow anyone to access Spotify Cartography.


Log in or sign up for Devpost to join the conversation.