-
-
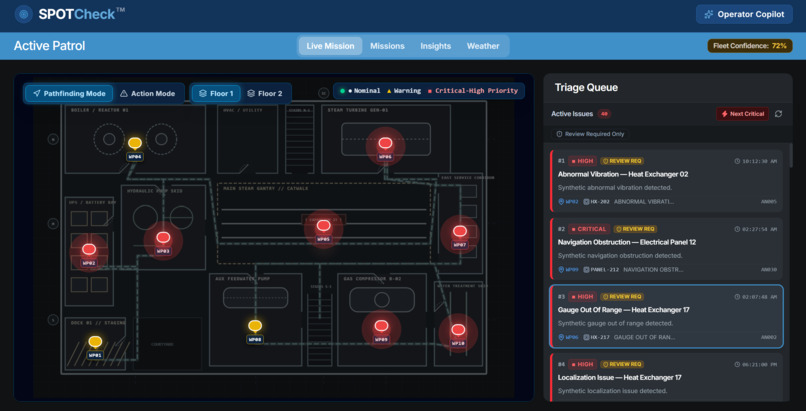
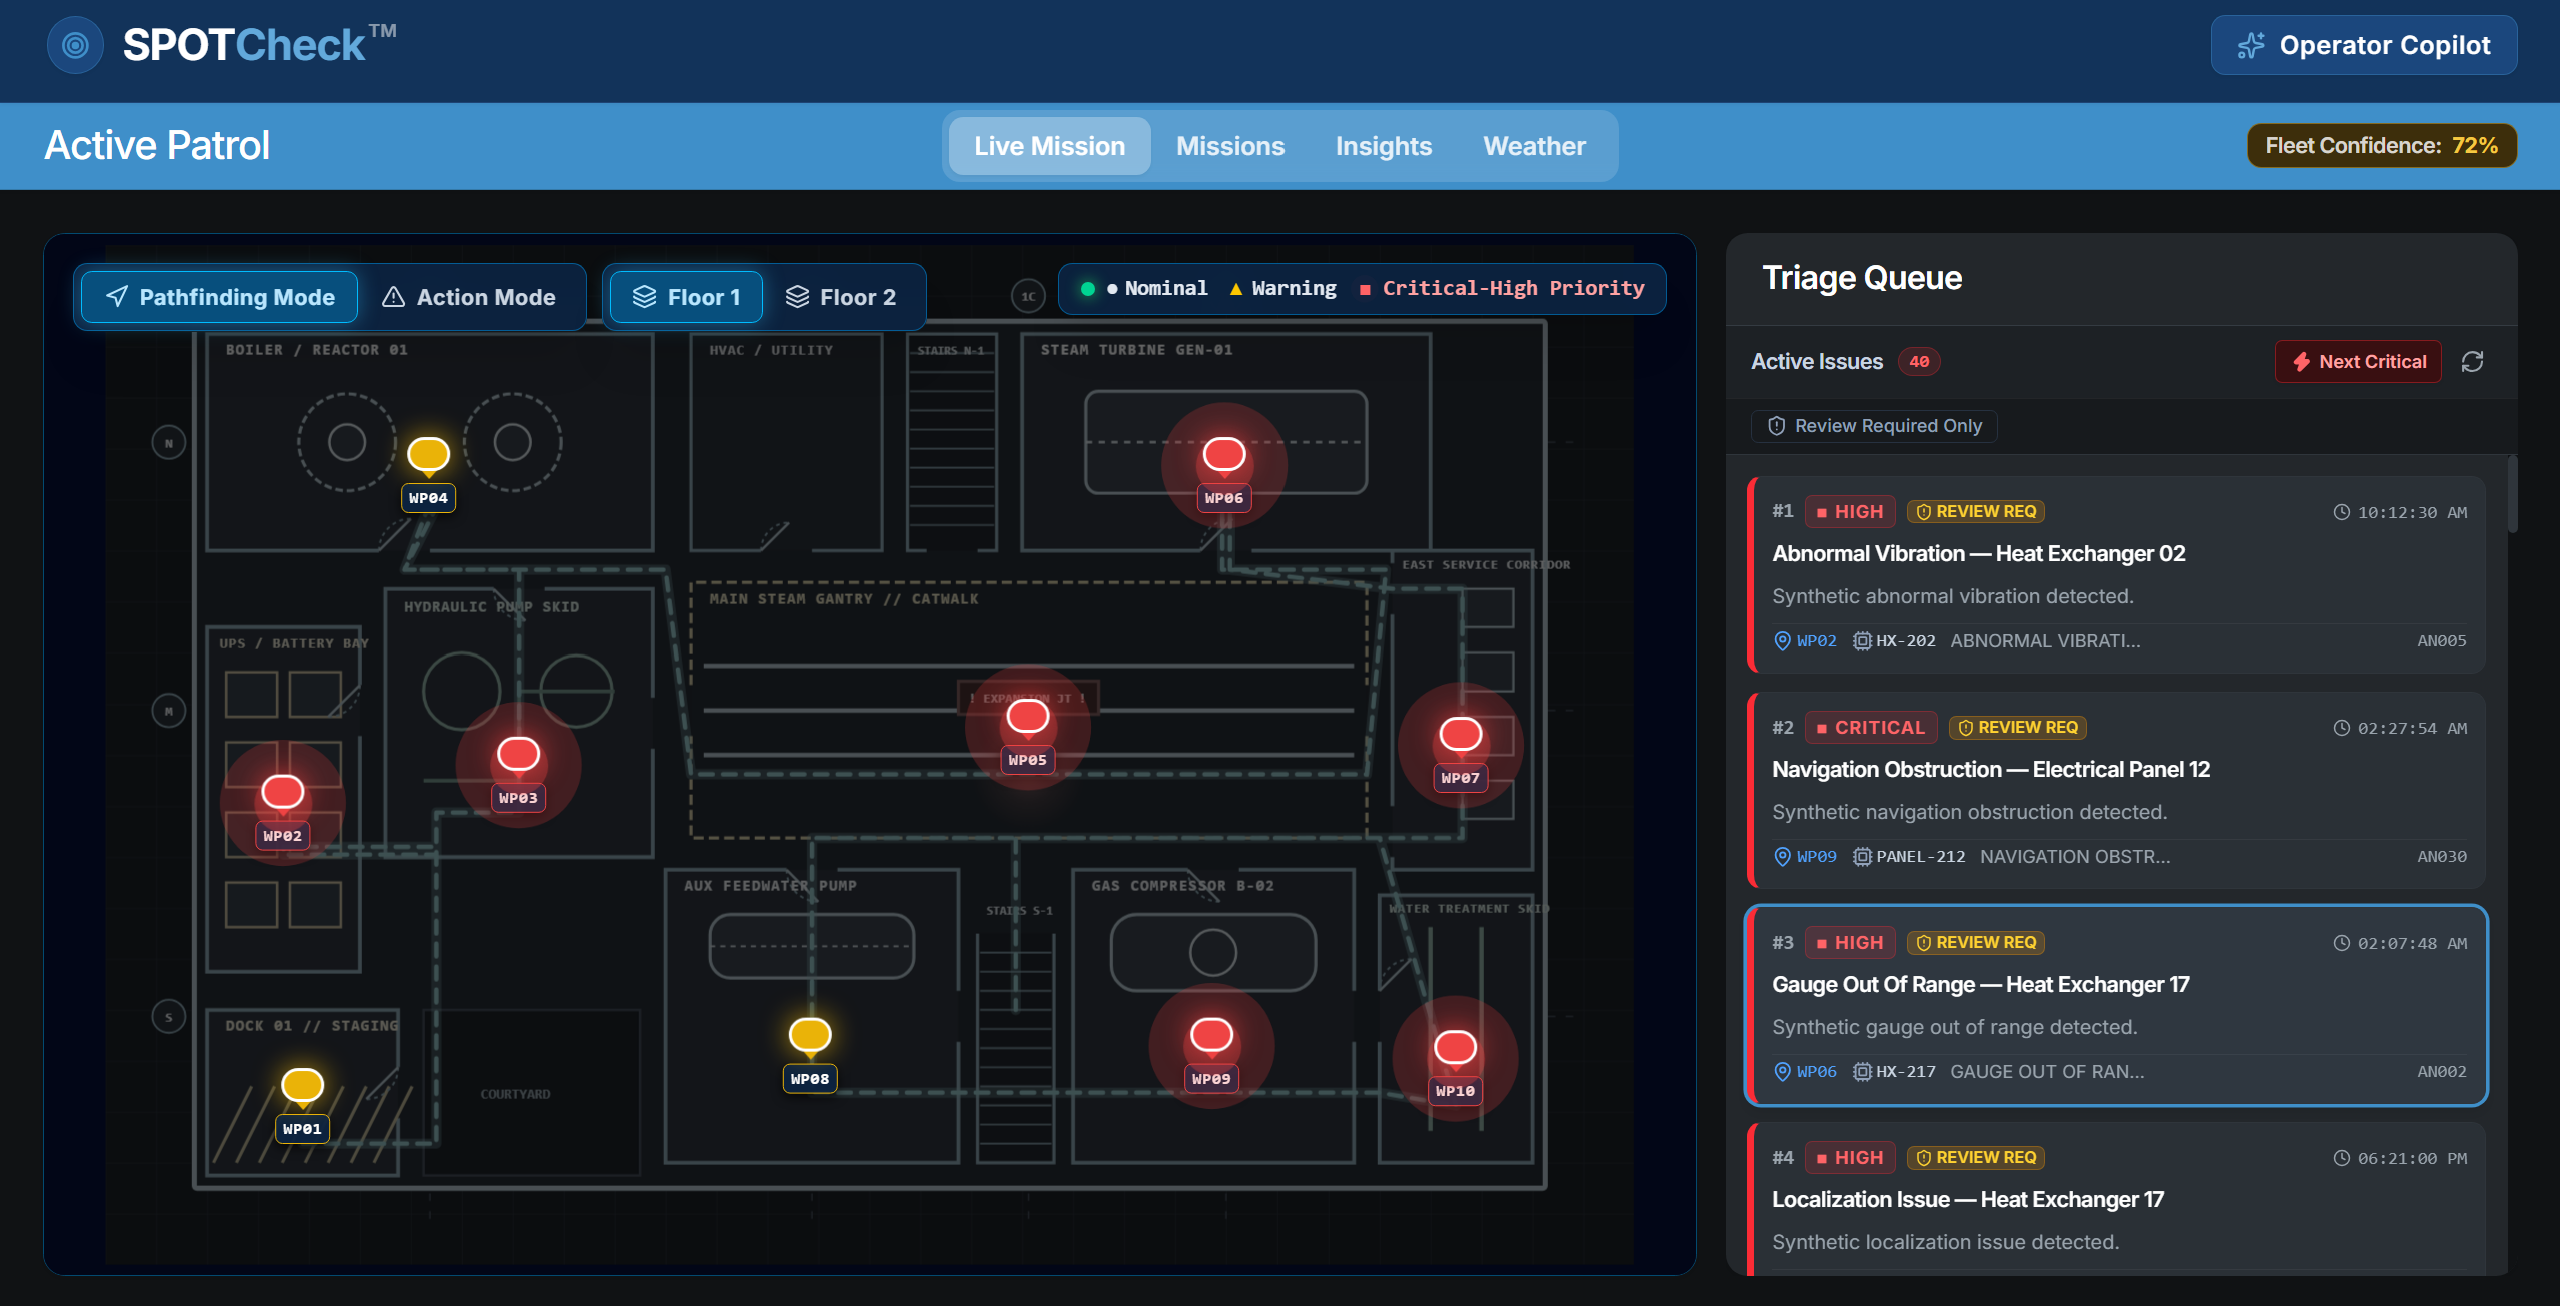
Live Mission Page
-
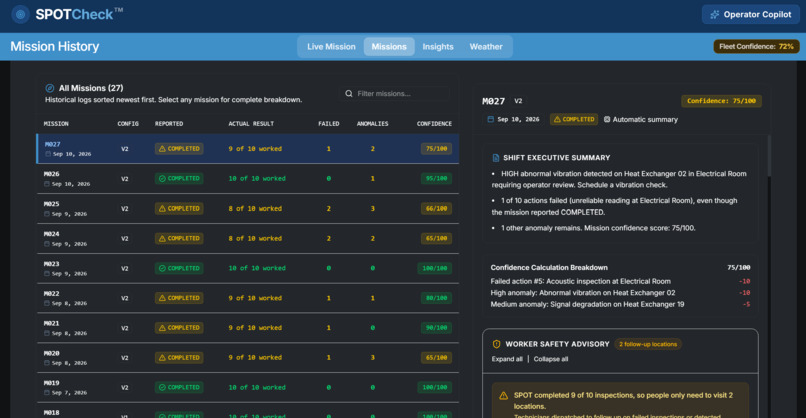
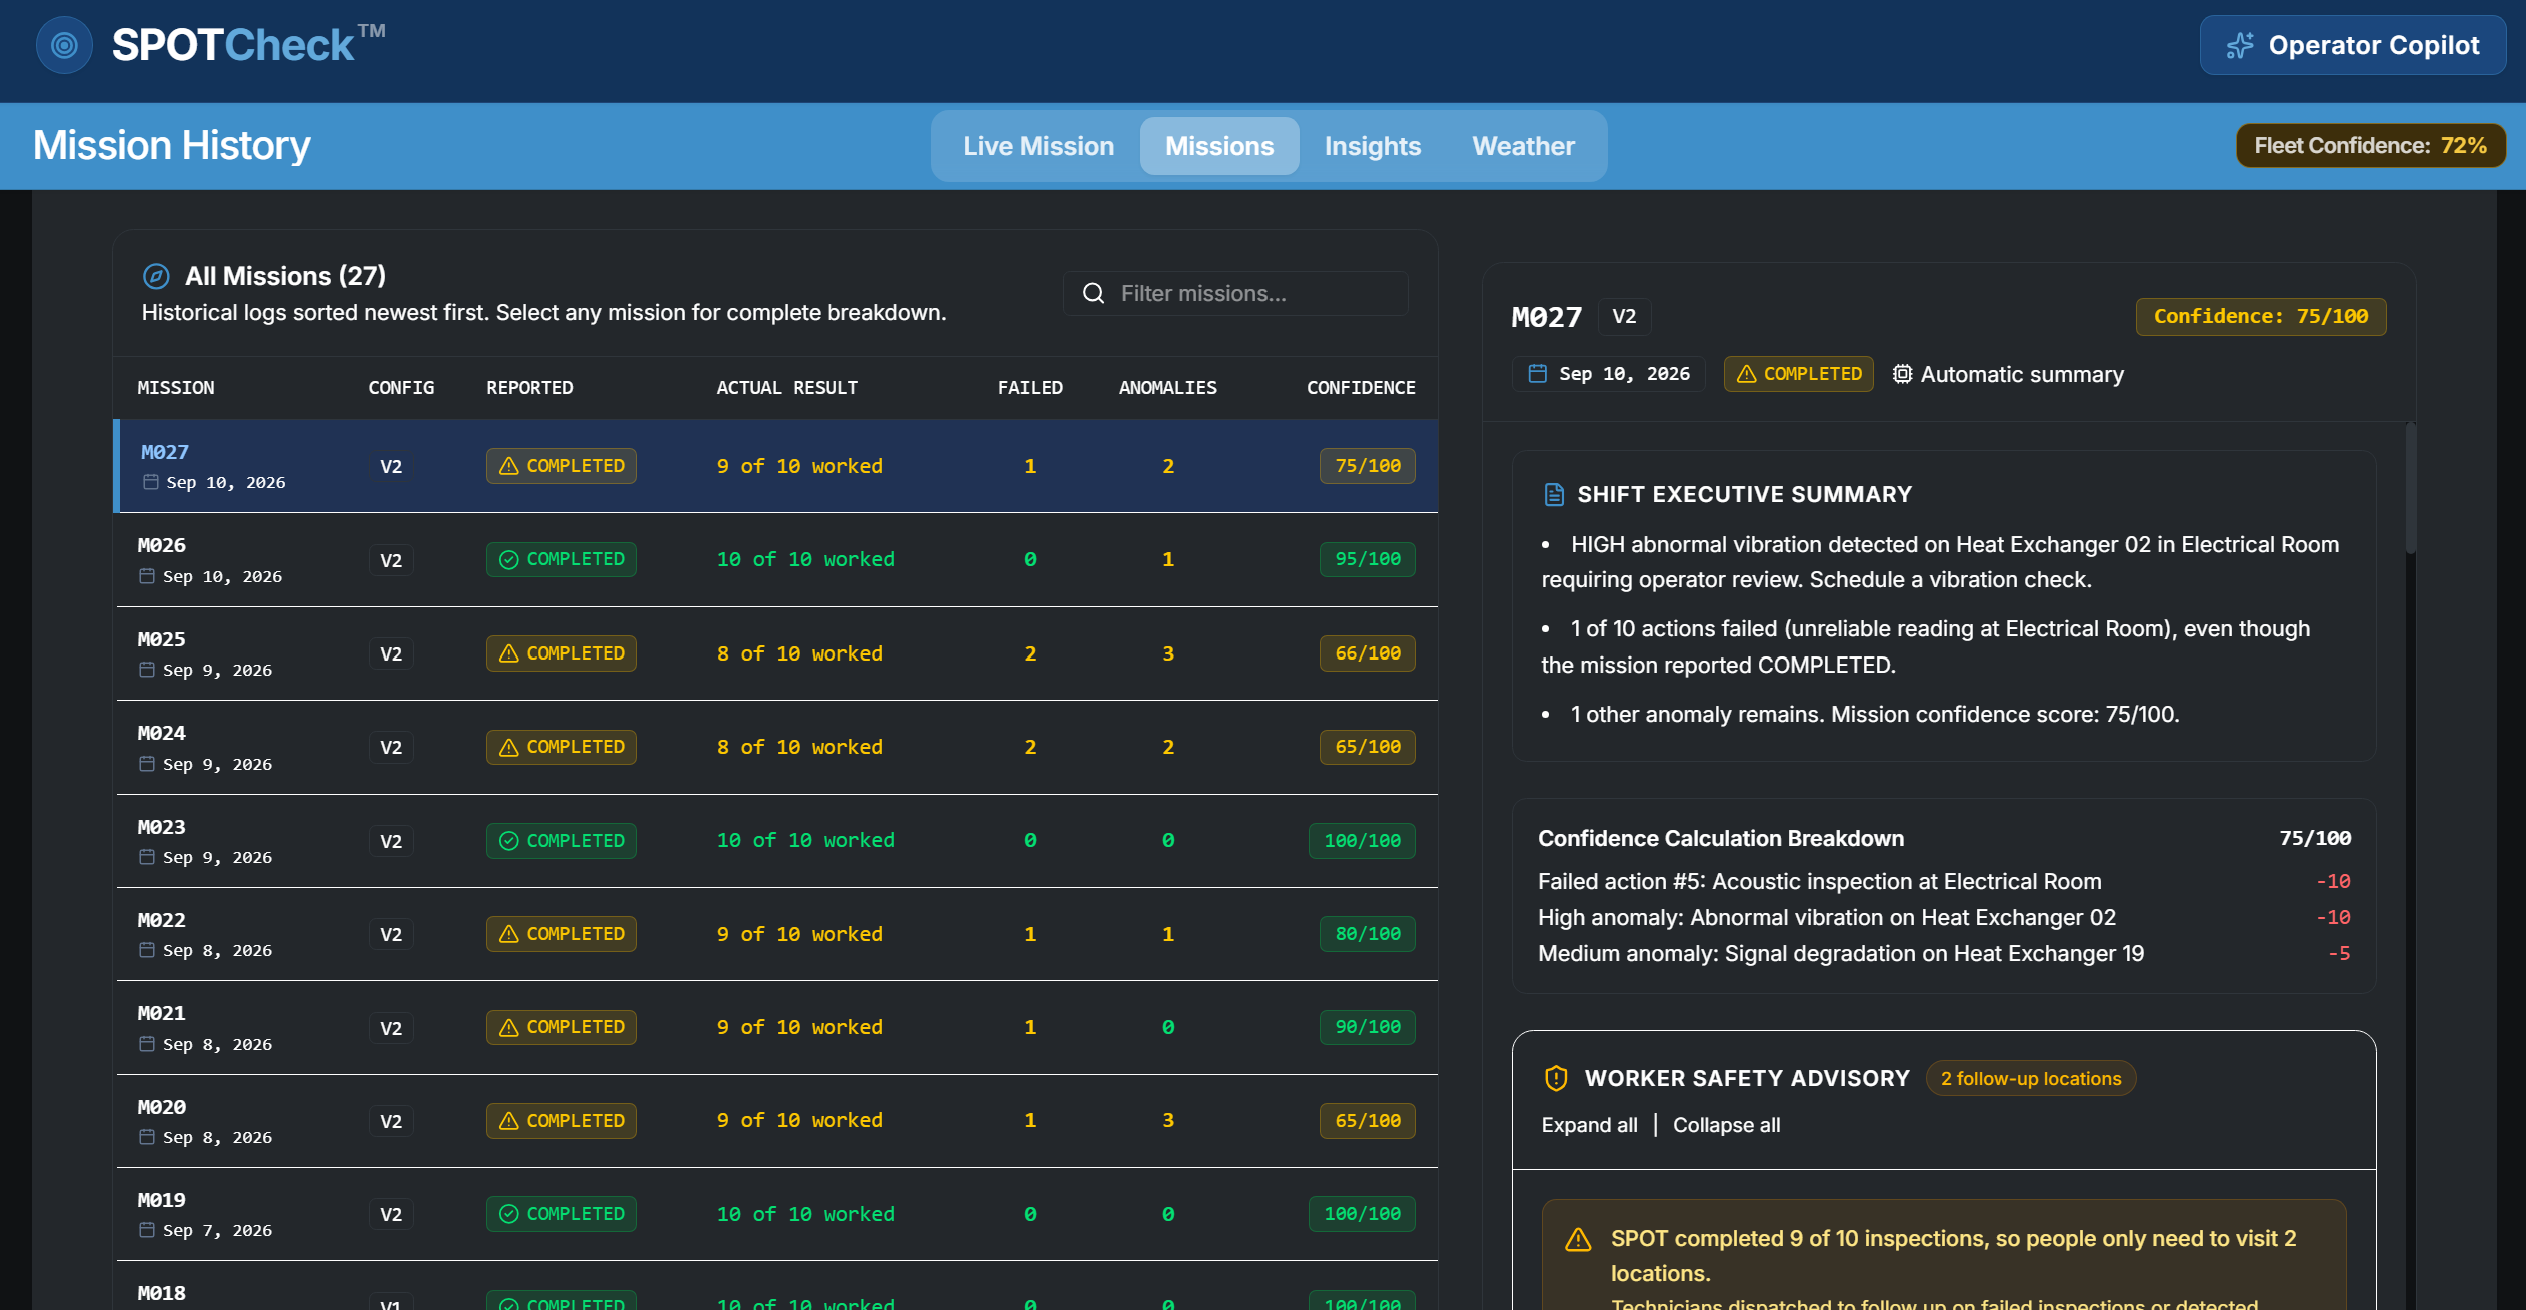
Missions
-
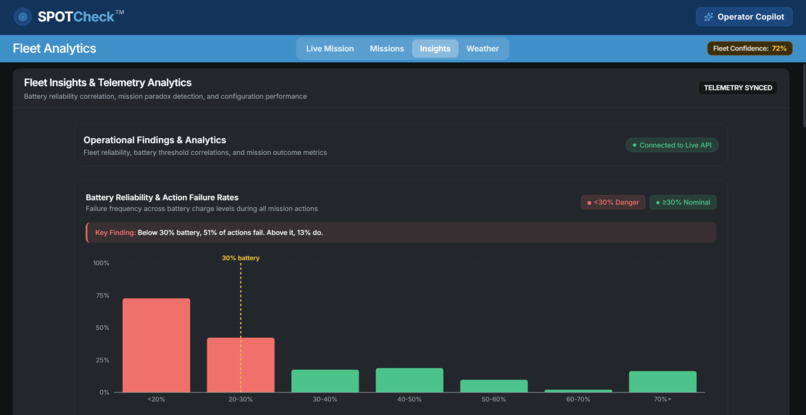
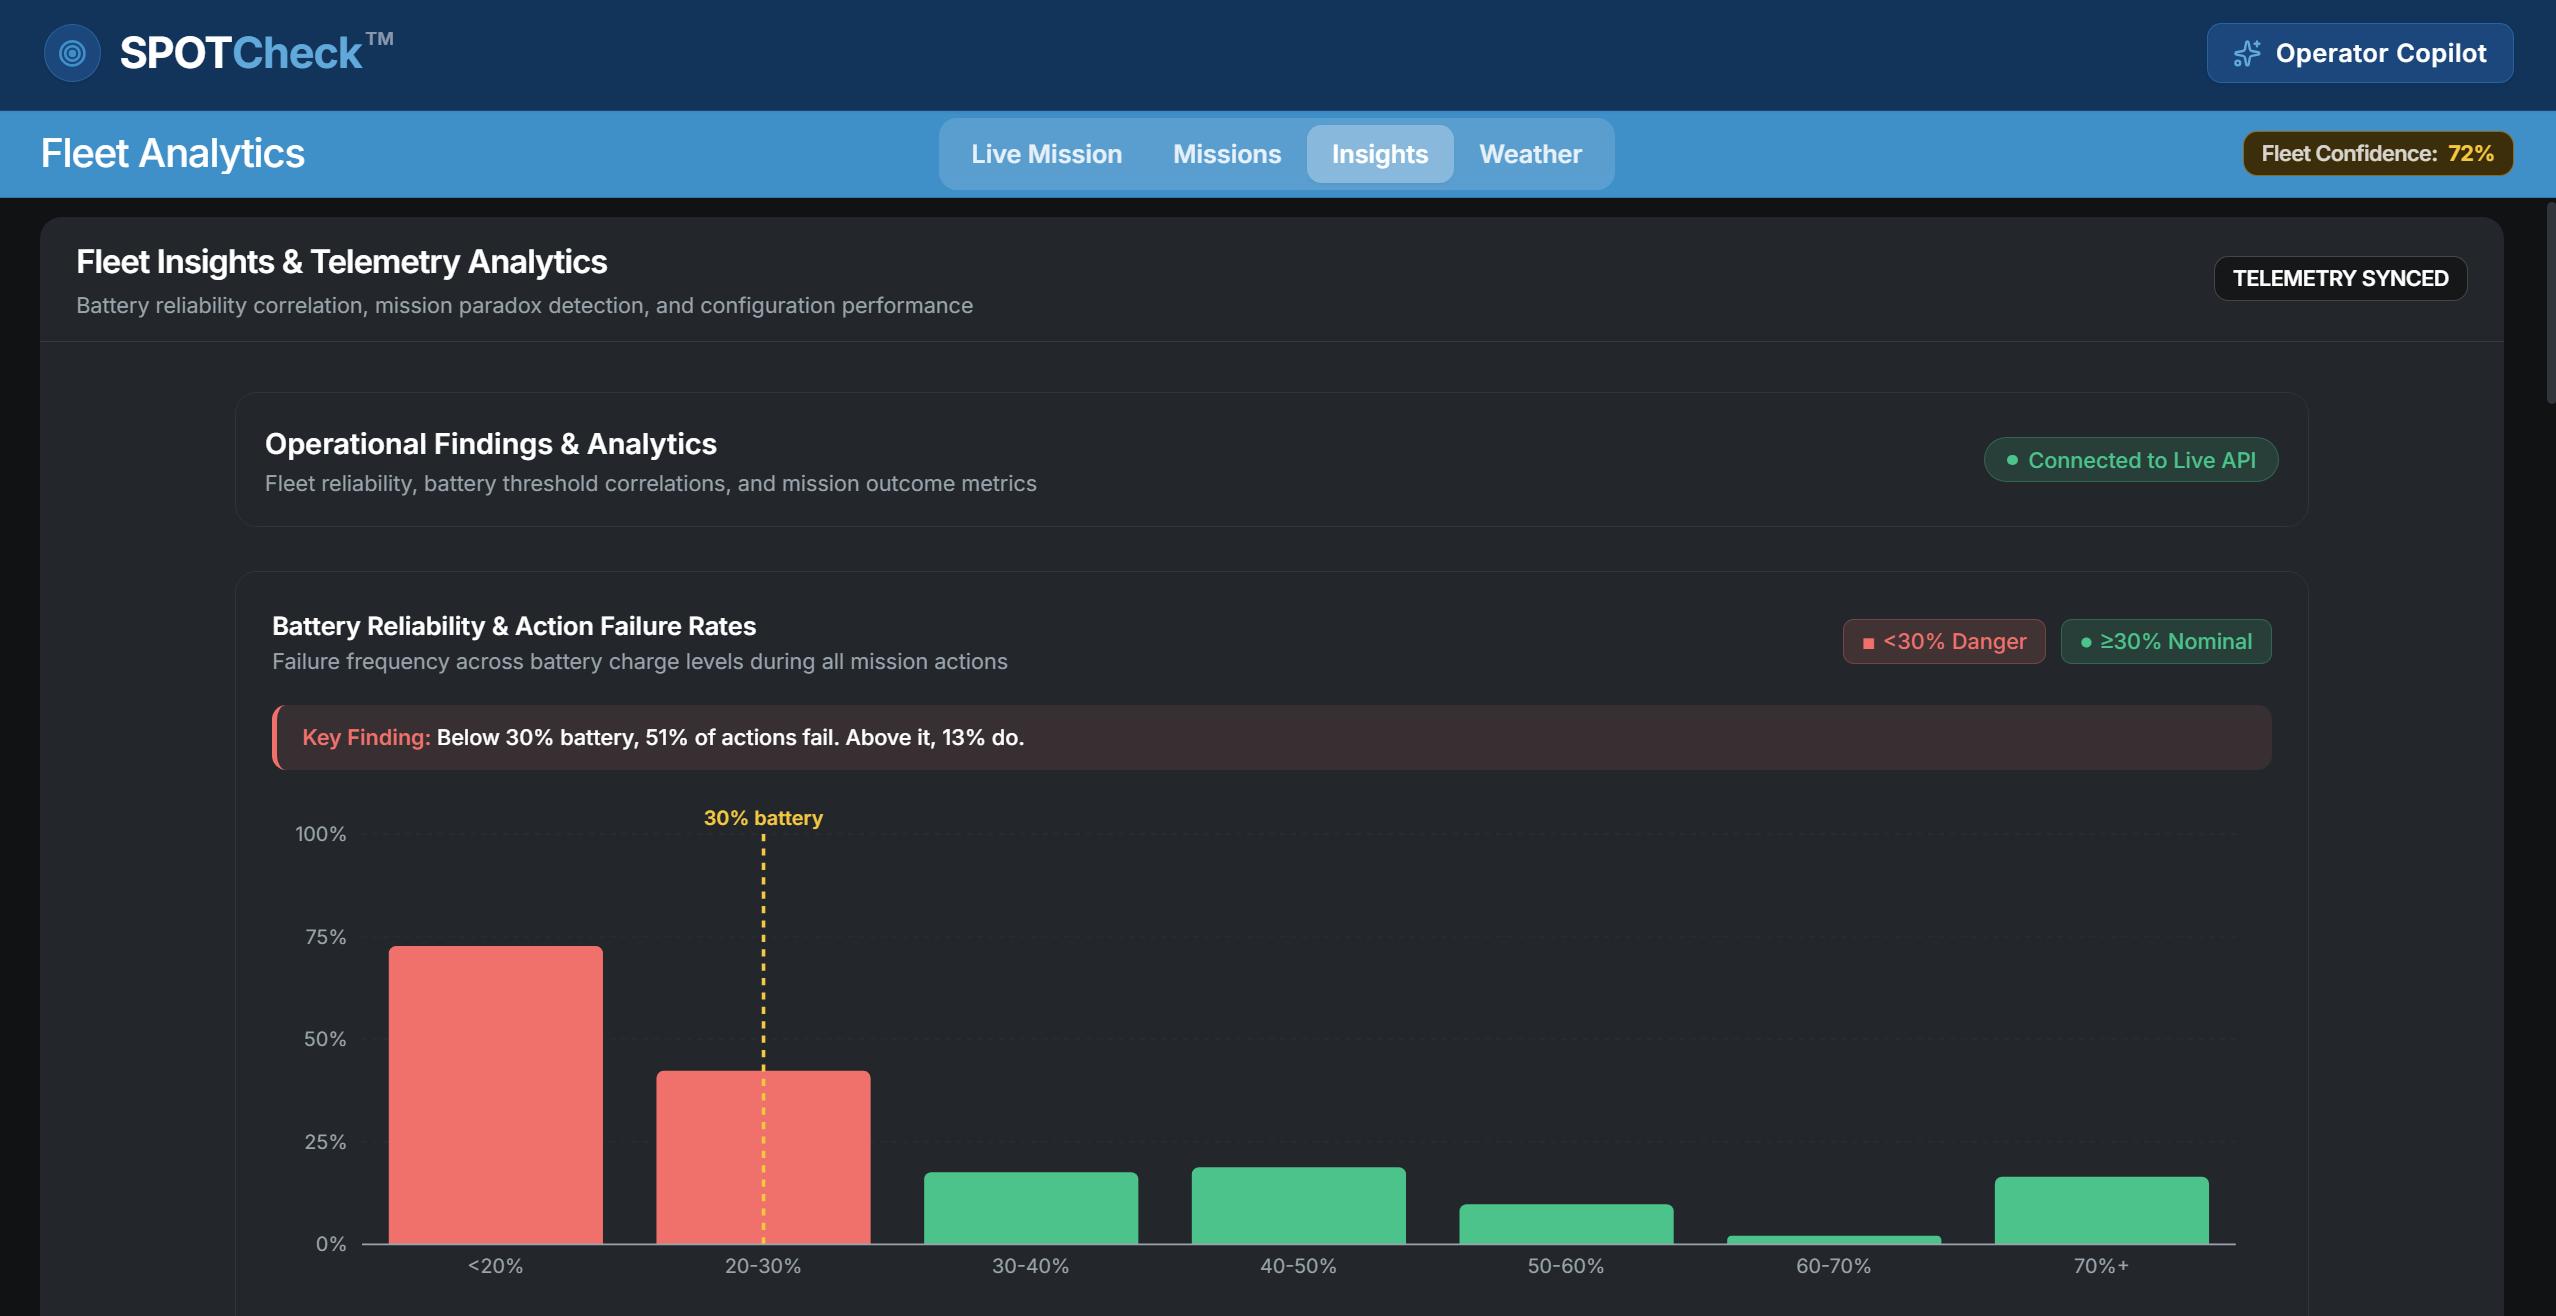
Insights
-
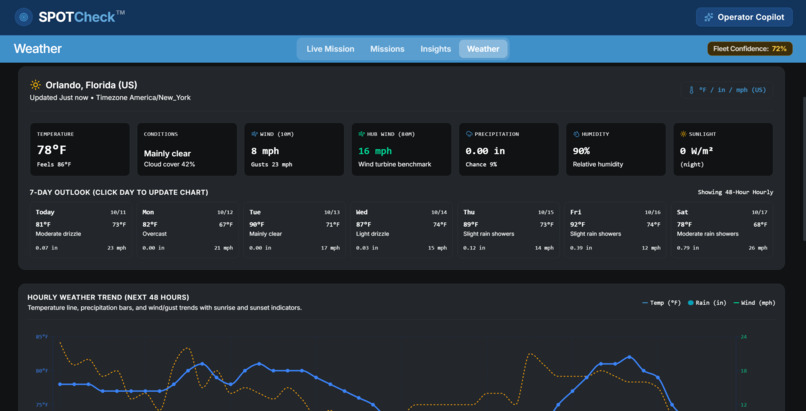
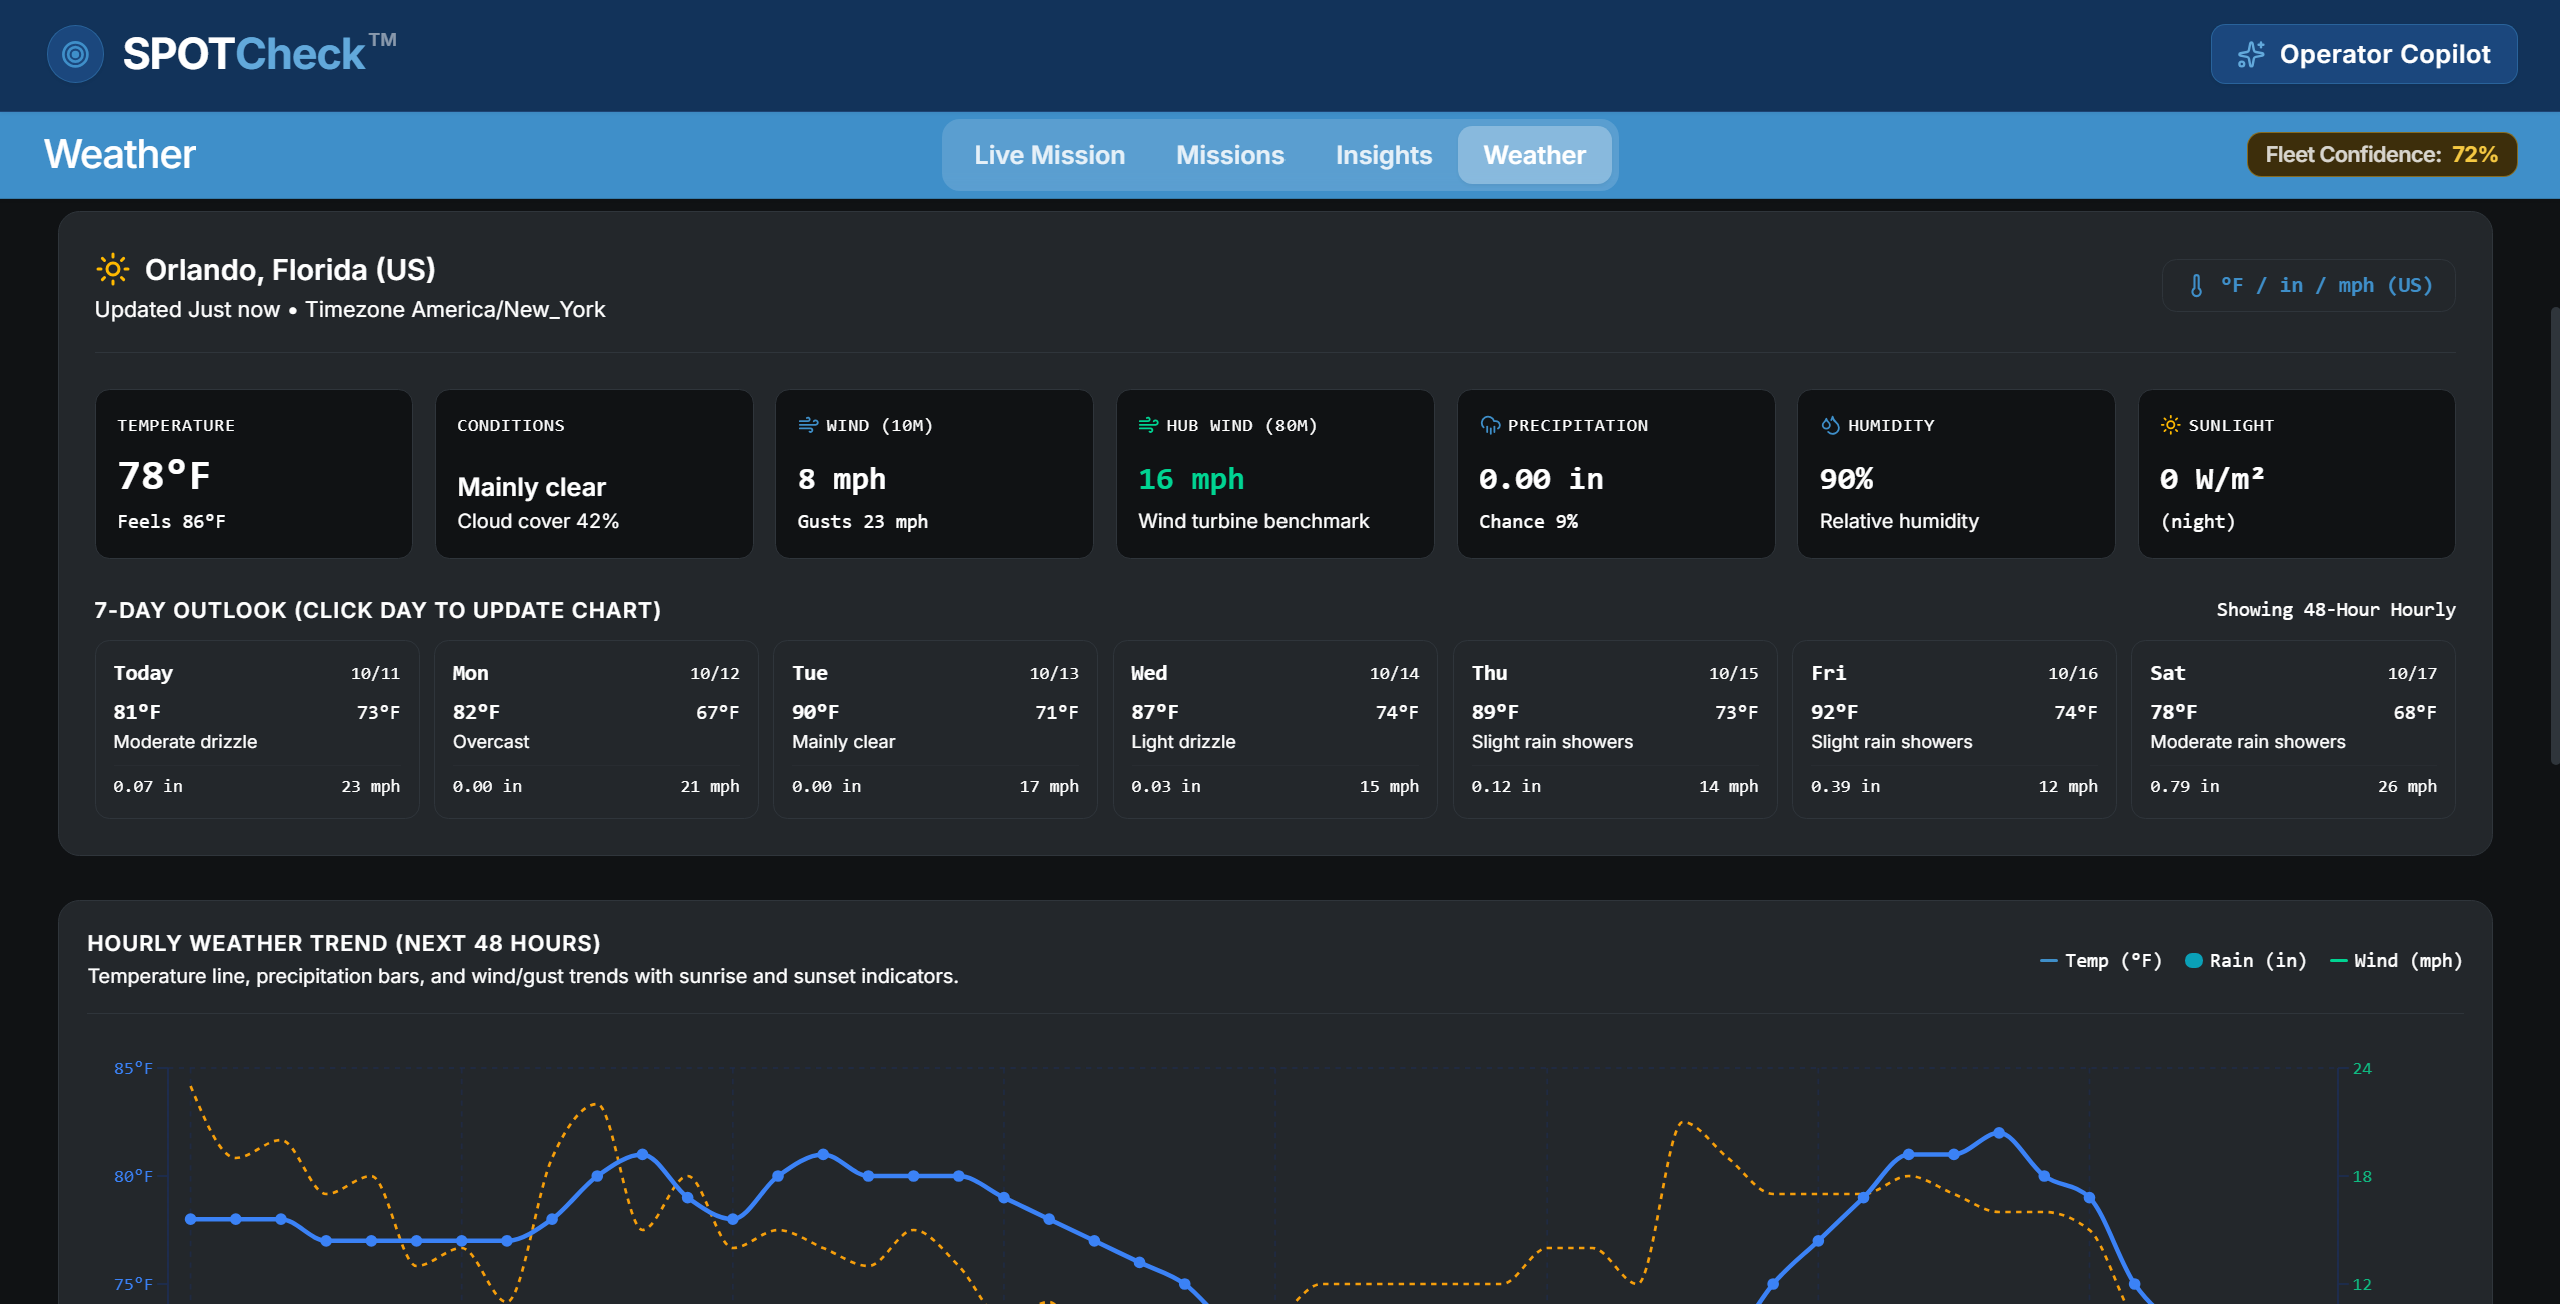
Weather
Inspiration
NextEra Energy's challenge asked a simple question: how can plant operators understand what Boston Dynamics' SPOT robot sees, without becoming technical experts? We were inspired by two things: the company's focus on building tools around the people who actually use them, and the chance to work with a real inspection robot's mission data.
Digging into the data, we found the problem that shaped everything: a mission marked "Completed" doesn't mean the inspection worked. In the challenge data, 21 of 26 missions that reported Completed had failed actions inside them, and 38 of 40 anomalies were found during missions that still said Completed. An operator starting a 6 AM shift would have no idea. That gave us our tagline:
SPOT says Completed. We show what actually happened.
What it does
SPOTCheck is an operator dashboard that turns SPOT's raw mission data into plain-English answers: what happened, where, why it matters, and what to do next.
- Live Mission: an interactive plant map with SPOT's route and an Action mode that highlights failed actions and their likely causes, next to a risk-ranked triage queue (severity × asset criticality) so operators see the most serious issue first.
- Mission History: each mission's real results next to its reported status, a 3-bullet shift-handoff summary, a confidence score with its breakdown, worker-safety guidance for follow-up visits, and a pre-mission risk forecast.
- Fleet Analytics: our findings, a configuration comparison, predictive maintenance alerts (Trend Watch), and an honest look at how accurate our predictions are.
- Weather: a location-based forecast with official NWS alerts, showing how the same weather affects different plant types: nuclear, natural gas, solar, and wind.
- Operator Copilot: a chat assistant built into the top bar for quick questions.
Try it: https://spotcheck-chi.vercel.app
How we built it
Backend: Python with FastAPI, a Neon serverless PostgreSQL database (with a CSV fallback so the demo never breaks), and Gemini for AI-written text. Frontend: TypeScript, React, and Next.js with Tailwind CSS, Recharts, and Leaflet. We deployed on Vercel and Render, and used Claude and Antigravity as AI coding assistants throughout development.
We chose Neon so all four of us could share one live database from day one: the challenge CSVs are seeded into Neon, and every metric, score, and forecast is computed from it at request time, never hard-coded.
Mission Confidence Score
Each mission gets a 0 to 100 score that tells operators how much to trust it:
$$ \text{score} = \max\left(0,\ \min\left(100,\ 100 - 10F - \sum_{i} w_i\right)\right) $$
where F is the number of failed actions and wᵢ is each anomaly's weight: 15 (critical), 10 (high), 5 (medium), or 2 (low). The fleet average is about 72.
Shift summaries
When a mission ends, SPOTCheck produces exactly 3 bullets from that mission's facts only: the most serious issue and what to do about it, what failed even though the mission said "Completed," and the confidence score. Gemini can phrase the bullets; if it's unavailable or returns the wrong format, a deterministic template takes over, so summaries never break. Missions with no failures and no anomalies get an instant "All clear."
Predicting problems before they happen
We built a risk forecast that predicts each action's chance of failing before SPOT walks the route. It's a logistic regression, written in plain NumPy:
$$ p = \sigma(\mathbf{w}^\top \mathbf{x} + b) = \frac{1}{1 + e^{-(\mathbf{w}^\top \mathbf{x} + b)}} $$
using inspection type, location, configuration, and a projected battery level, since the real battery level isn't known before a mission runs. For a whole route of n actions:
$$ P(\text{at least one failure}) = 1 - \prod_{i=1}^{n} (1 - p_i) $$
Operators can try what-ifs with the start battery and configuration. The model is built in the background when the server starts, so forecasts are ready right away.
We also built Trend Watch, which flags equipment whose last three readings are steadily getting worse, and backtests how often those trends were followed by a real failure.
Weather and power plants
The Weather page uses one shared forecast, then shows how it affects each plant type using well-established engineering rules, labeled as typical values. For example, gas turbine output drops in warm air:
$$ \text{output} \approx 100\% - 0.7\% \times (T - 15^\circ\text{C}) $$
and wind turbines produce nothing below a cut-in speed and shut down above a cut-out speed to protect themselves.
Challenges we ran into
- Our scope was too big. We kept finding exciting features (predictions, weather, worker safety, 3D maps) and had to keep deciding what mattered most for operators. We cut what didn't serve them, like a 3D map and an anomaly page that duplicated the triage queue.
- Merge conflicts. With four people working in parallel, two of us sometimes changed the same file at the same time. We adopted a strict workflow: branch first, pull from main, never push directly to main, test every change before merging, and keep each change to as few shared files as possible.
- Staying honest with synthetic data. The data is fictional, and the replay file stops partway through mission M023. We made sure predictions never "cheated" by using future information, labeled every estimate with its source, and avoided claims the data couldn't support.
- Keeping AI trustworthy. We gave the AI only verified facts, checked its output format, and built fallbacks so a bad AI response could never reach an operator.
Accomplishments that we're proud of
- An honest prediction model. Each of the 27 missions was predicted by a model trained on the other 26. It reached an AUC of 0.69, compared with 0.64 (battery only) and 0.55 (inspection type average), and the riskiest 20% of actions contained 19 of 49 real failures, about 1.9× better than random. For mission M015, starting at full battery cuts expected failures from about 1.8 to 1.0.
- Catching a failure early. Trend Watch flagged Heat Exchanger 02 when its sound level rose 58.5 → 65.6 → 81.9 dB, nearly 5 days before it actually failed.
- Findings an operator can act on:
- Below 30% battery, 51% of actions fail; above it, 13% do.
- Configuration V2 looked 14 points better than V1 (77.2% vs 91.1% success), but V2 never ran low on battery. At equal battery, the gap shrinks to 87.7% vs 91.1%, so most of the improvement is battery, not configuration.
- One location, the Pipe Gallery, caused 5 of 6 localization failures, all at 67–84% battery: a problem with the place, not the robot.
- Because SPOT completed 7 of 10 inspections on mission M015, people only needed to visit 4 locations, and SPOTCheck tells them which hazards and protective equipment to plan for.
- Real, tested, deployed software. A live app on Vercel and Render backed by Neon, with 89 backend tests and 76 frontend tests, and every change reviewed through a pull request before it reached main.
What we learned
- Power plant basics: how different plant types respond to weather, and why safety, documentation, and reliability matter so much in operations.
- How SPOT works: missions, waypoints, localization, and why a status label can hide real problems.
- Full-stack development: building a Python backend and a TypeScript/React frontend that work together, including APIs, testing, and deployment.
- UI design: showing complex data in plain language for people who aren't data experts, and keeping pages simple as features grew.
- Teamwork: dividing work into clear issues, reviewing each other's pull requests, and staying productive under hackathon time pressure.
What's next for SPOTCheck
- Efficiency and savings: combine the risk forecast with smarter route ordering to make routes shorter and safer, and estimate the time and cost savings.
- More languages and accessibility: Spanish and other languages in the UI, plus larger text, high-contrast mode, and reduced motion.
- 3D modeling: an interactive 3D view of multi-floor plants alongside the 2D map.
- Live data: connecting to a live SPOT and Orbit feed instead of recorded replays, and tuning thresholds with real plant data.
Built With
- fastapi
- gemini
- neon
- next.js
- postgresql
- python
- react
- recharts
- render
- tailwindcss
- typescript
- vercel


Log in or sign up for Devpost to join the conversation.