-
-
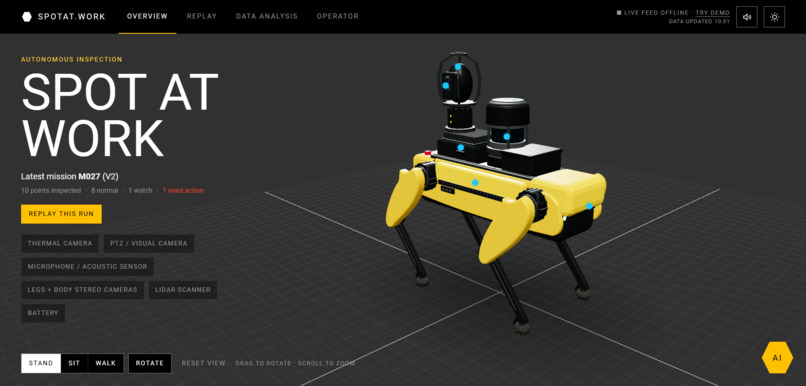
Main Page
-
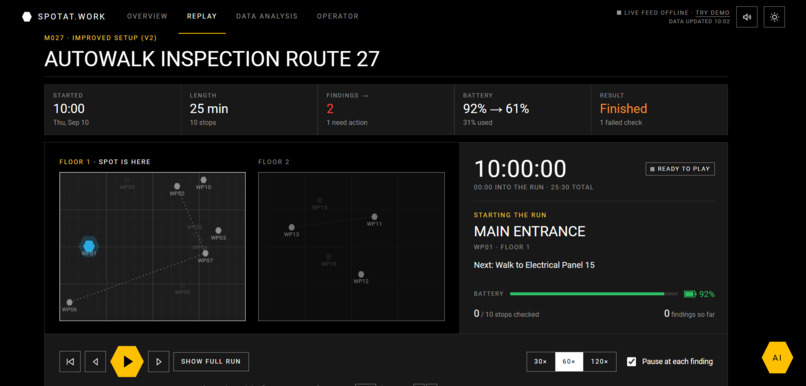
Replay Section
-
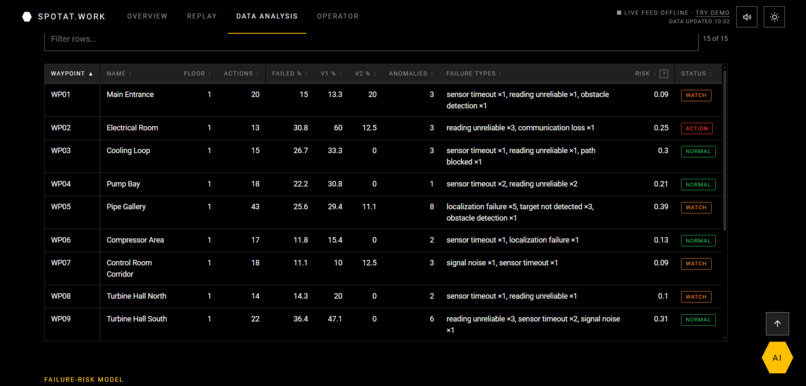
Data Analysis
Inspiration
Spot can collect valuable inspection data, but operators still need to understand what happened, where it happened, and what to do next.
NextEra’s SPOT Operational Intelligence Challenge inspired us to build spotat.work: a dashboard that turns scattered mission logs, sensor readings, and anomalies into clear findings, live alerts, and actionable next steps.
What it does
spotat.work helps operators monitor inspections, investigate findings, and track performance over time.
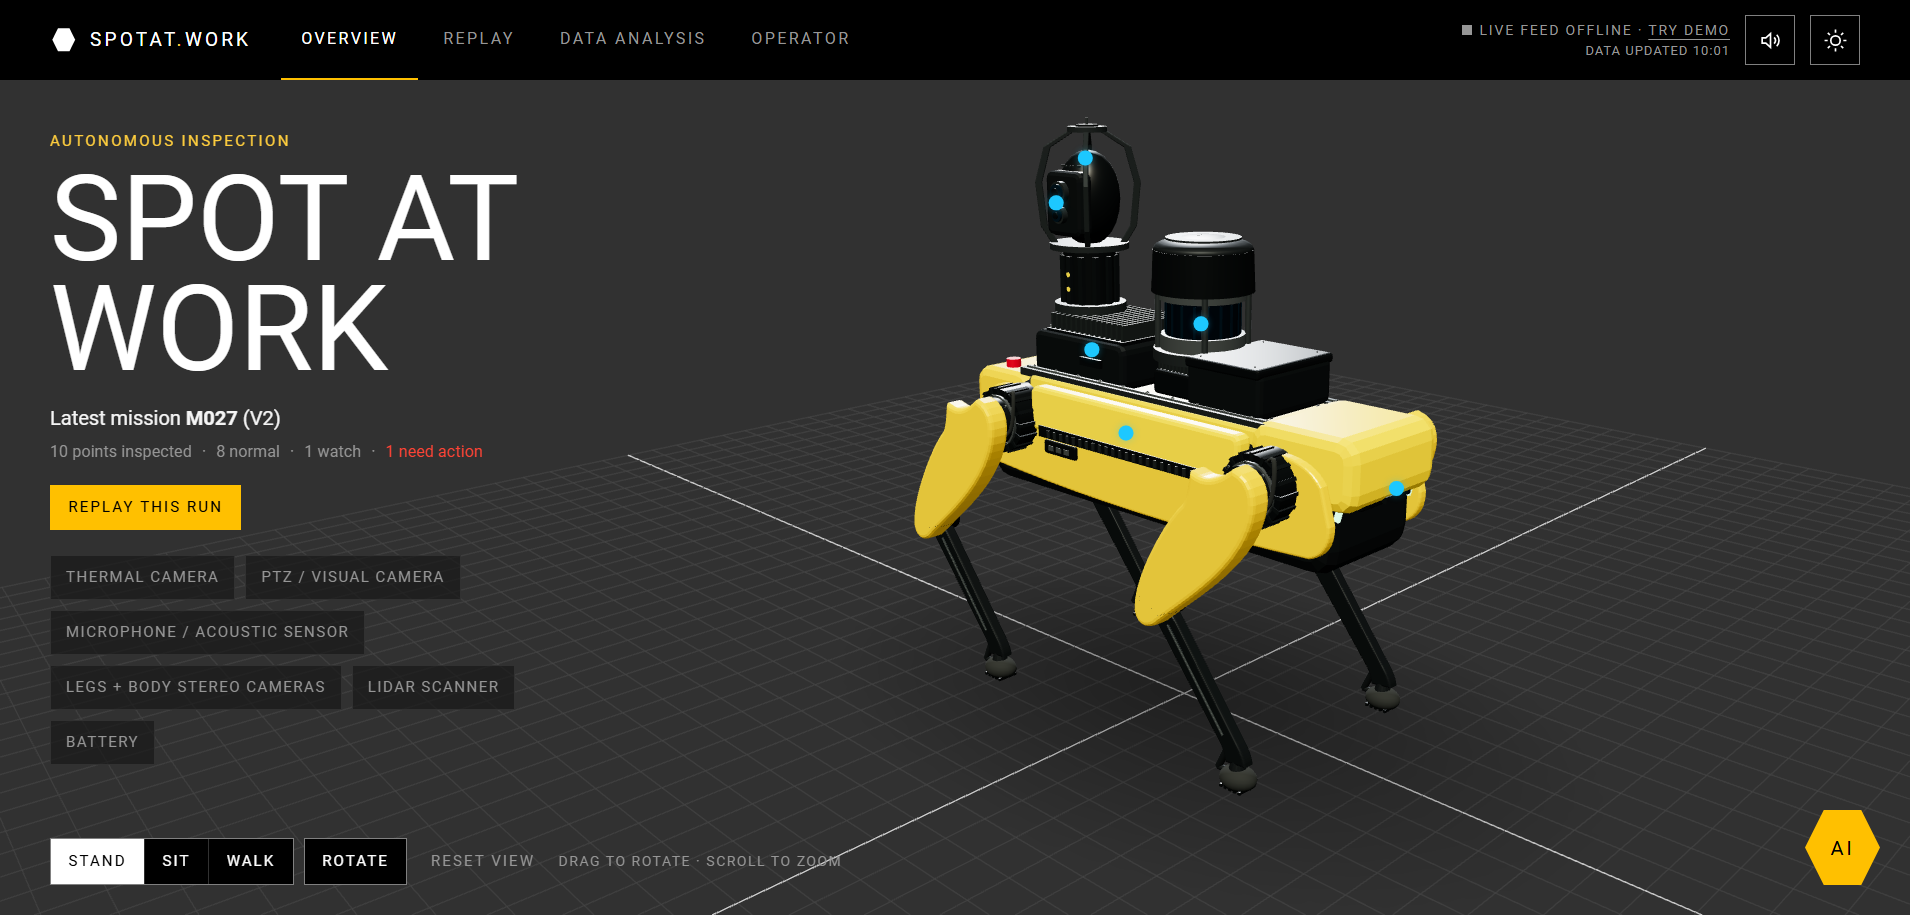
- Interactive 3D Spot: Click robot components to explore their associated inspection data in plain language. A two-floor map shows waypoint statuses and where findings occurred.
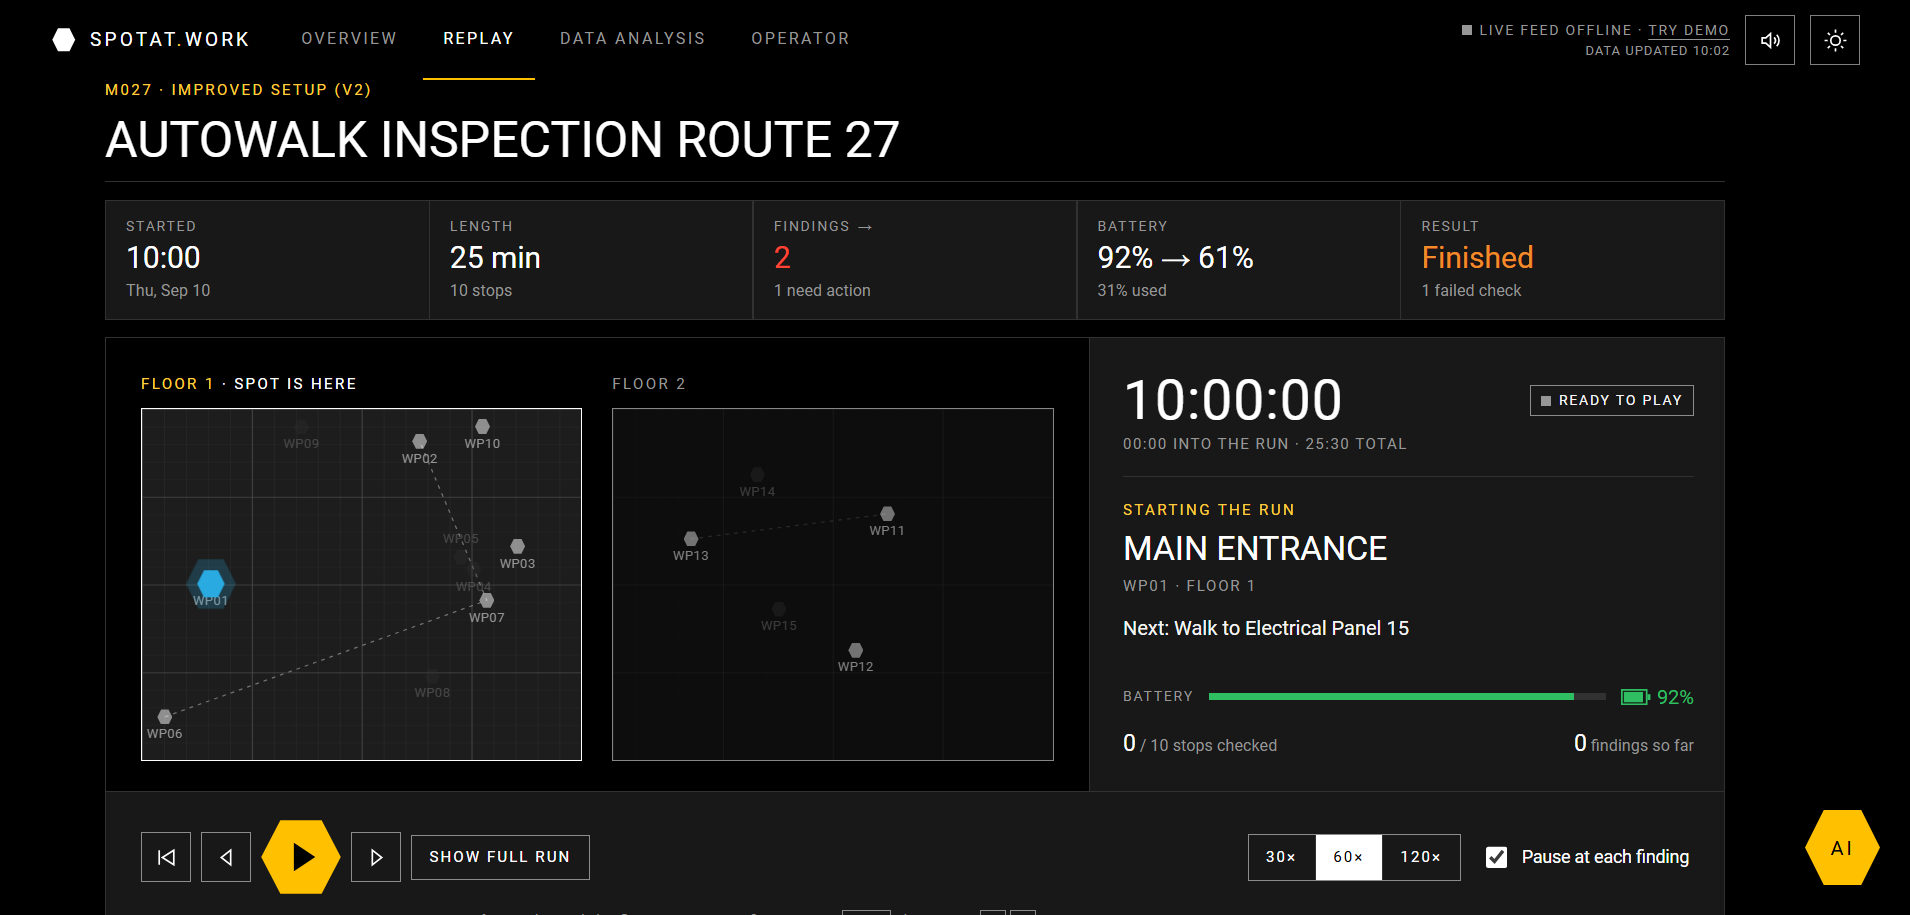
- Mission replay: Replay missions at accelerated speeds, with findings pinned to their timestamps and linked to explanations, recommended actions, and reference images.
- Live missions and alarms: Stream synthetic mission events to connected dashboards. Serious findings prompt an operator decision: escalate the issue or dismiss it with a required explanation. Visitors can also try a private browser demo.
- Failure-risk prediction: Estimate whether an action will fail before it runs, using battery level, action type, location, environment, and configuration.
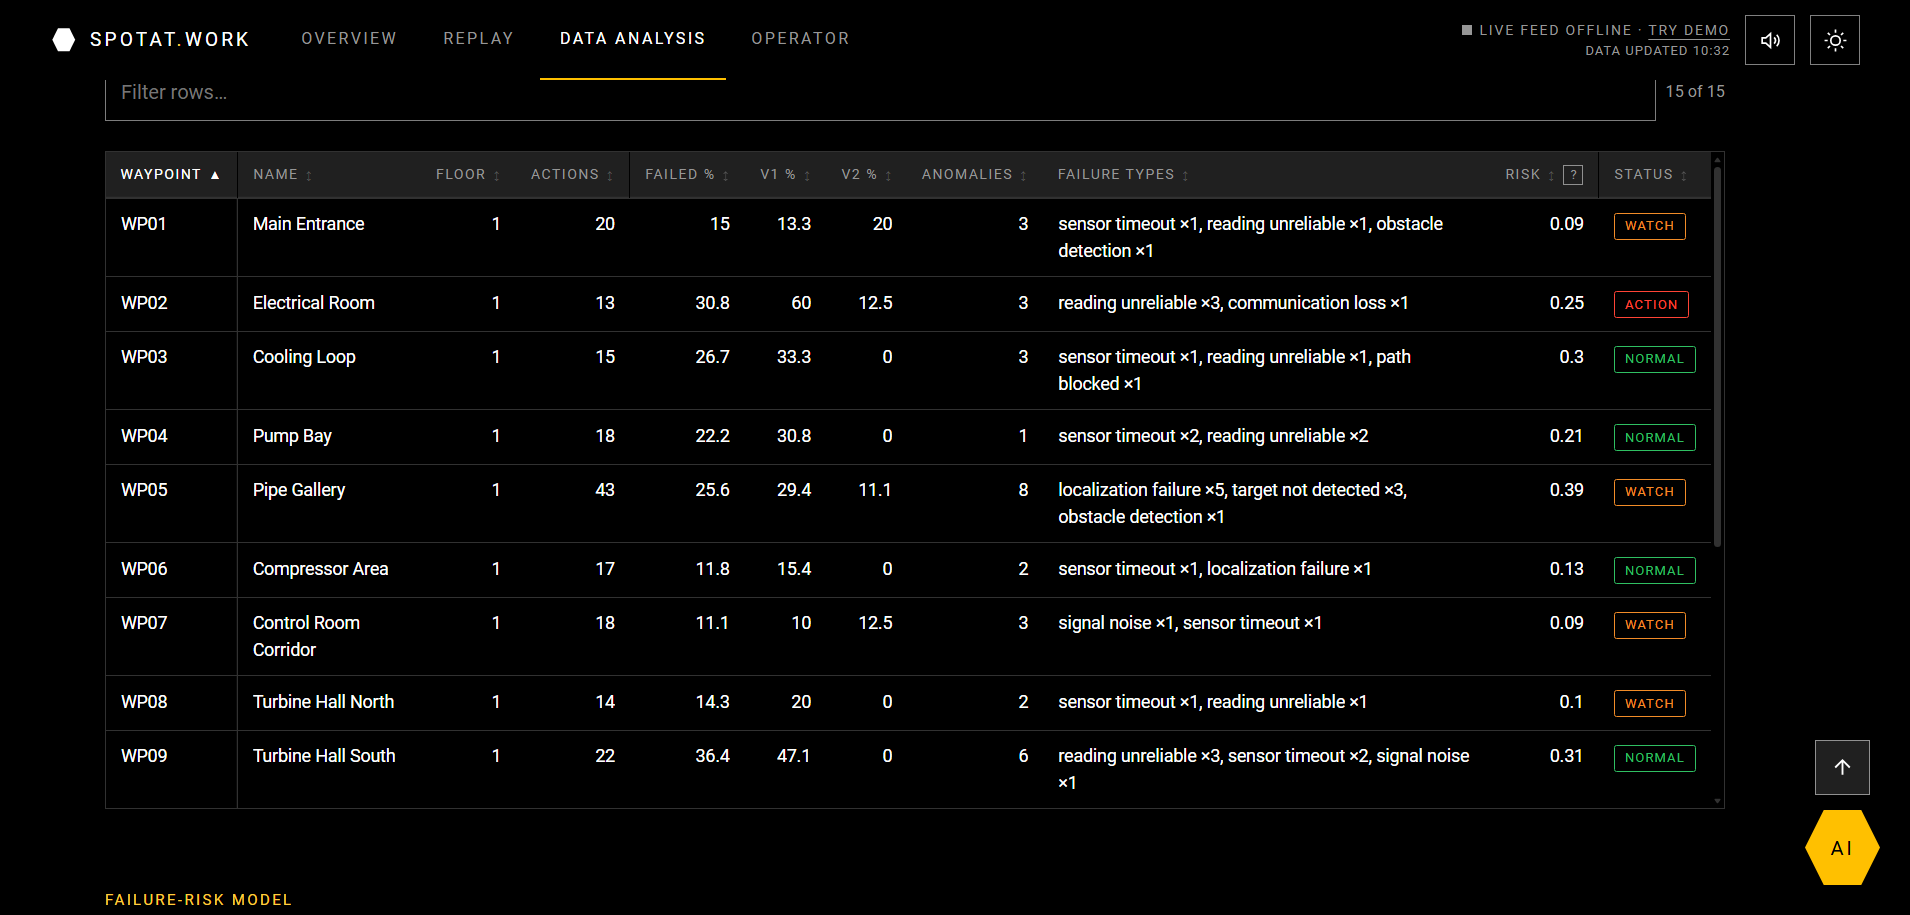
Data analysis: Compare configurations, investigate waypoint failures, explore filterable tables, inspect model metrics, and export PDF reports.
AI assistant: Ask questions such as “Why does WP05 fail?” and receive answers grounded in retrieved project data, with source references and context from the selected robot part or waypoint.
Operator Console: Track issues from acknowledgment through resolution, record decisions in an audit trail, and compare saved performance snapshots.
How we built it
We quickly prototyped the dashboard layout and navigation in Figma, then built the frontend with React and Vite. We used Three.js to display an existing online Spot model, add camera and lidar details based on reference photos, and make the robot interactive.
Our Python/FastAPI backend joins missions, actions, readings, anomalies, locations, and assets into a common inspection record, with a severity classification, explanation, and next step.
A dependency-free Java 17 ingestion service validates mission bundles before writing them. Server-Sent Events stream updates to dashboards, while webhooks connect incoming findings to alarms, issues, and KPI snapshots. The data layer supports Databricks Delta tables with a local CSV fallback.
We built a scikit-learn failure-risk model using mission-based training, test, and live splits. Four live-demo missions remain unseen during training. The model and dataset are published on Hugging Face.
The assistant retrieves relevant project documents before calling our own trained AI Model, with instructions to answer from the evidence and cite sources. Caching, rate limits, and a spending cap manage public usage.
SQLite stores operator workflows, with triggers protecting audit events and saved snapshots from edits and deletions during normal application use. The frontend runs on Vercel, and the backend runs on Render.
Challenges we ran into
We wanted the interface to feel engaging while making urgent findings easy to understand. That required iteration on the 3D explorer, maps, severity indicators, and explanations.
Connecting related datasets was another challenge: a failed robot action and an abnormal equipment reading require different responses. Our inspection-record schema brings them together while preserving that distinction.
The small, imbalanced dataset also made prediction difficult. We used mission-based splits, grouped cross-validation, and a battery-rule baseline to evaluate the model honestly.
Accomplishments that we're proud of
- Turning inspection records into an interactive robot explorer, spatial map, and mission replay.
- Connecting streamed findings to operator decisions and recorded issue histories.
- Evaluating failure predictions on unseen missions and showing both successes and limitations.
- Building an assistant that retrieves evidence and cites its sources.
- Supporting quick shift decisions and deeper investigation through the same dashboard.
What we learned
Collecting data is only half the problem. Operators need context, evidence, and a clear next step.
We also learned that observed improvement does not automatically explain its cause. V2 performs better in the synthetic dataset, but battery levels and operating conditions differ too. Useful analysis helps users investigate those relationships.
Trust comes from making the reasoning visible—including model errors, source references, and operator decisions.
What's next for spotat.work
- Connect to Spot’s actual APIs and inspection outputs.
- Replace reference images with inspection-specific evidence.
- Improve streaming responsiveness.
- Add SSO, stronger access controls, and more durable storage.
- Evaluate predictions on larger, representative datasets.
- Test with operators to refine alert prioritization and shift handoffs.
All demonstrated data comes from NextEra’s synthetic challenge kit. The prototype and predictive model have not been validated on real facilities.
Built With
- anthropic
- caddy
- claude
- css
- databricks
- delta-lake
- docker
- fastapi
- figma
- github
- hugging-face
- java
- javascript
- jspdf
- pypdf
- python
- qwen
- react
- render
- scikit-learn
- server-sent-events
- sqlite
- three.js
- vercel
- vite


Log in or sign up for Devpost to join the conversation.