Inspiration
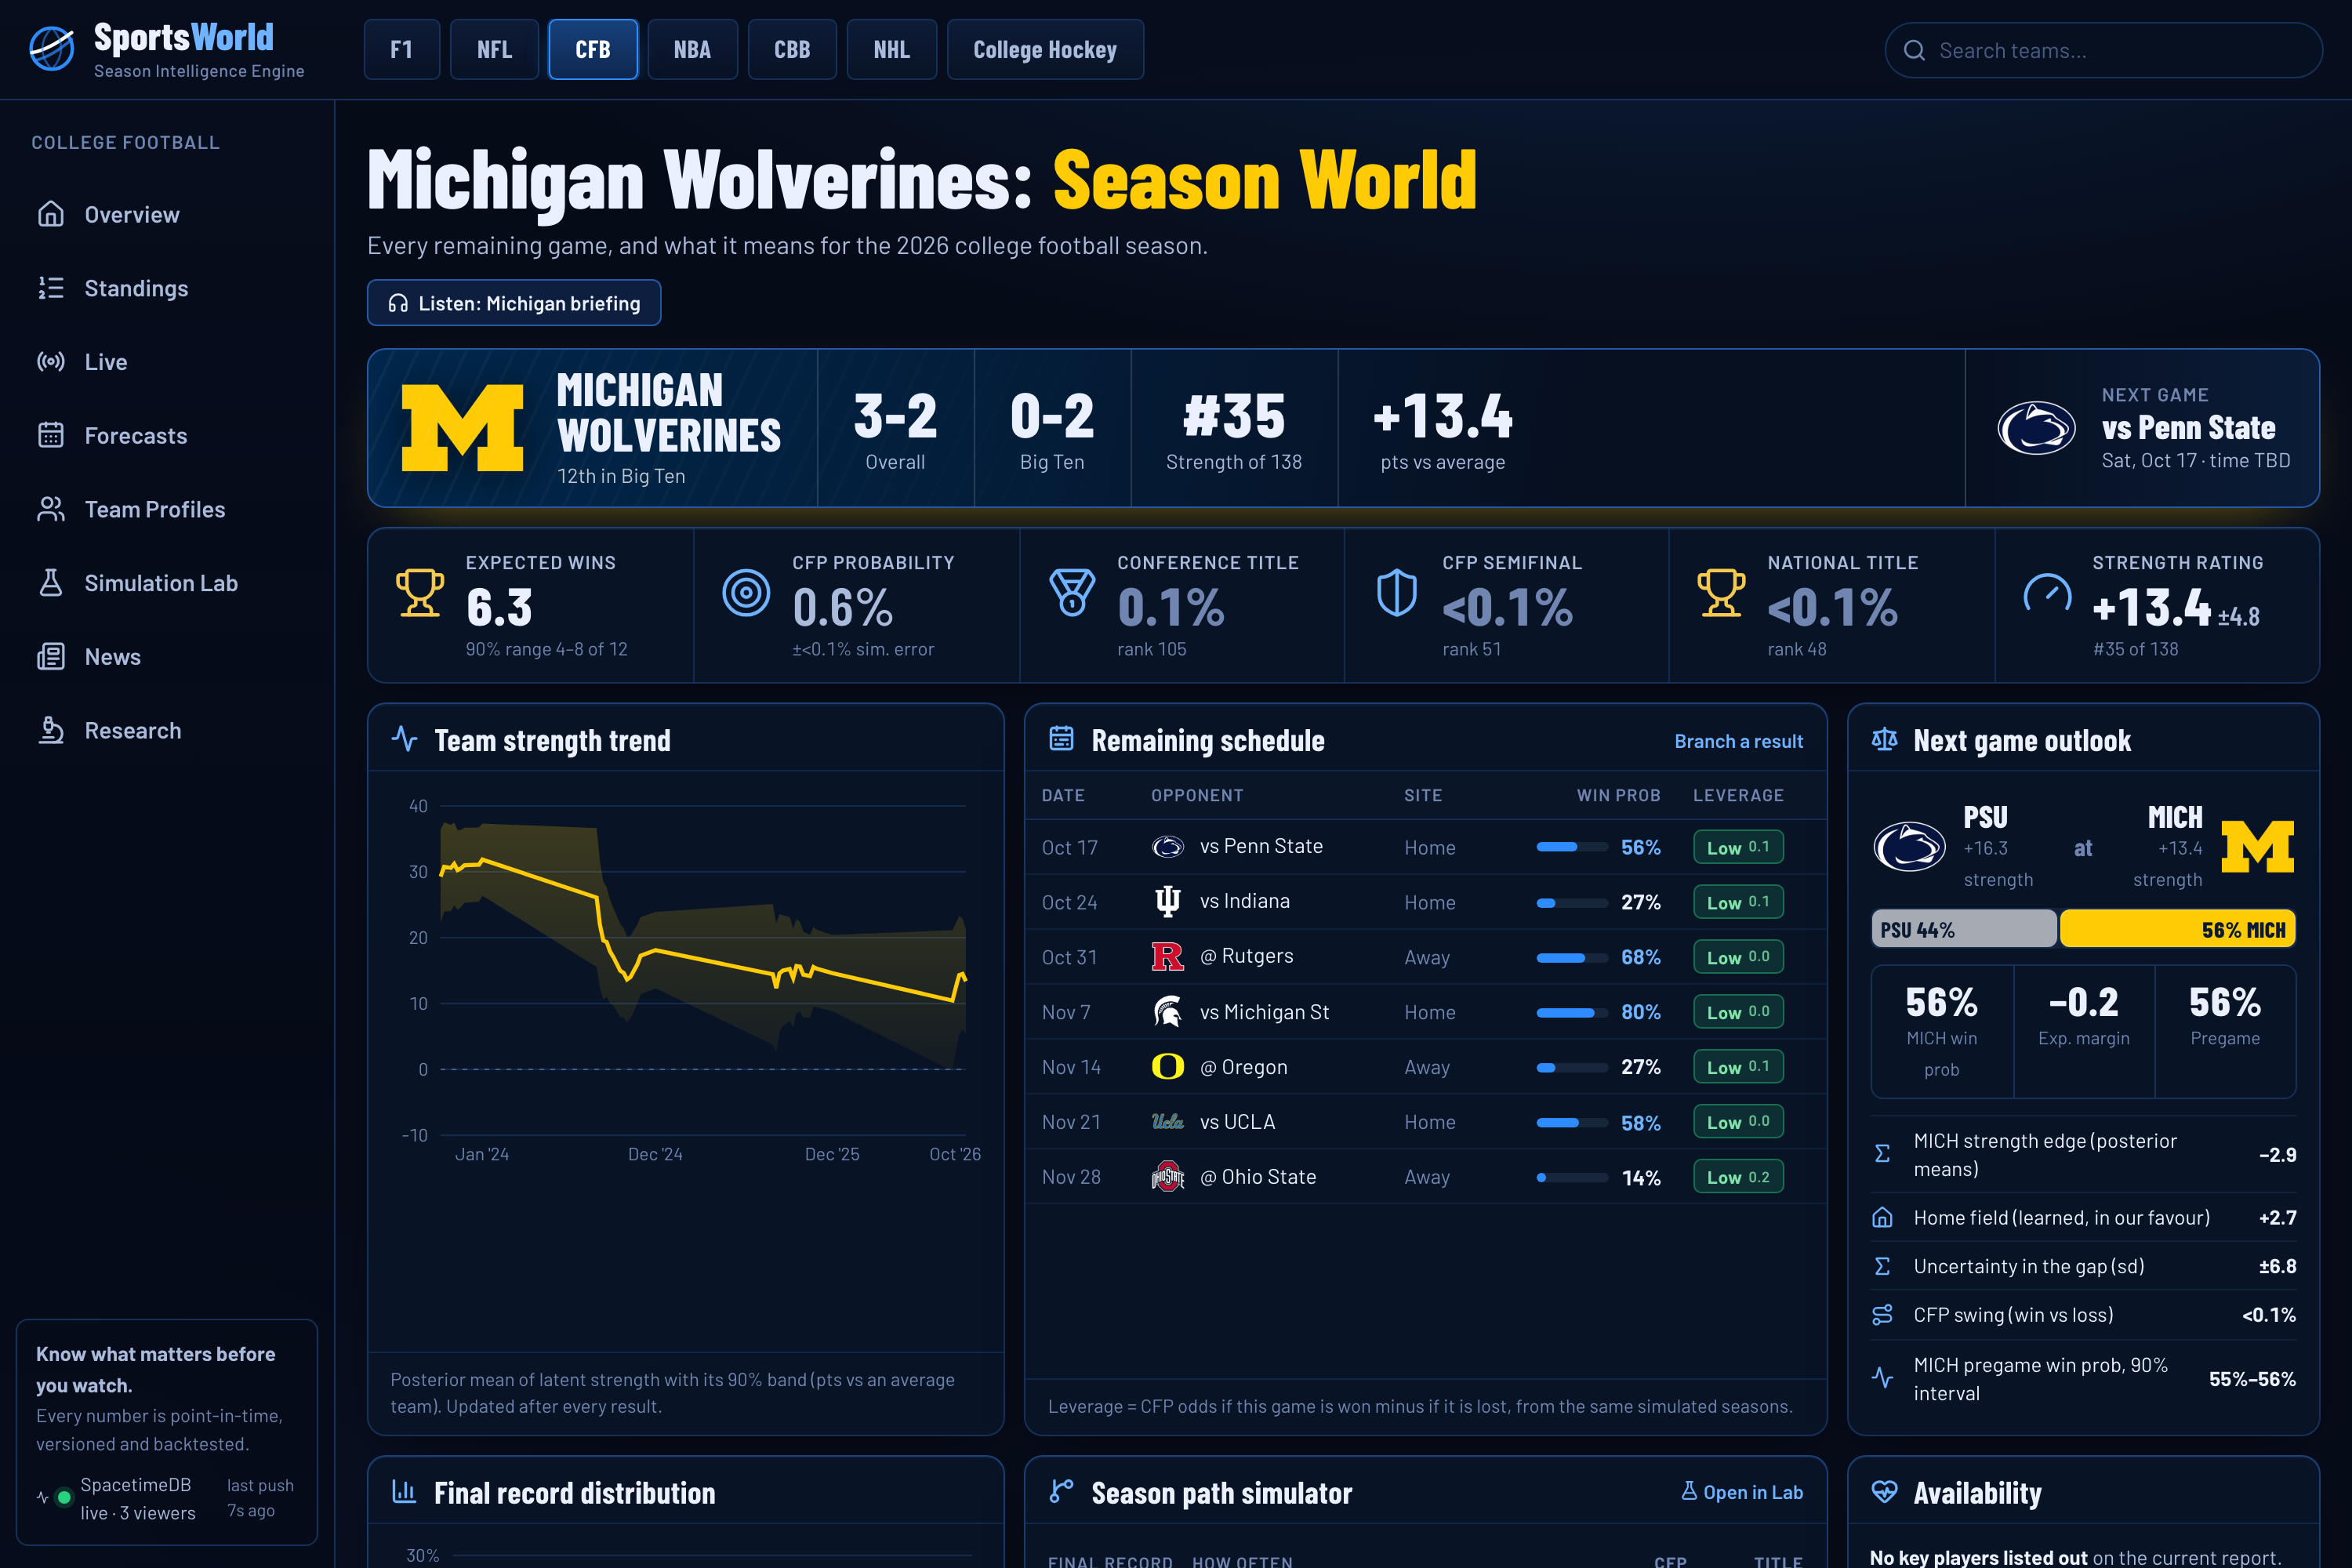
Every sports app tells you who will probably win tonight. None of them tells you what tonight means. If Michigan loses, how far do their playoff odds fall? Does a quarterback injury change who wins the AFC? Of fifty games on a Saturday, which three actually move the race?
Those are world-model questions, not single-game ones. A season is a correlated system: one latent strength per team drives every game it plays, every result feeds back into that strength, and the rules (tiebreaks, conference title games, a 12-team playoff, play-ins, FIA points) collapse thousands of games into a handful of outcomes people care about. We wanted to build that system properly (persistent, calibrated, auditable) and make it something you can watch move in real time.
Know what matters before you watch.
What it does
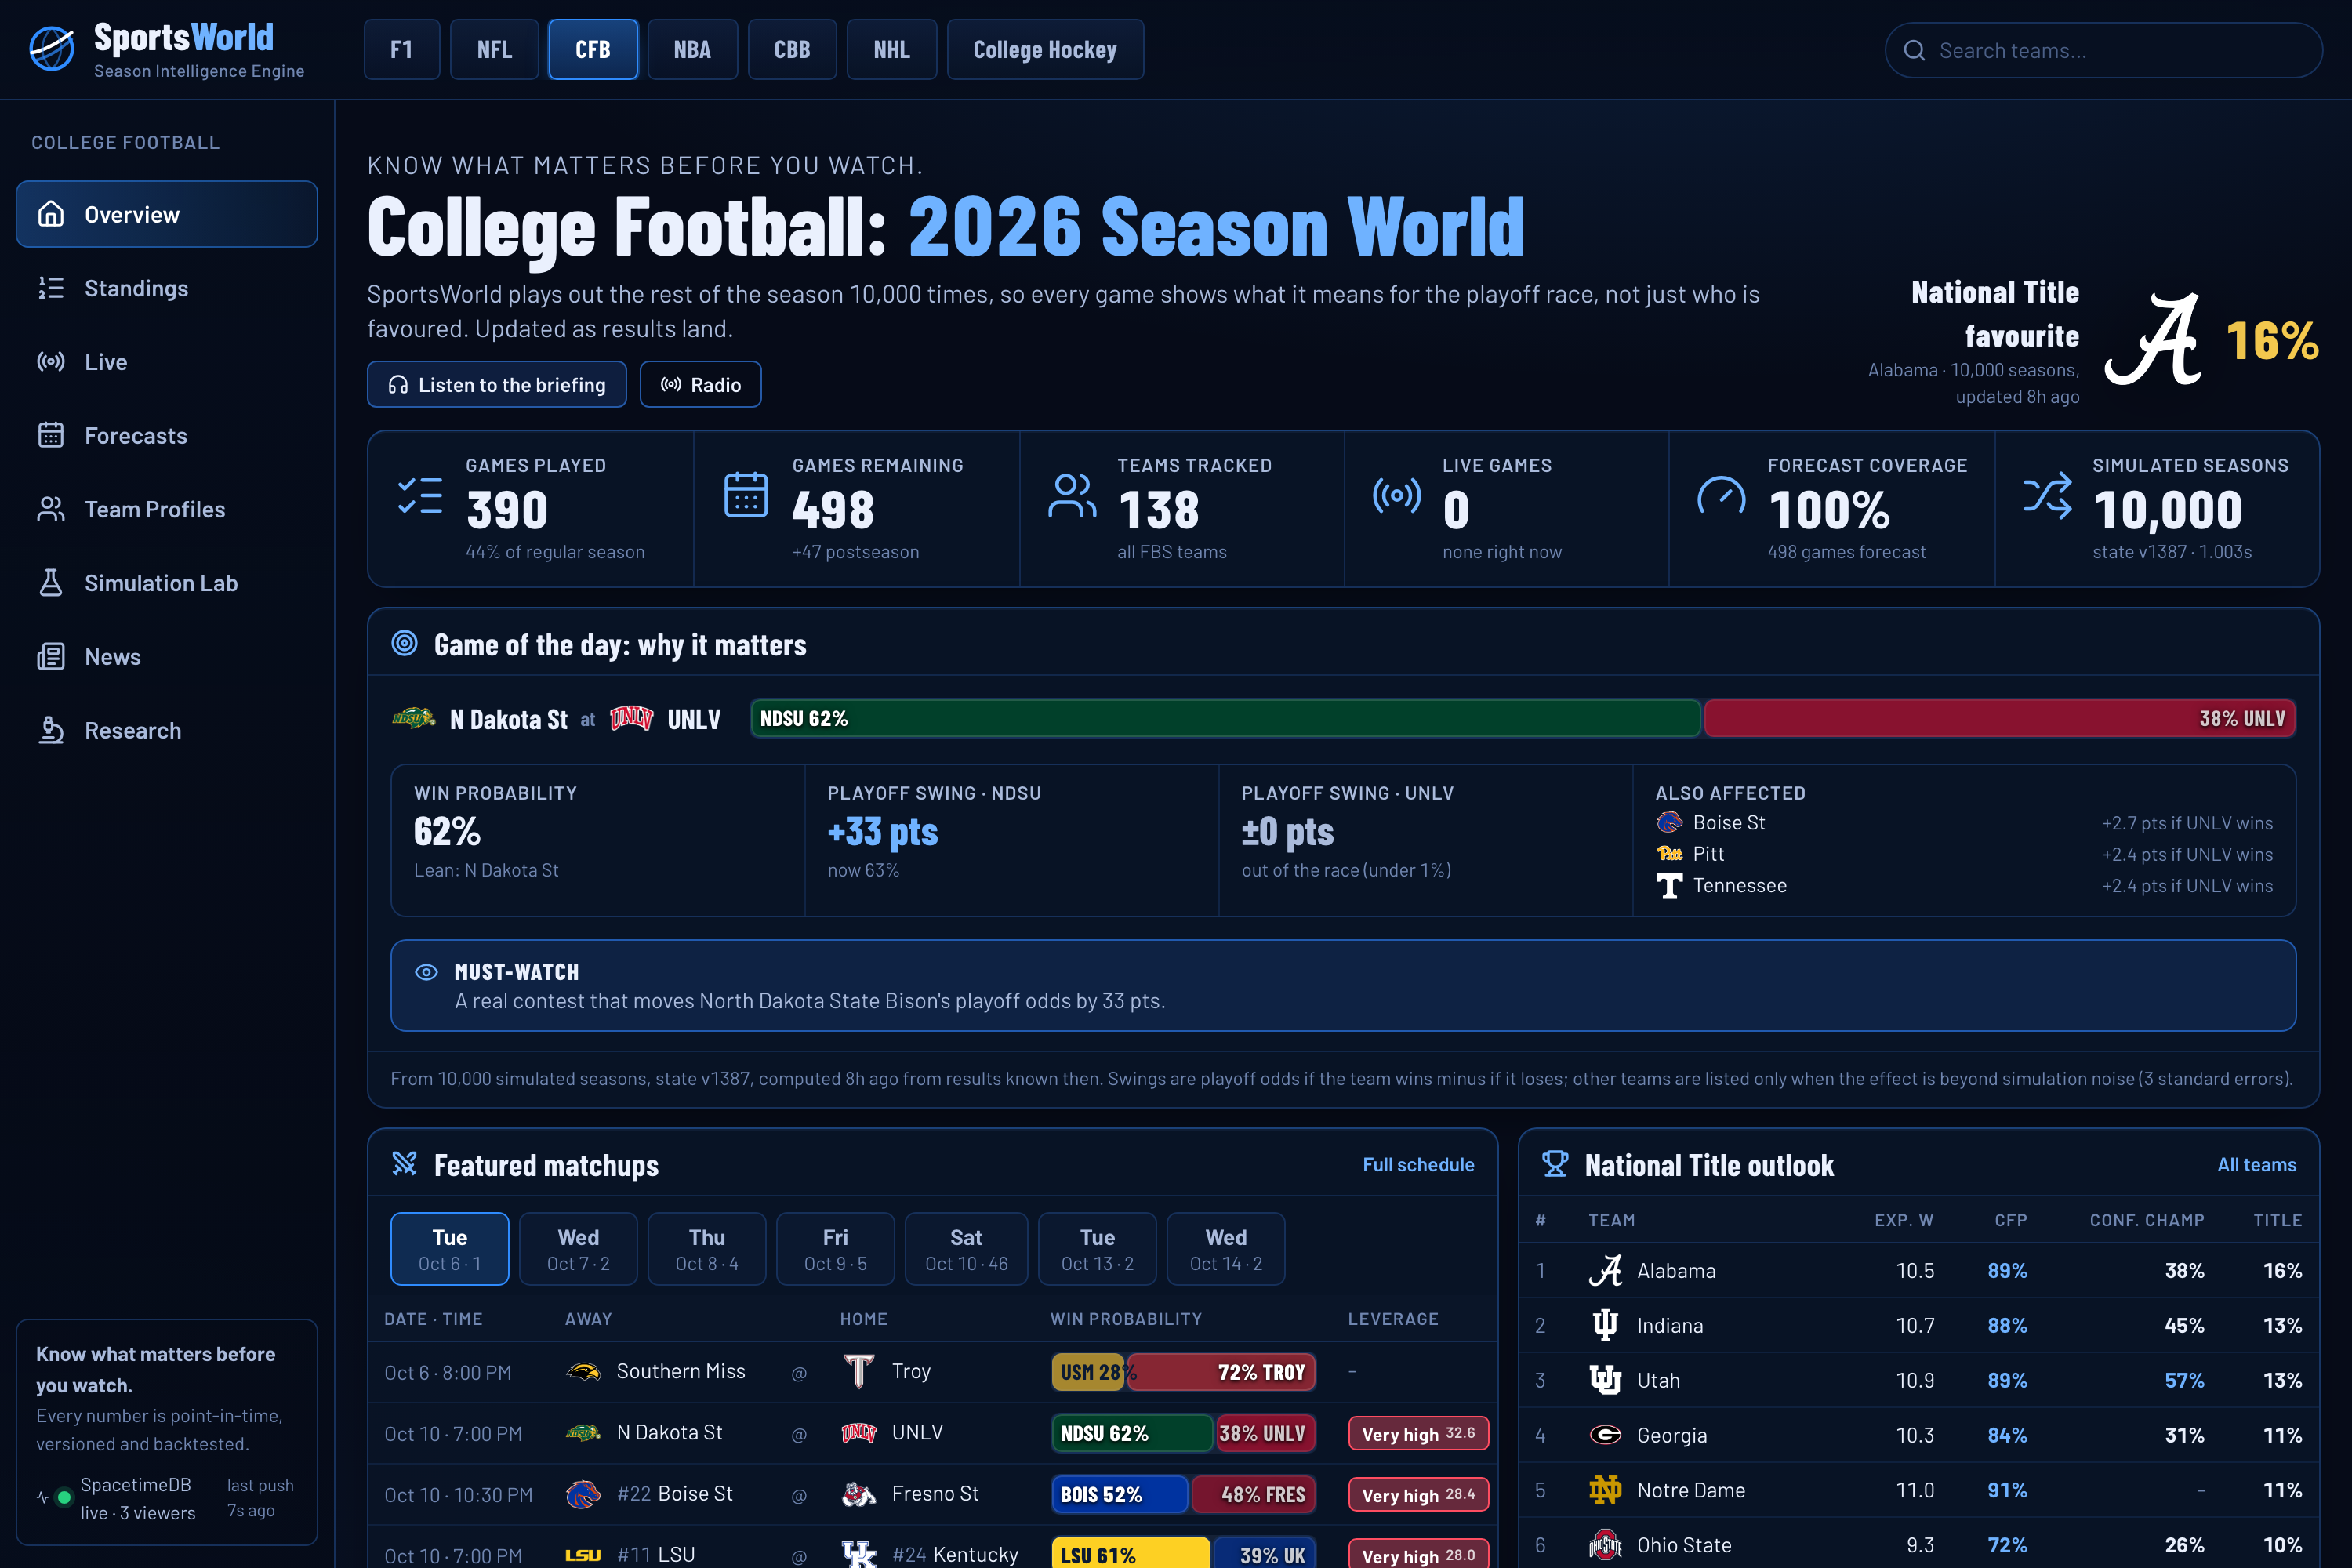
SportsWorld keeps one live, probabilistic belief about entire competitions (the NFL, college football, NBA, NHL, college basketball, college hockey and Formula 1) and updates it as evidence arrives.
- Every team, with uncertainty. Each team carries a latent strength $\theta \sim \mathcal{N}(\mu, \sigma^2)$, updated after every result. F1 tracks driver skill and car pace separately.
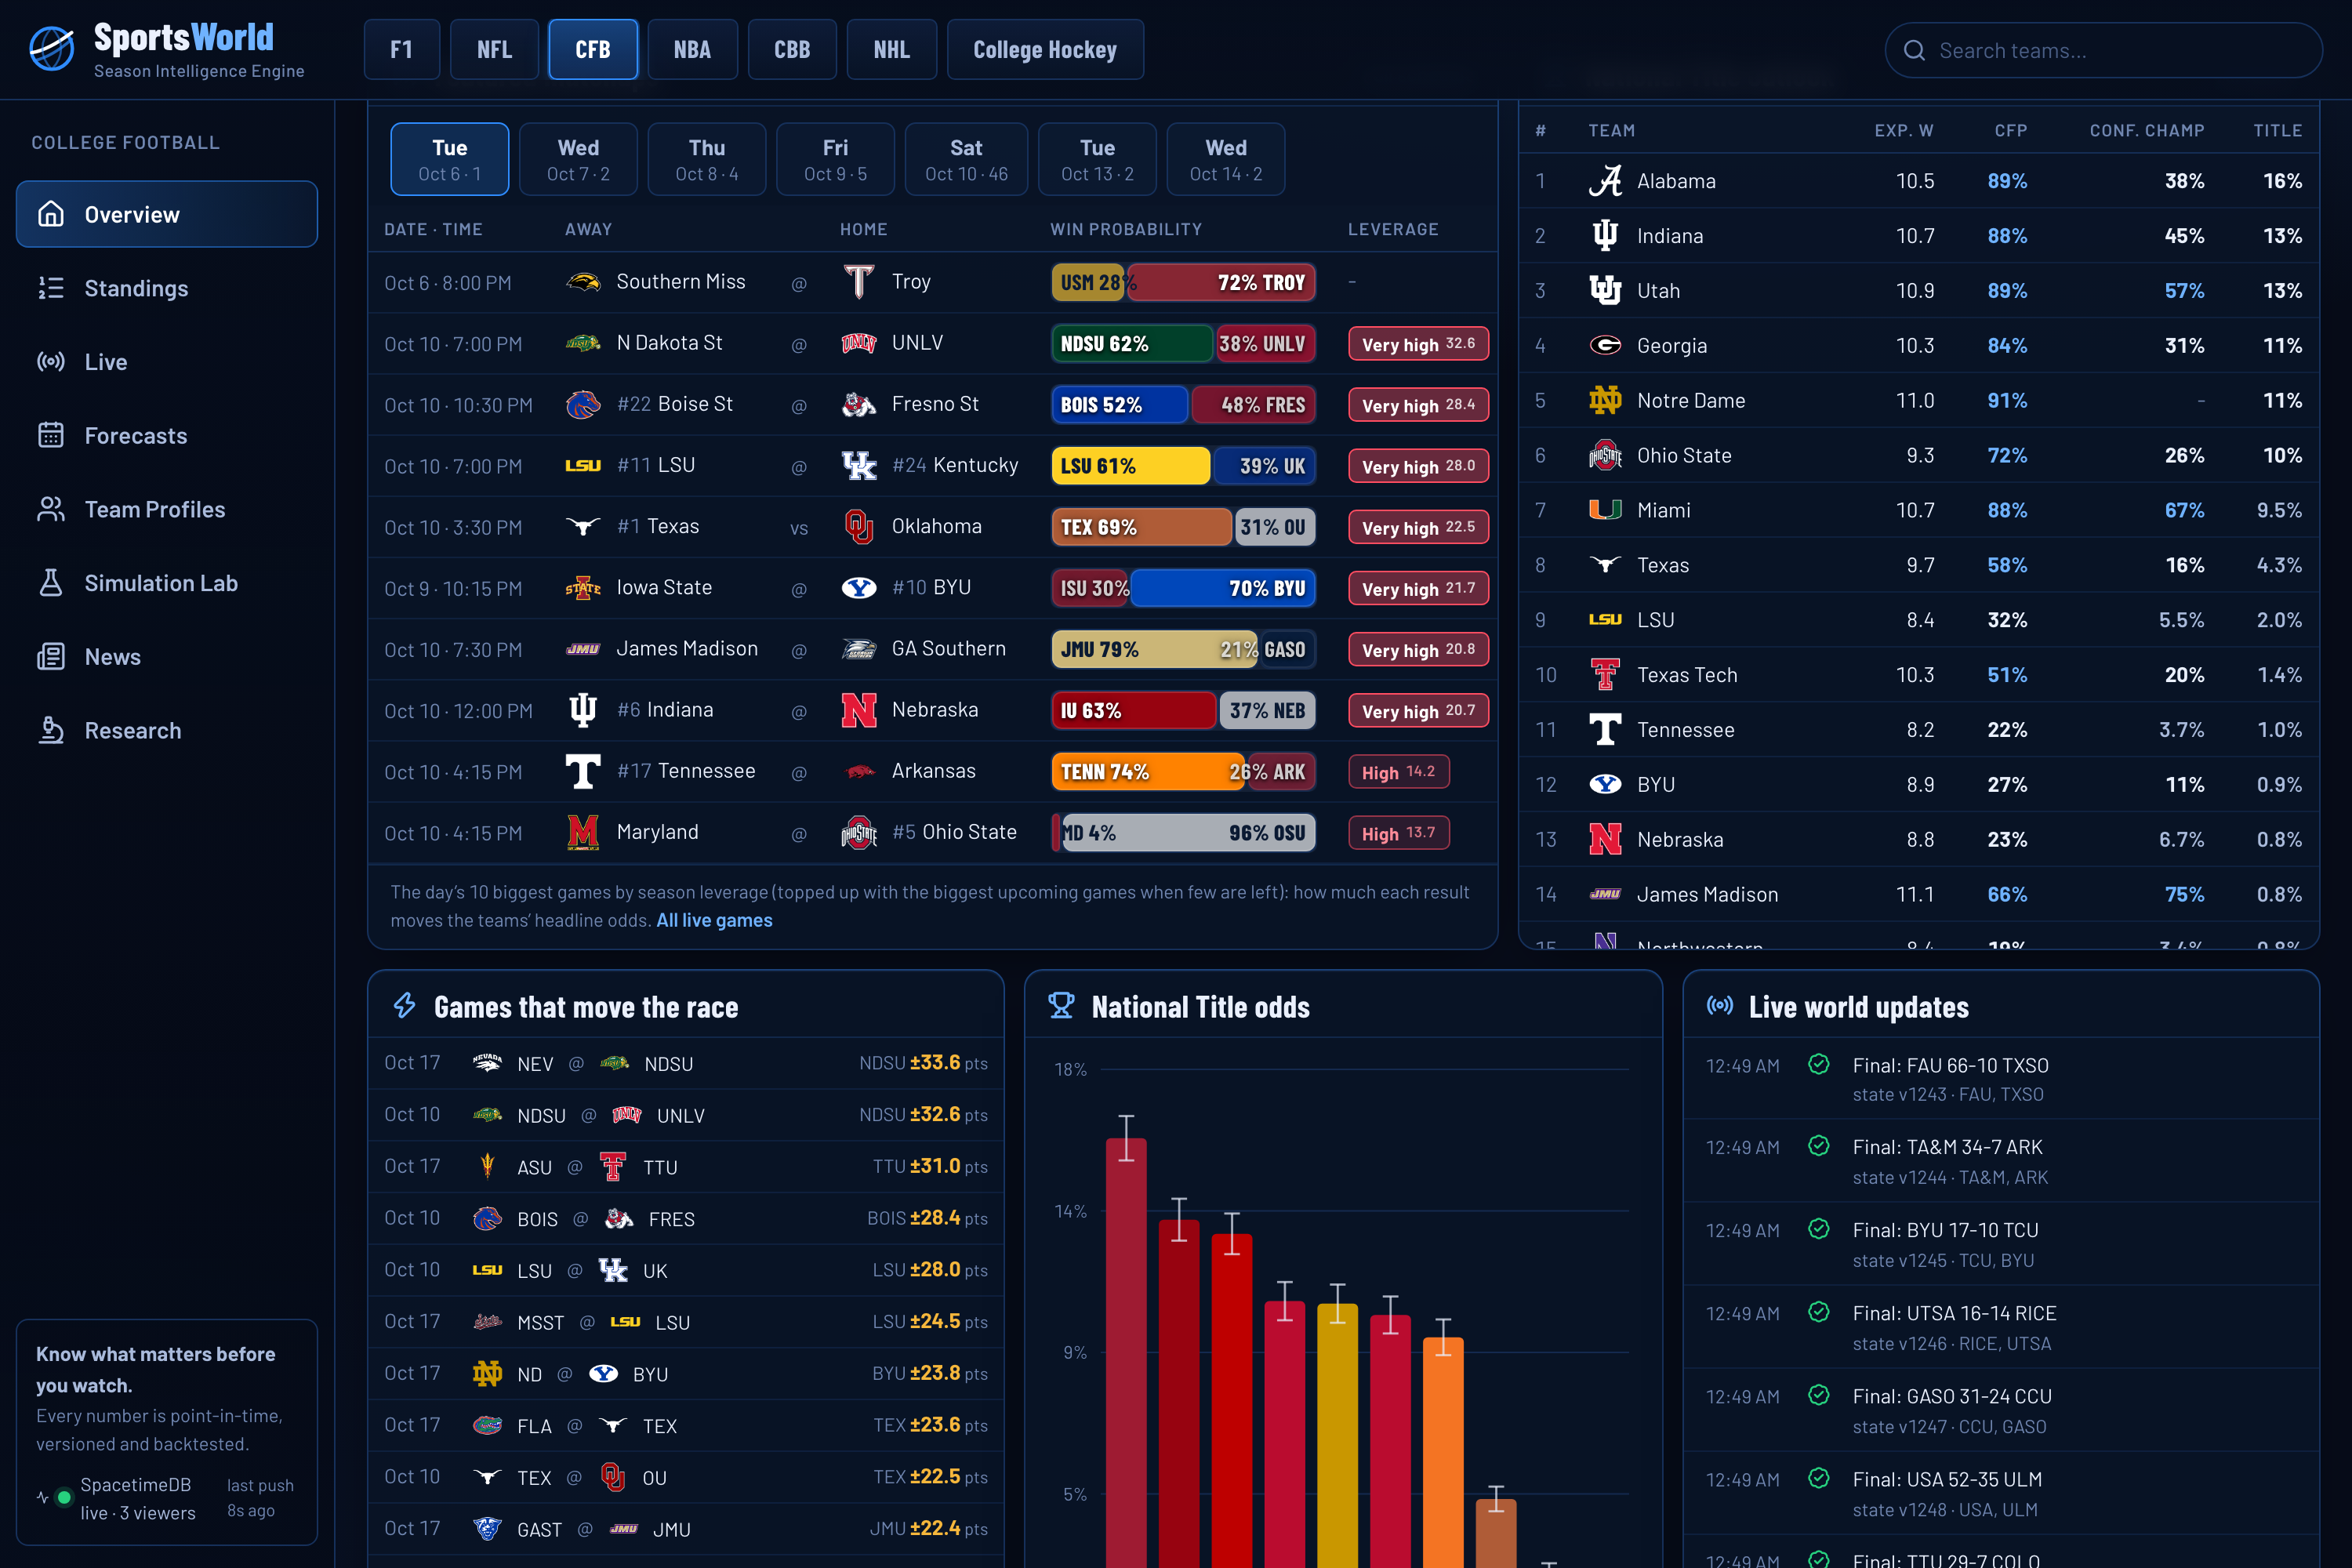
- Every game, forecast. A calibrated model scores every remaining game, before kickoff and live.
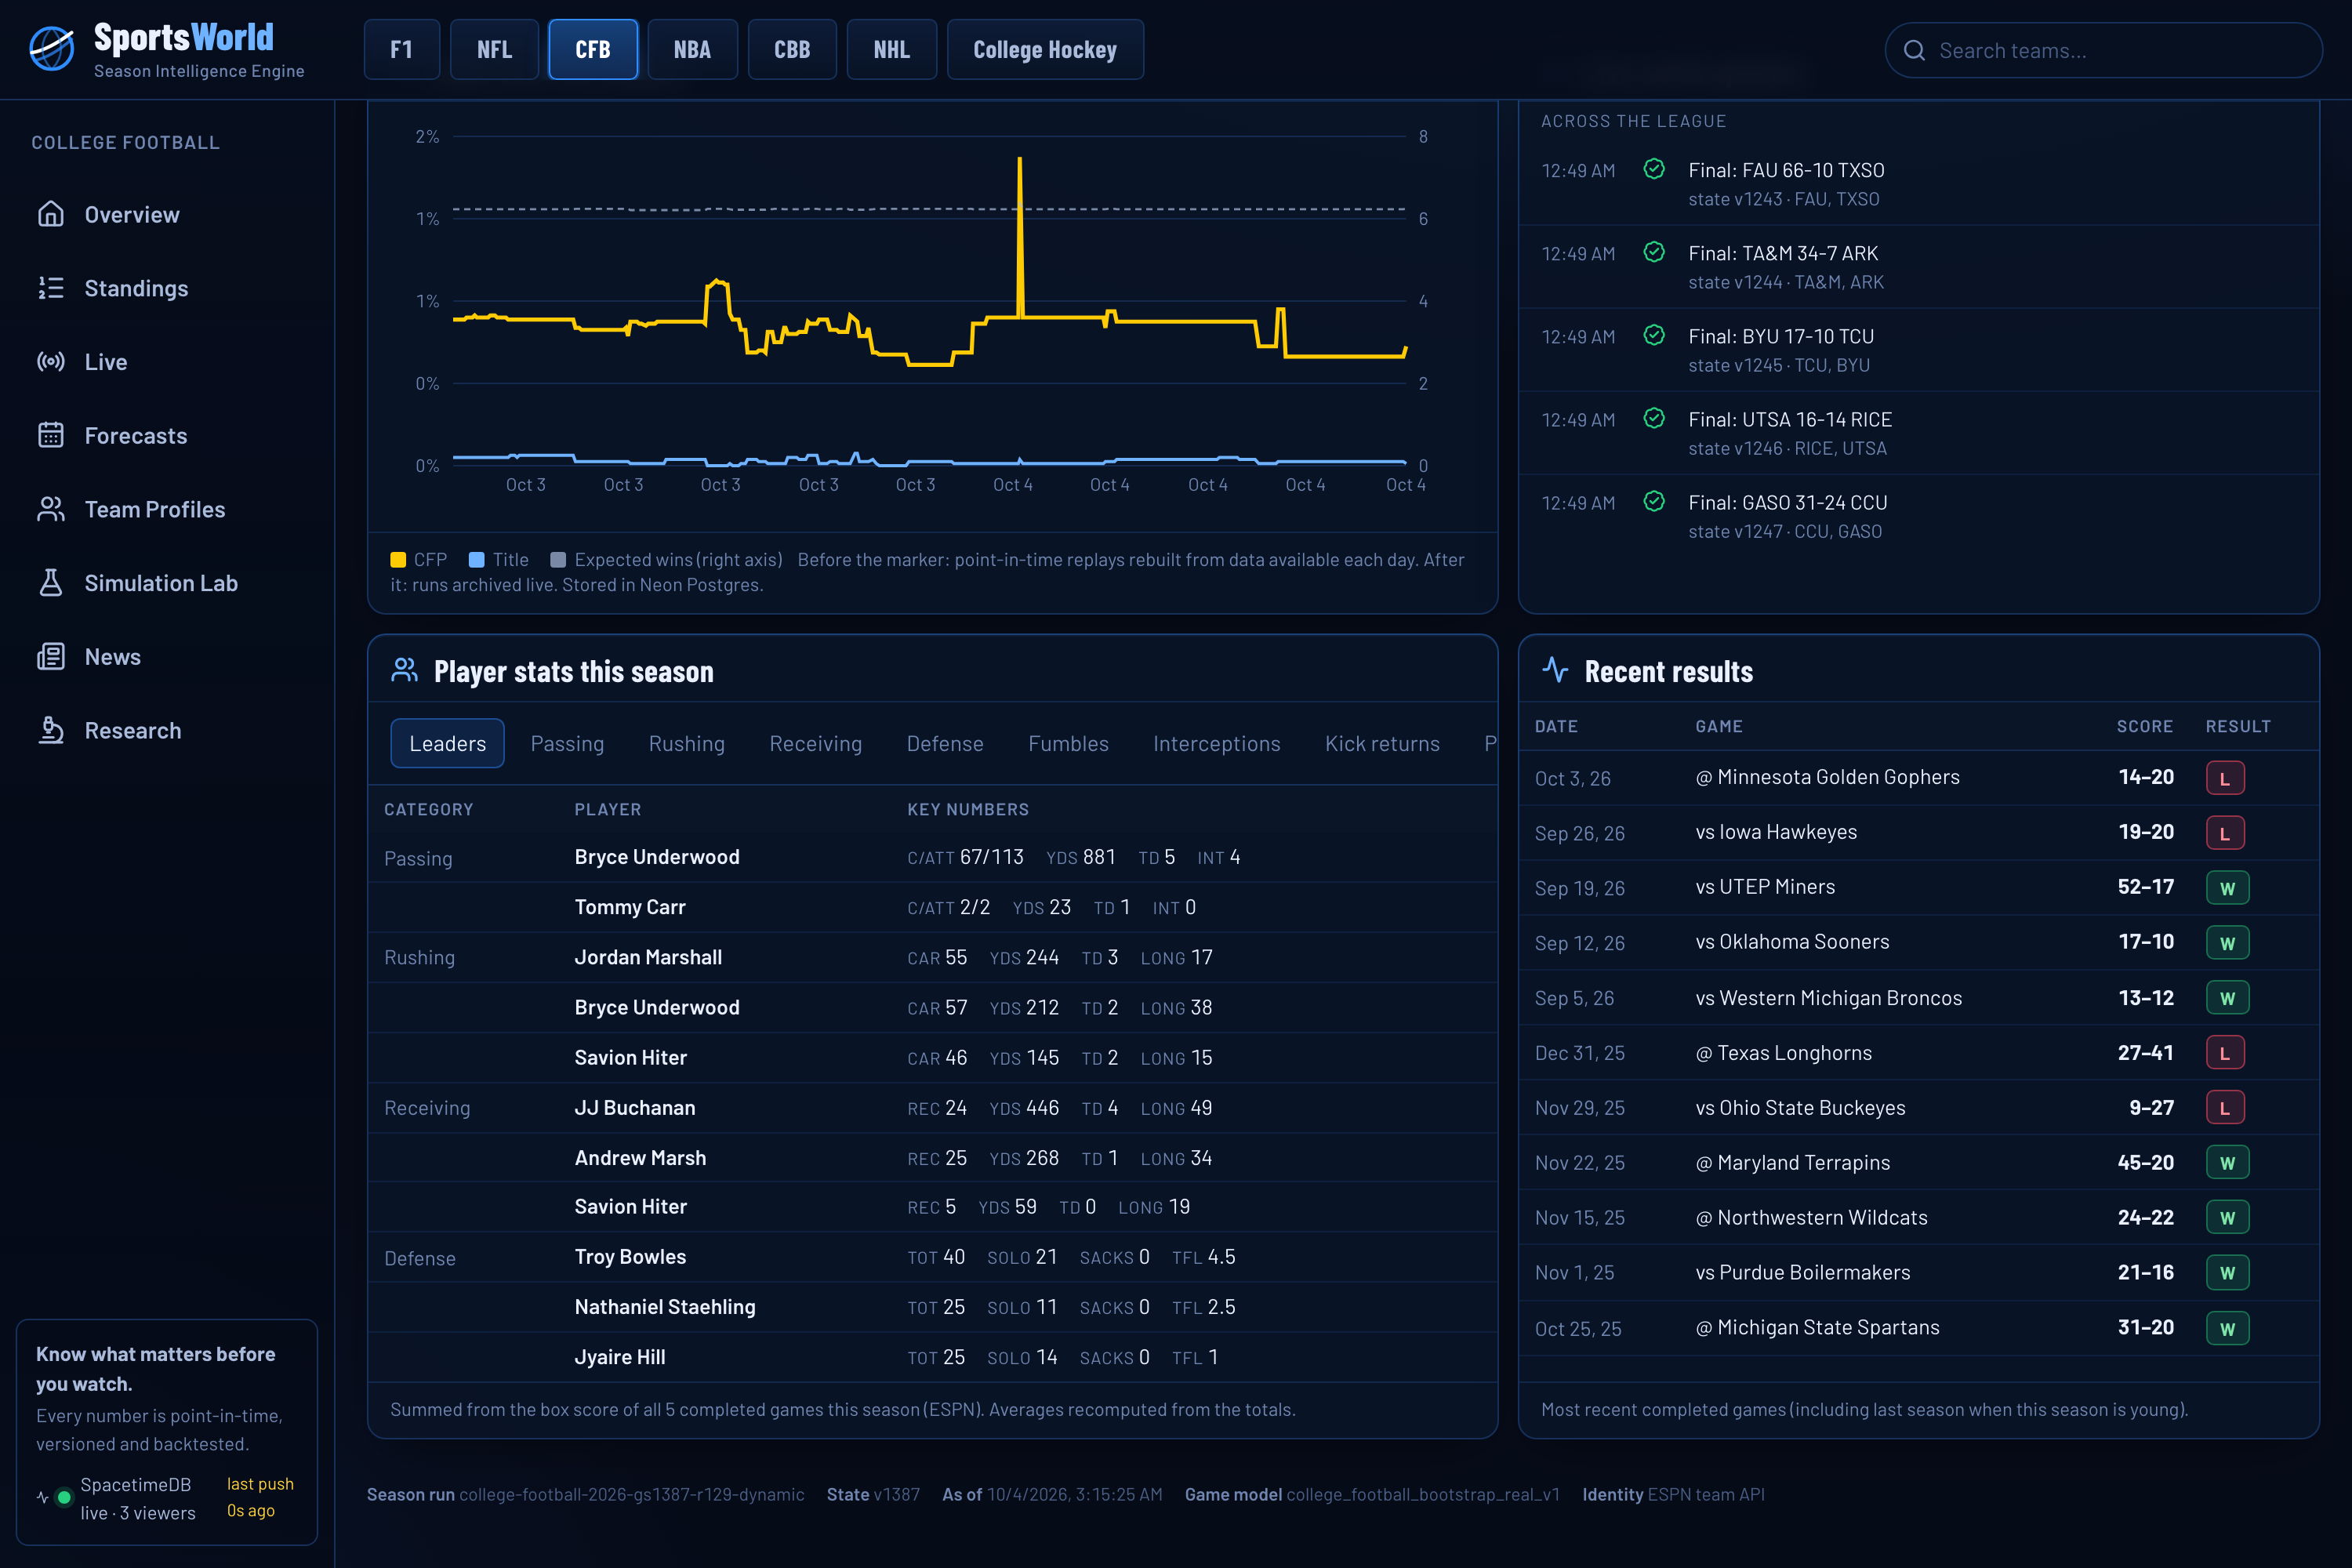
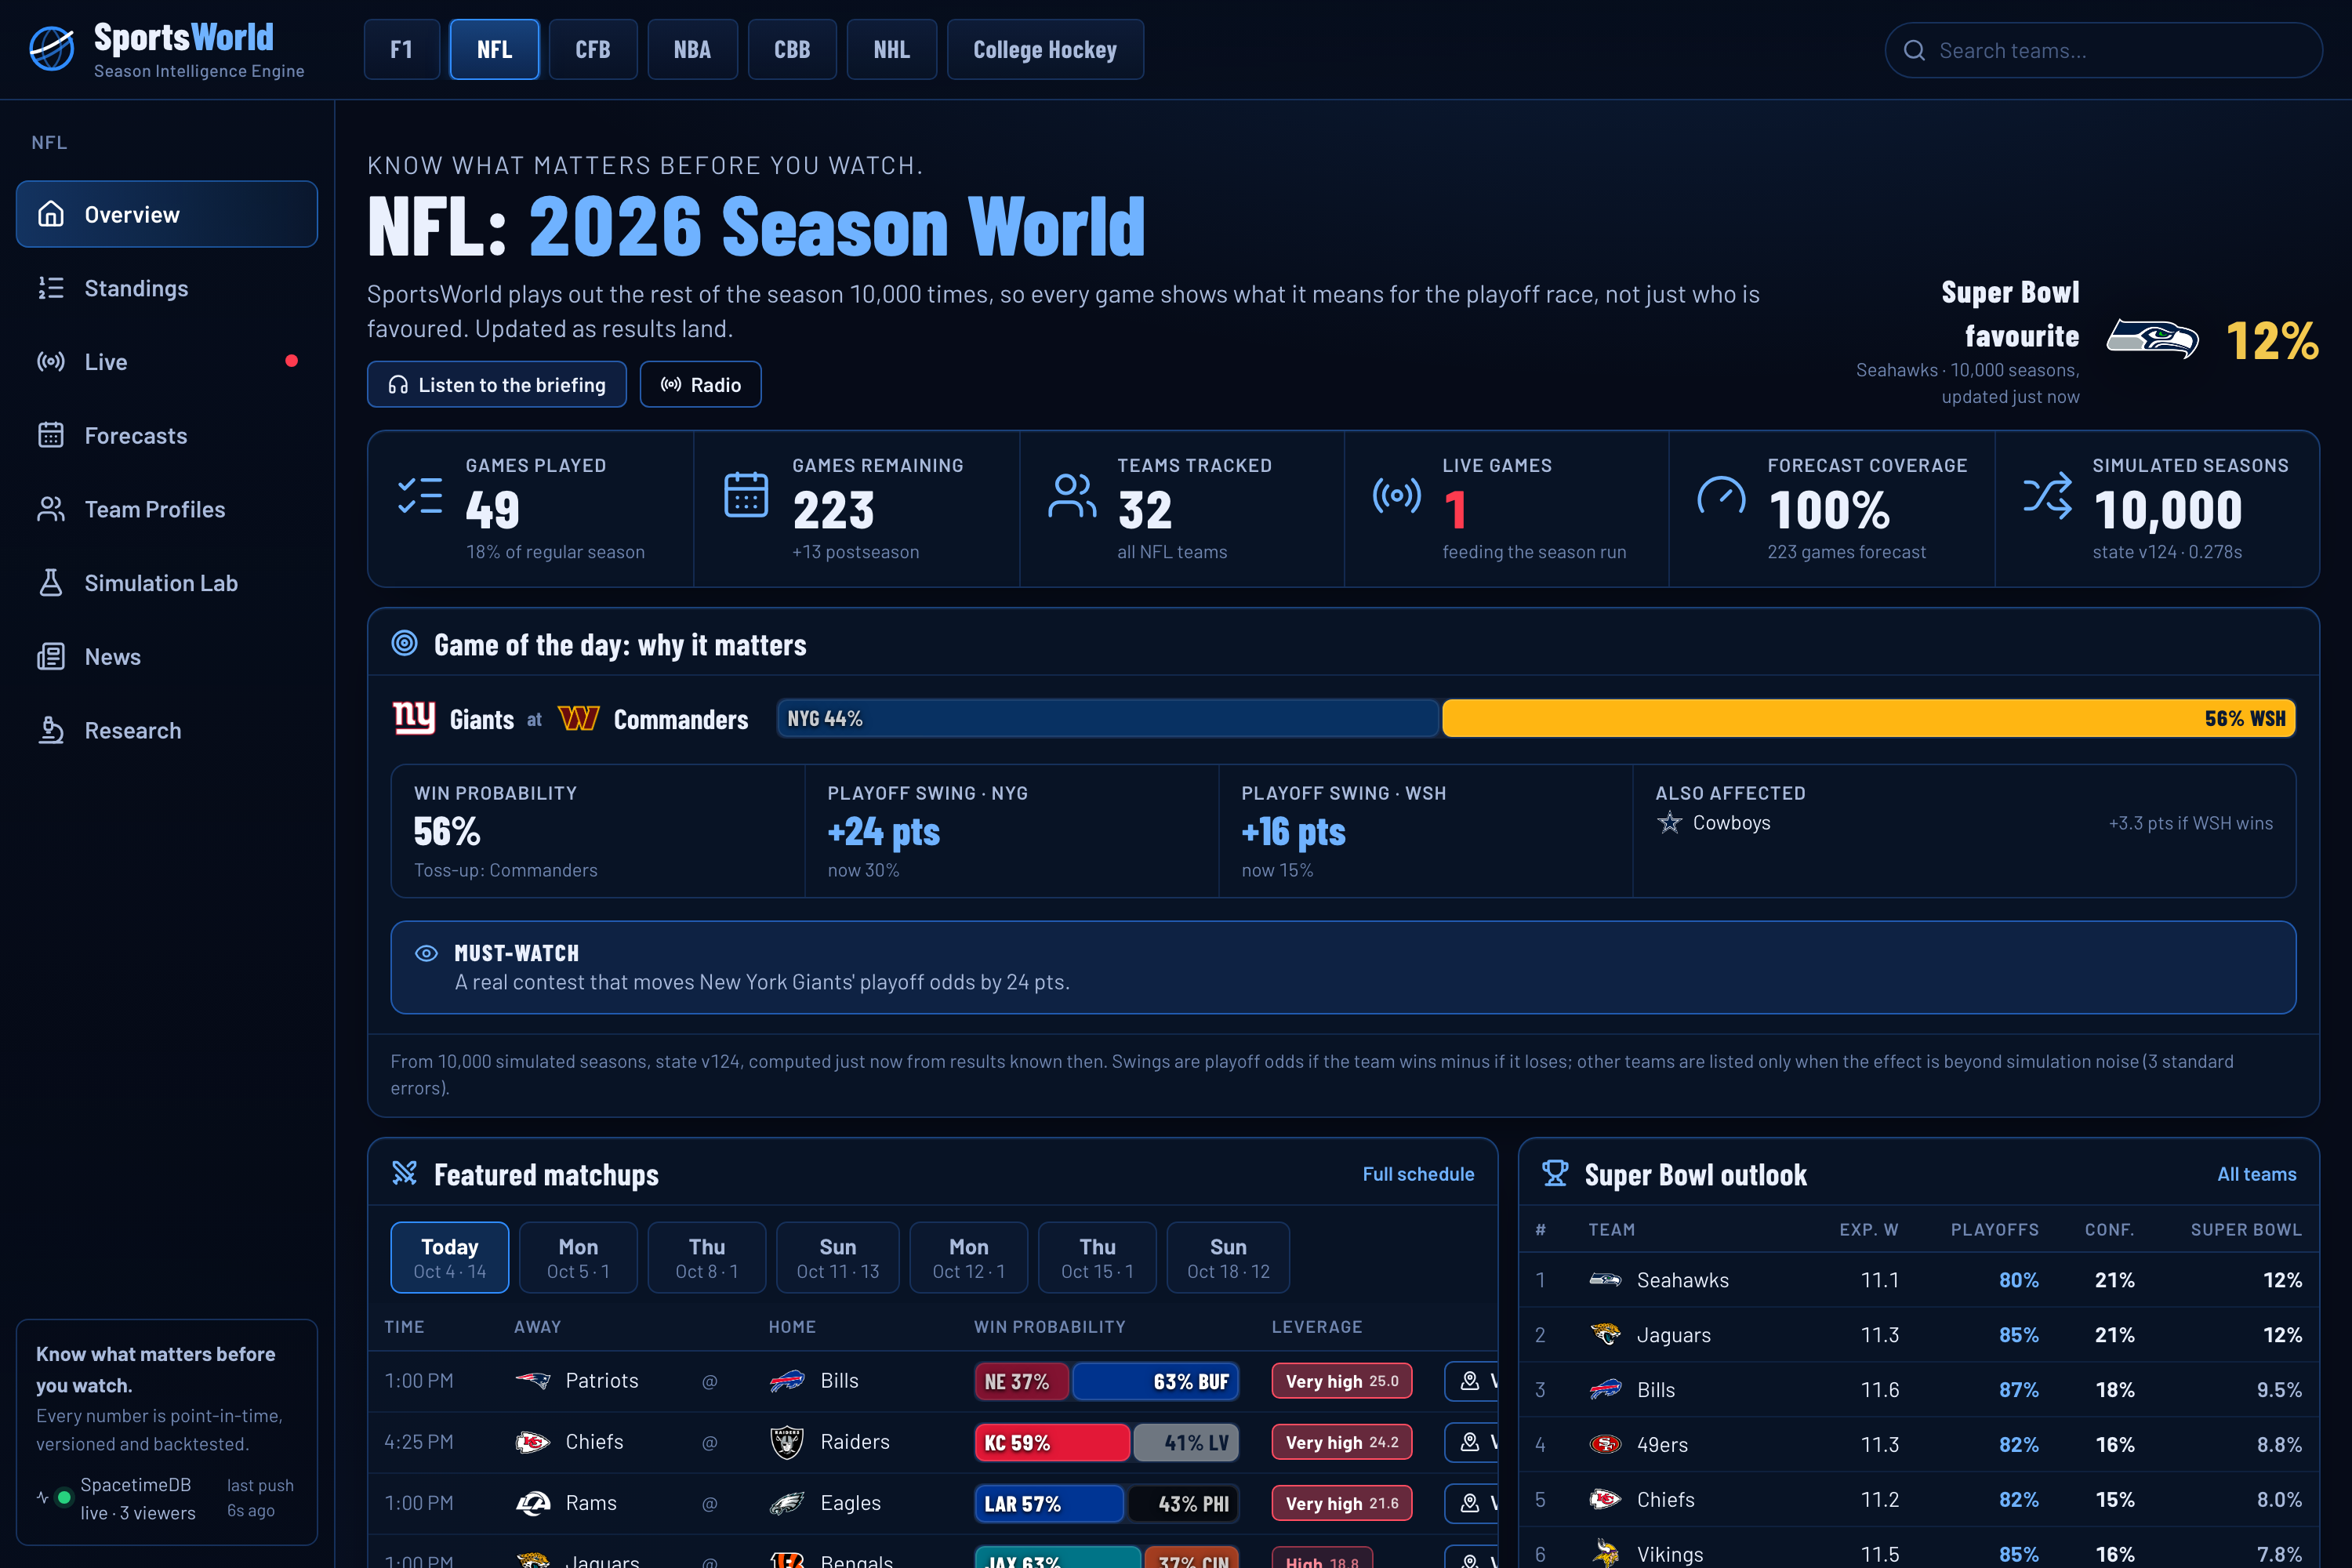
- Whole seasons, simulated. 10,000 full seasons per league through each league's real, versioned rules.
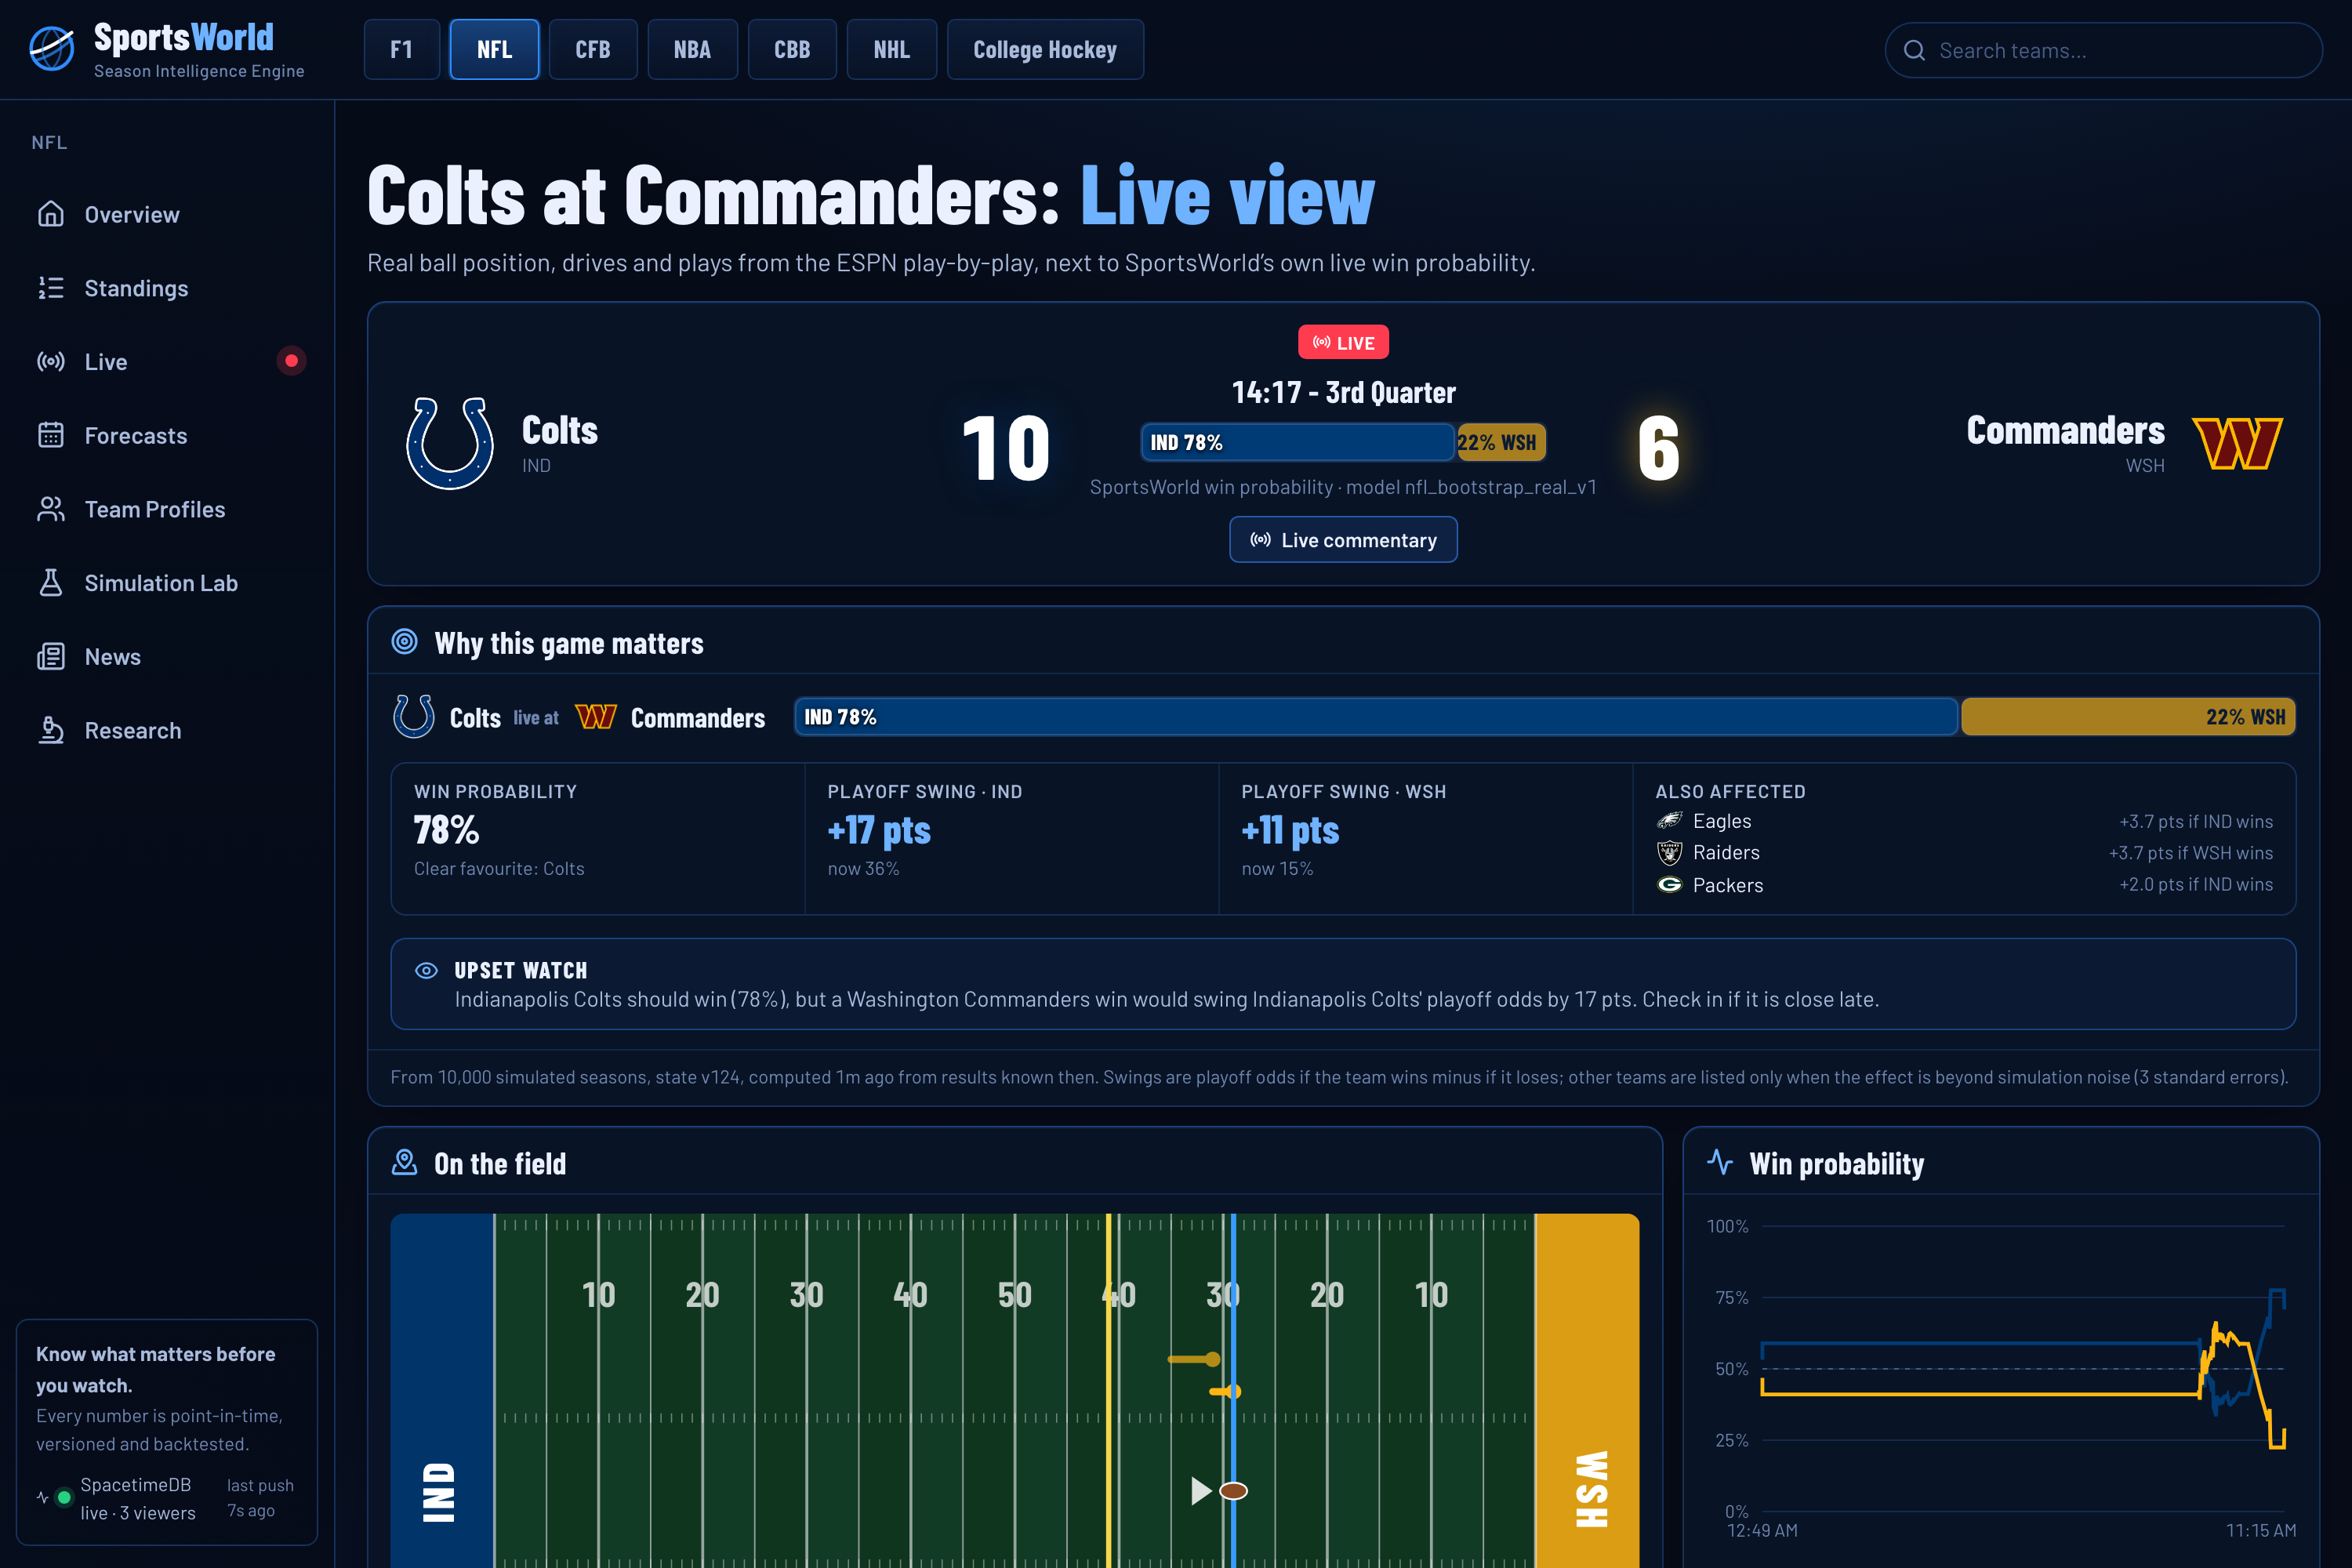
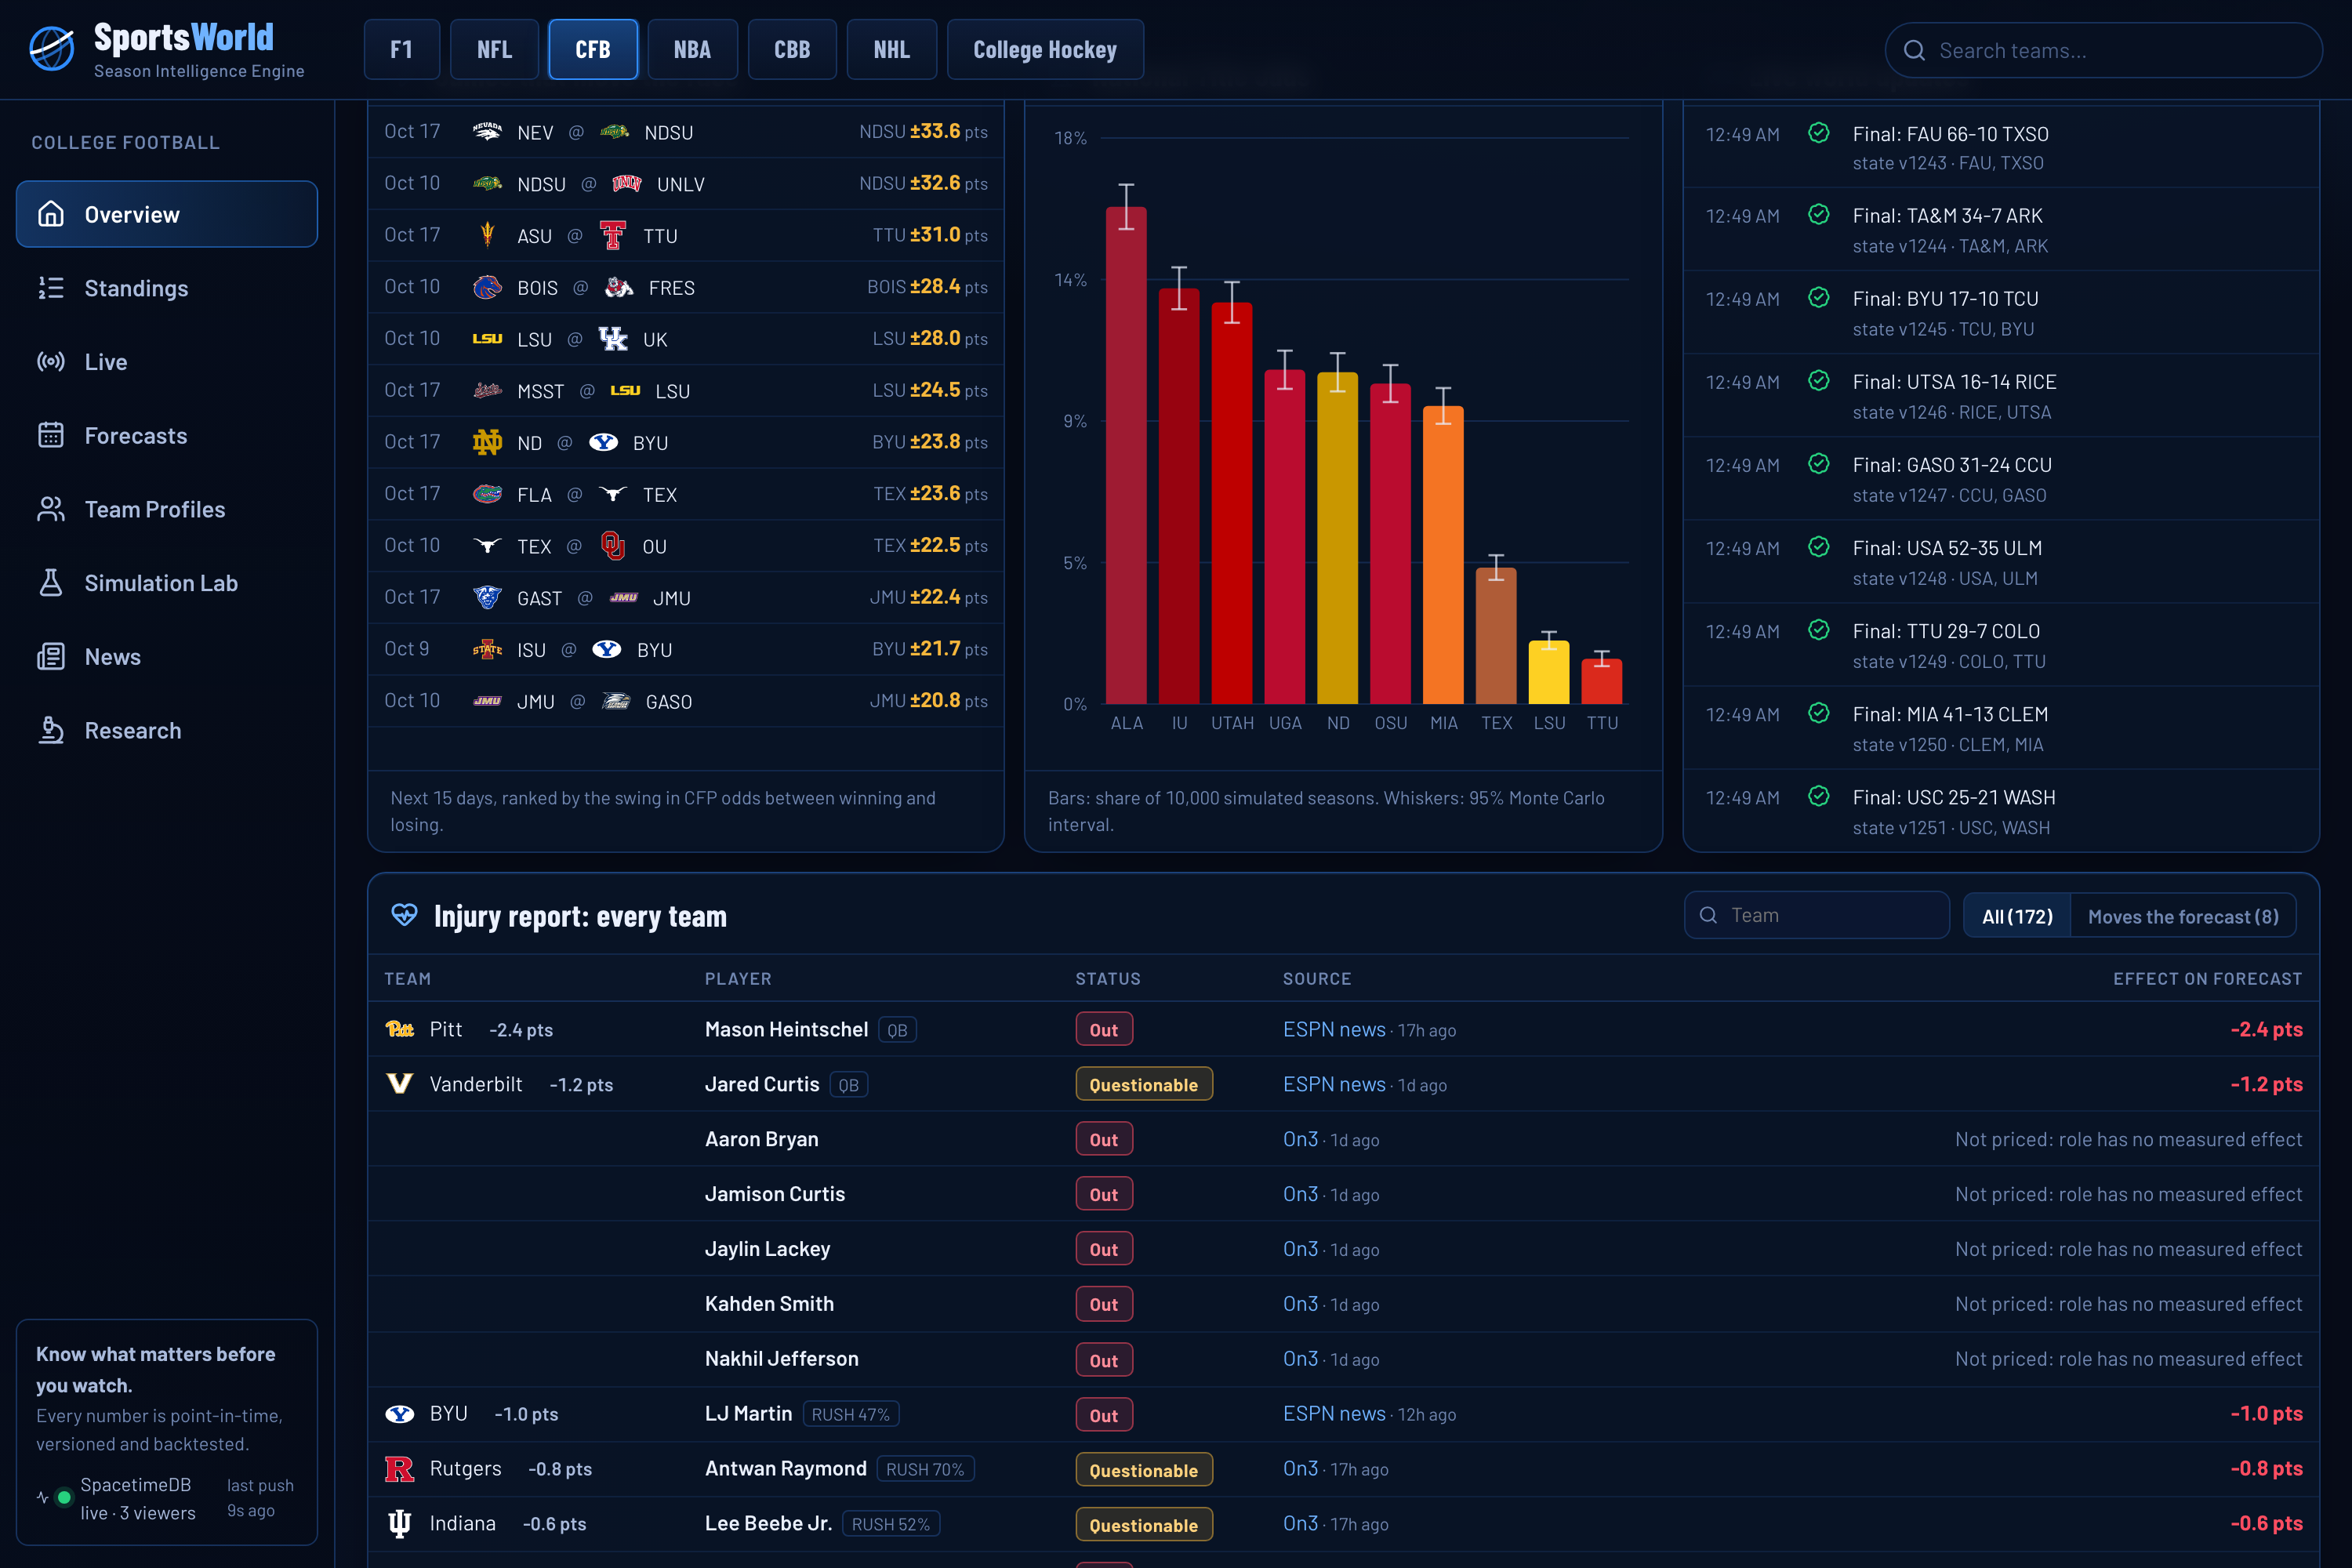
- Why this game matters. For every game: win probability with an honest label (toss-up, lean, favourite, one-sided), each side's playoff swing, the other teams whose odds move, and a viewing call (must-watch, upset watch, skip).
- Live, shared state. A final score updates both teams, every affected game, the season and the playoff race, and SpacetimeDB pushes the new versioned state to every open browser at once (two clients measured 4 ms apart).
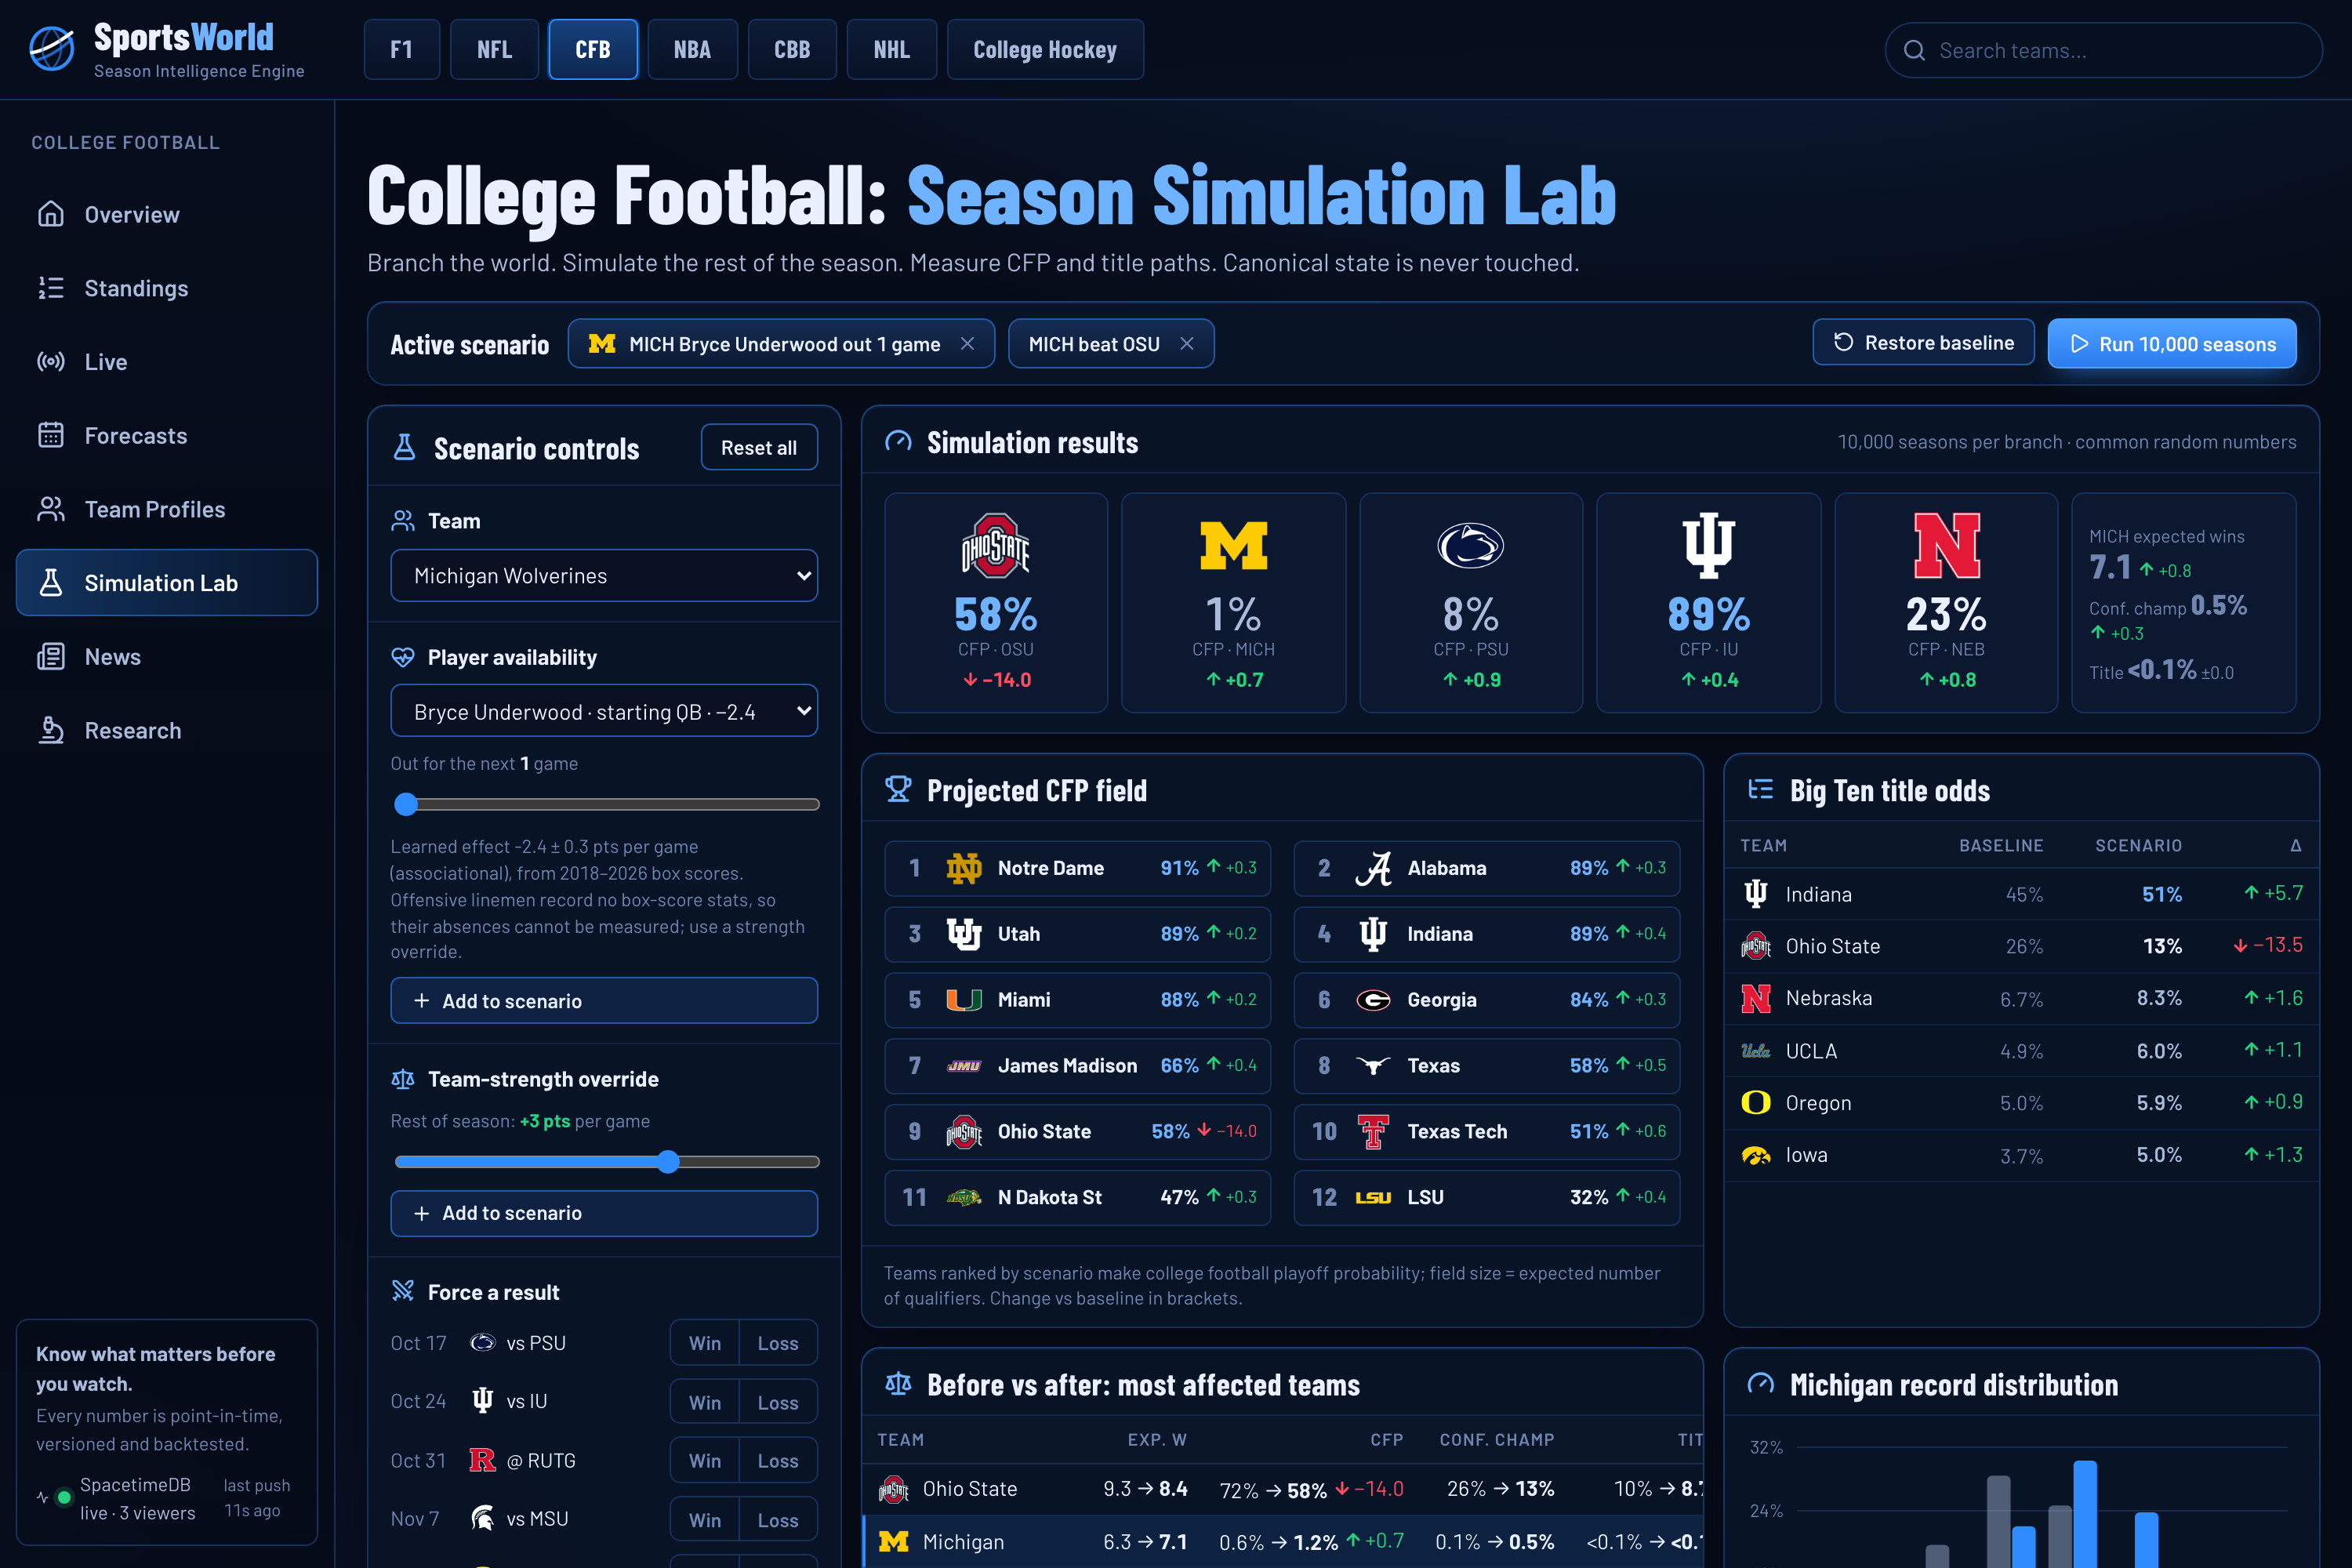
- Simulation Lab. Pick who is out by name (every regular, with a learned effect), force a result, or ask in plain English, and get 10,000 seasons per branch back in about a second.
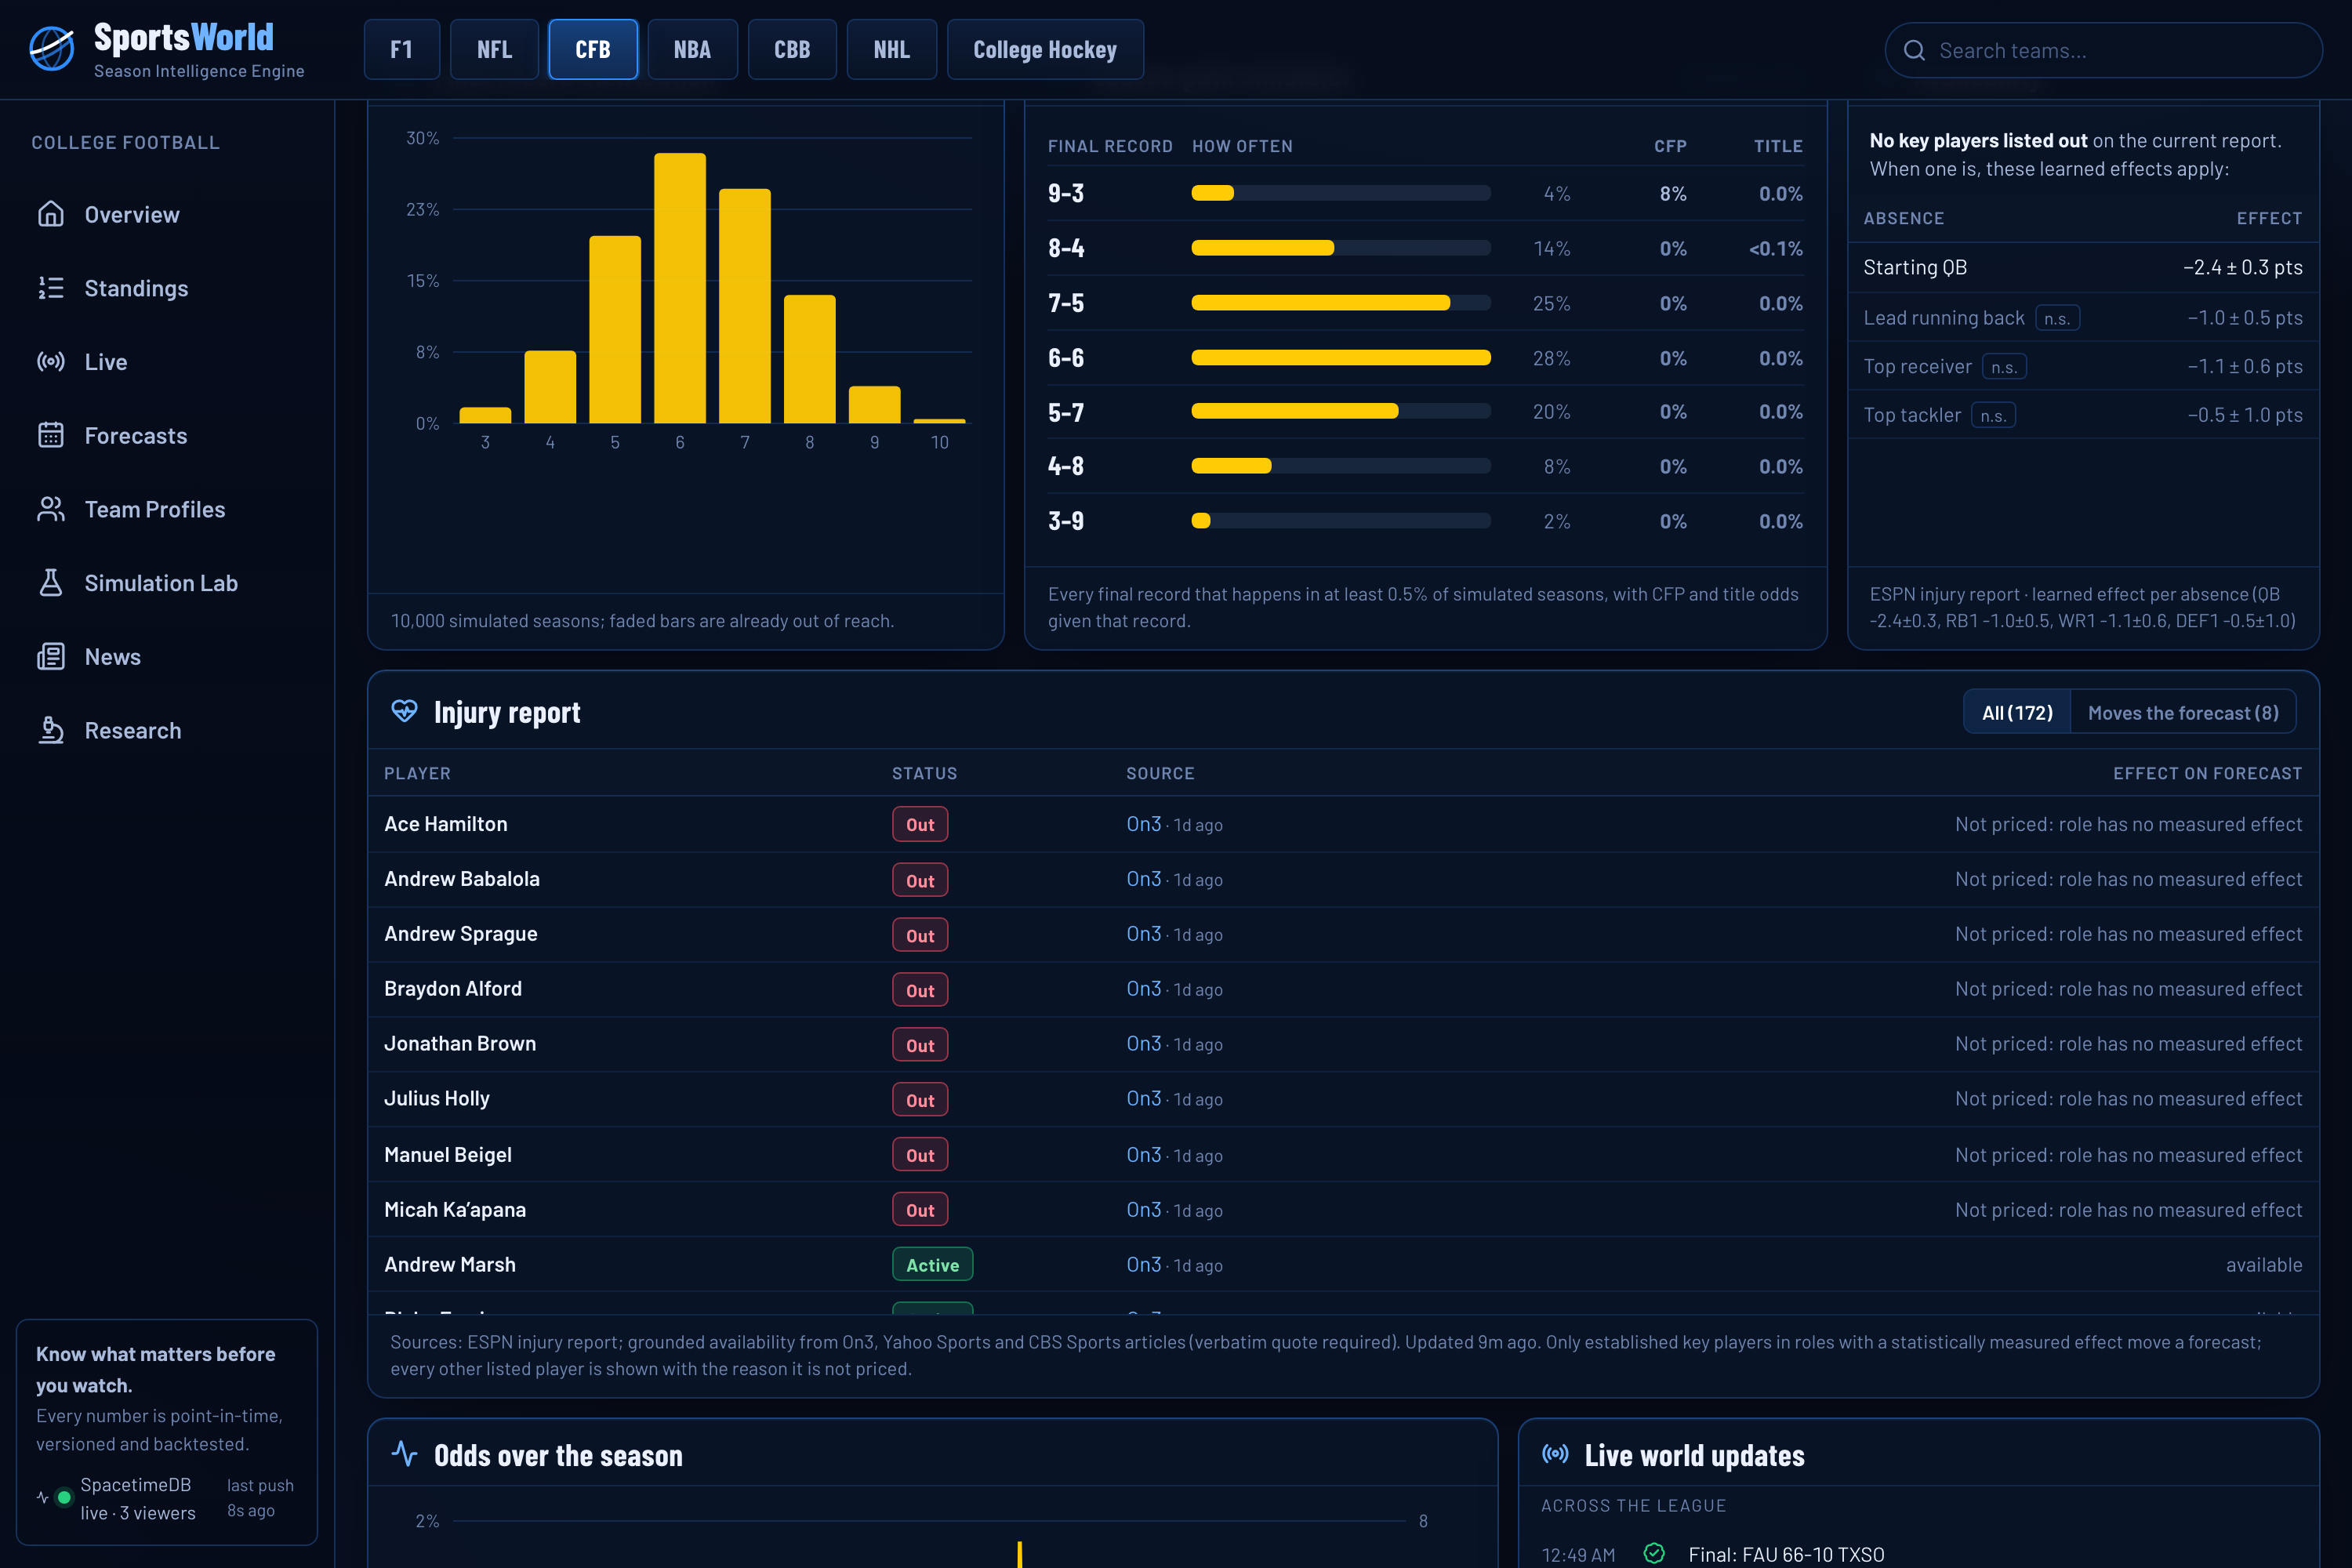
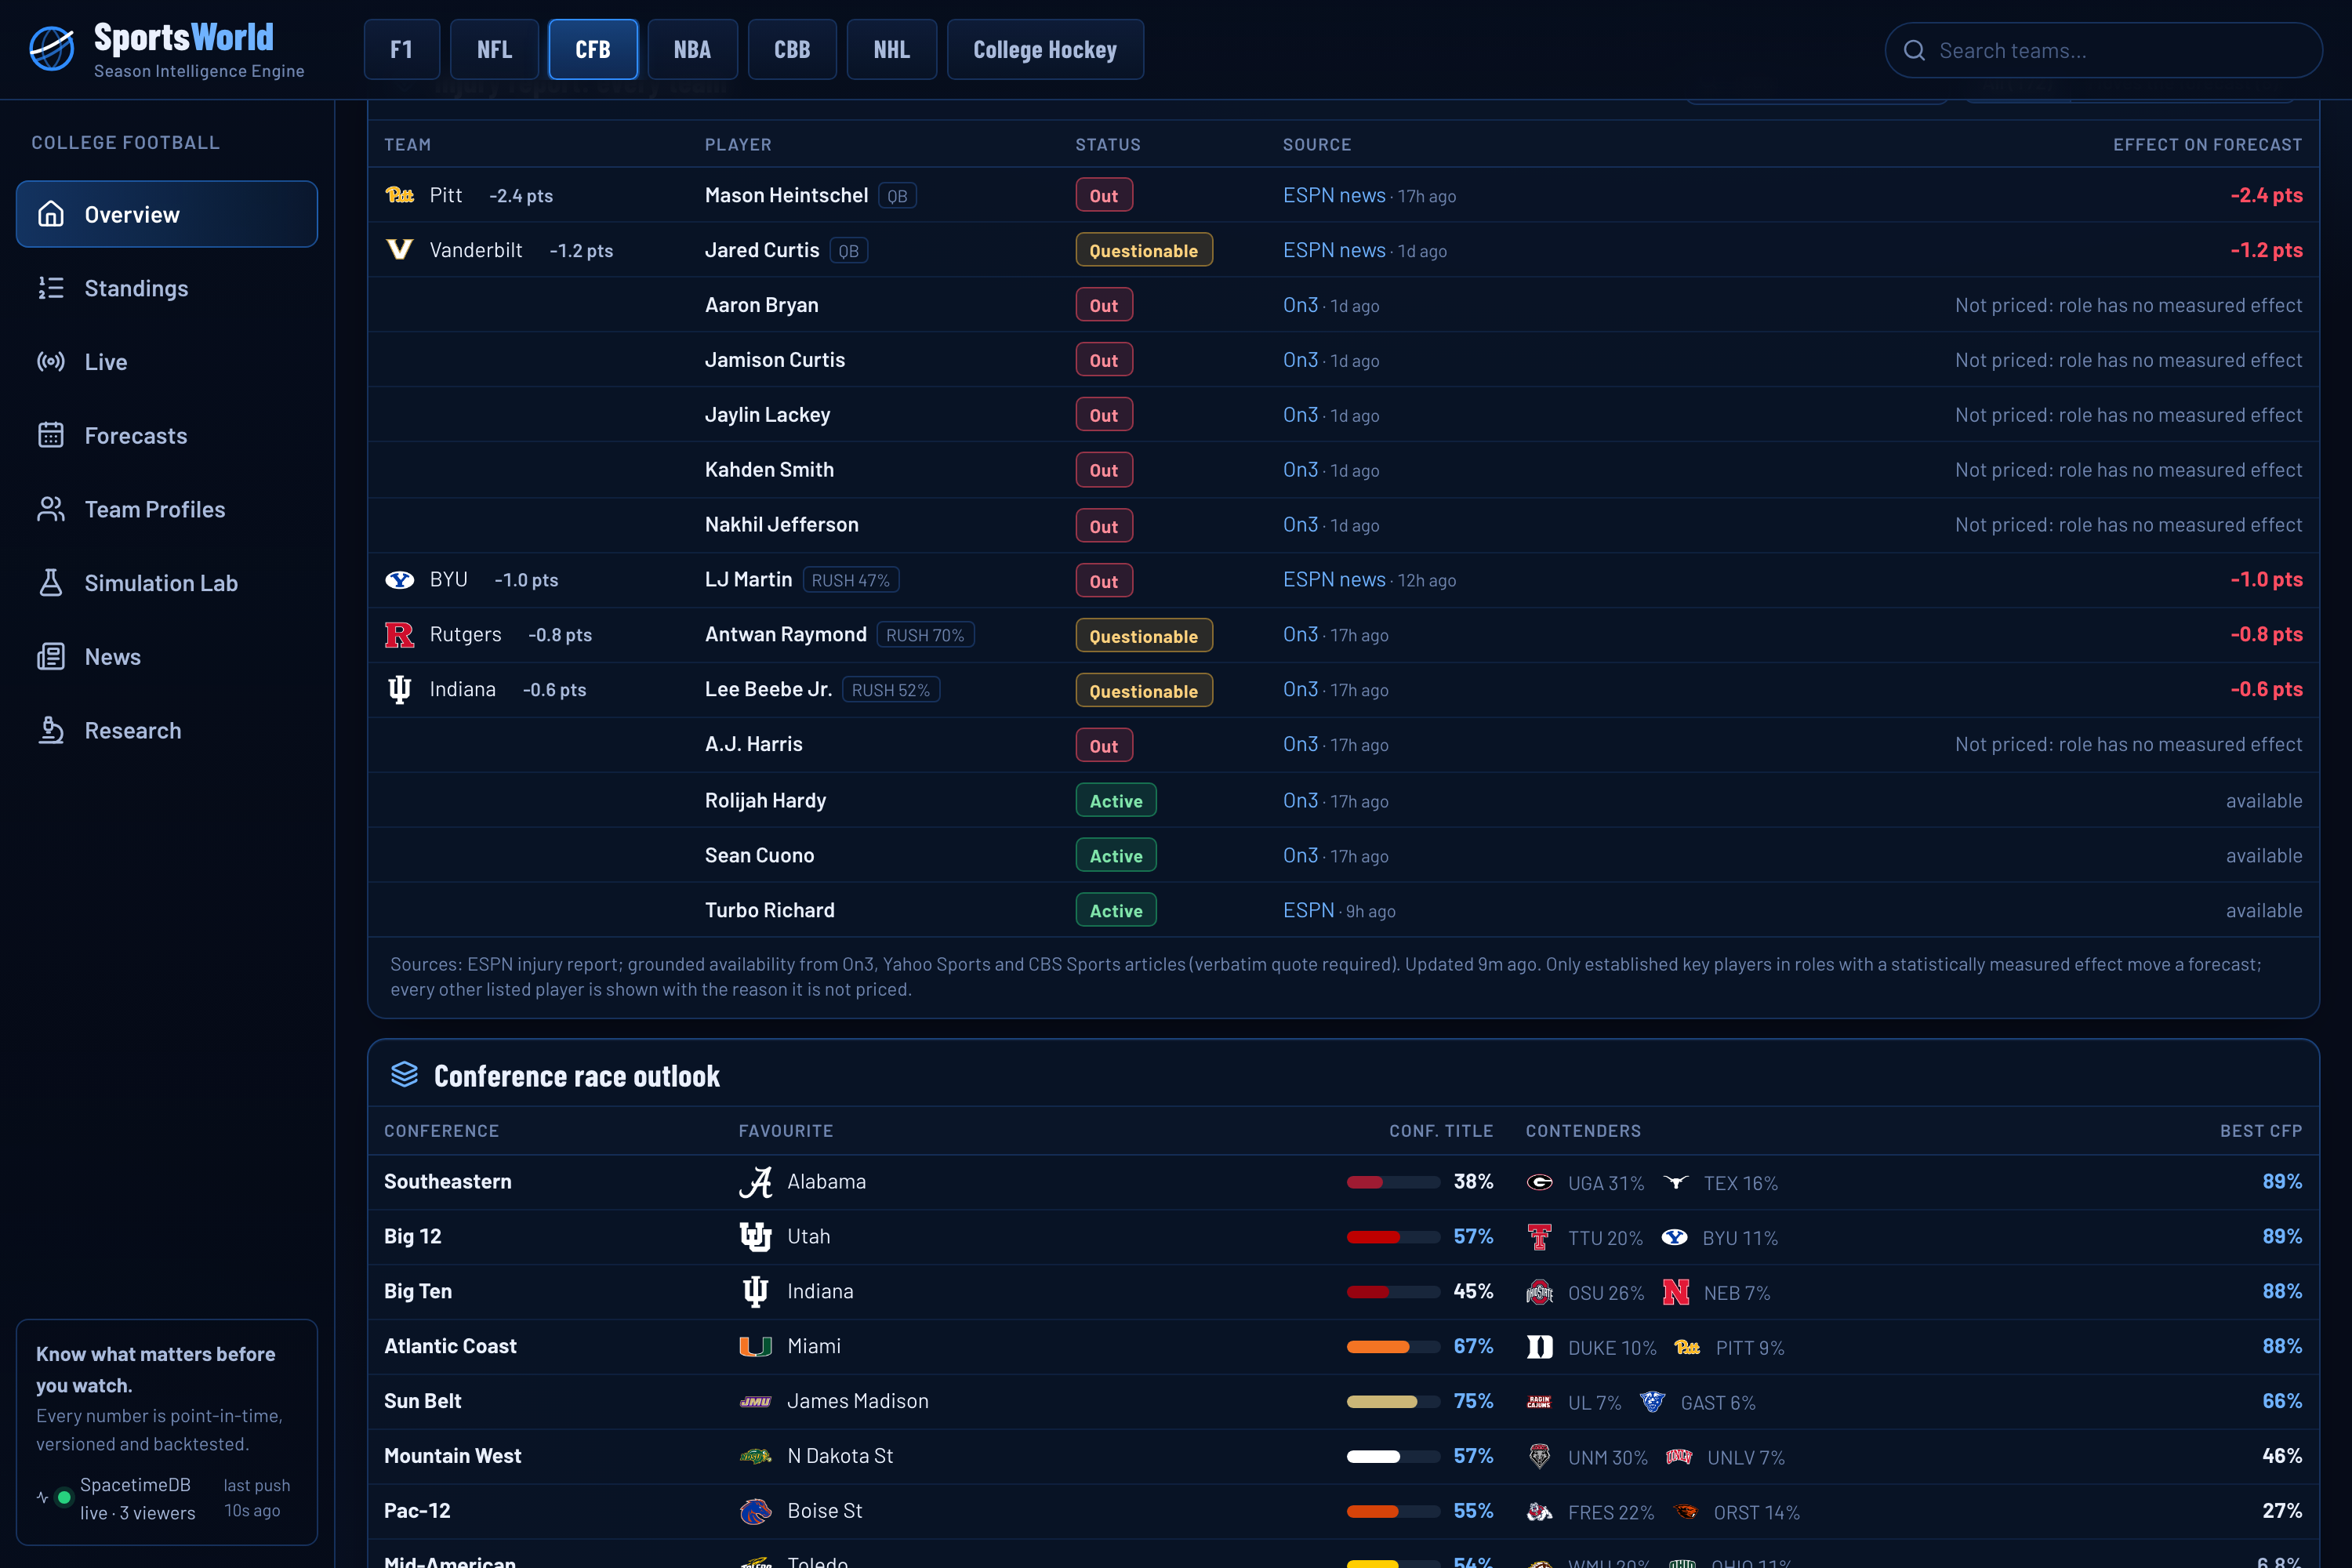
- Injury report for every team. The official report plus the conferences' mandated availability reports and injury news from many outlets, each player marked with whether it moves the forecast, and why.
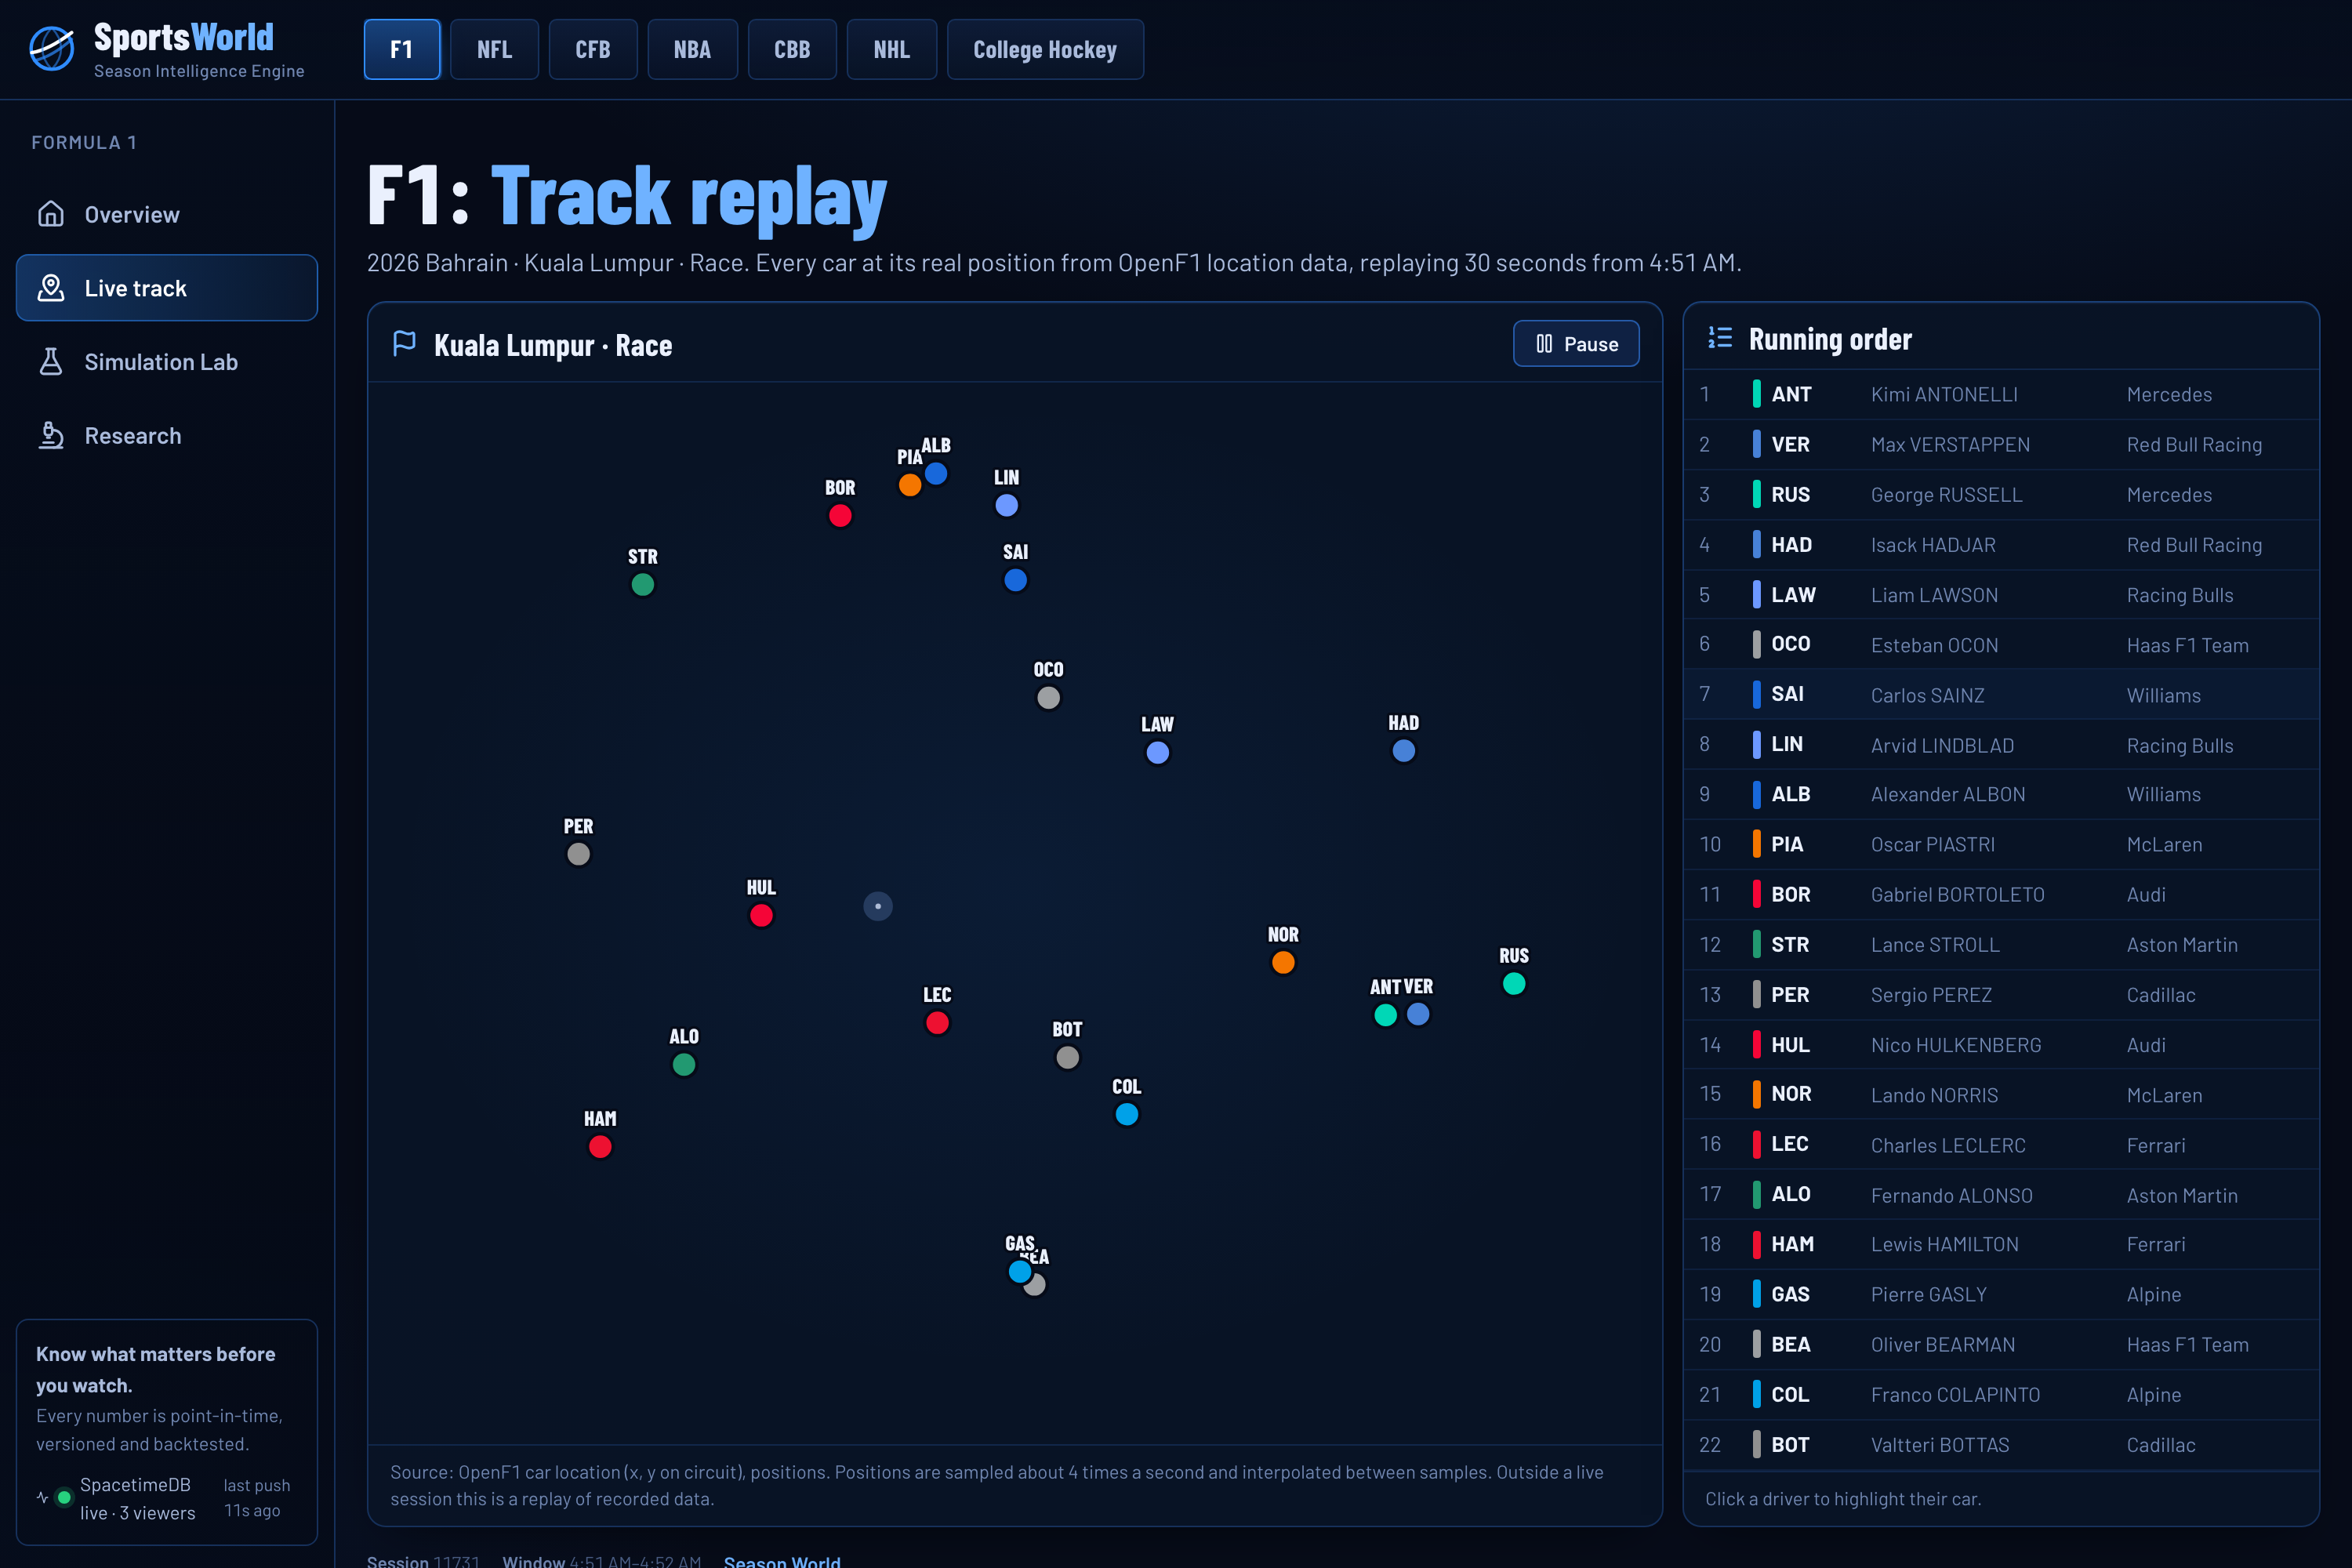
- Live games with real positions. Ball spot and drives, shot charts, rink events, every F1 car on track, plus box scores and live commentary voiced by ElevenLabs.
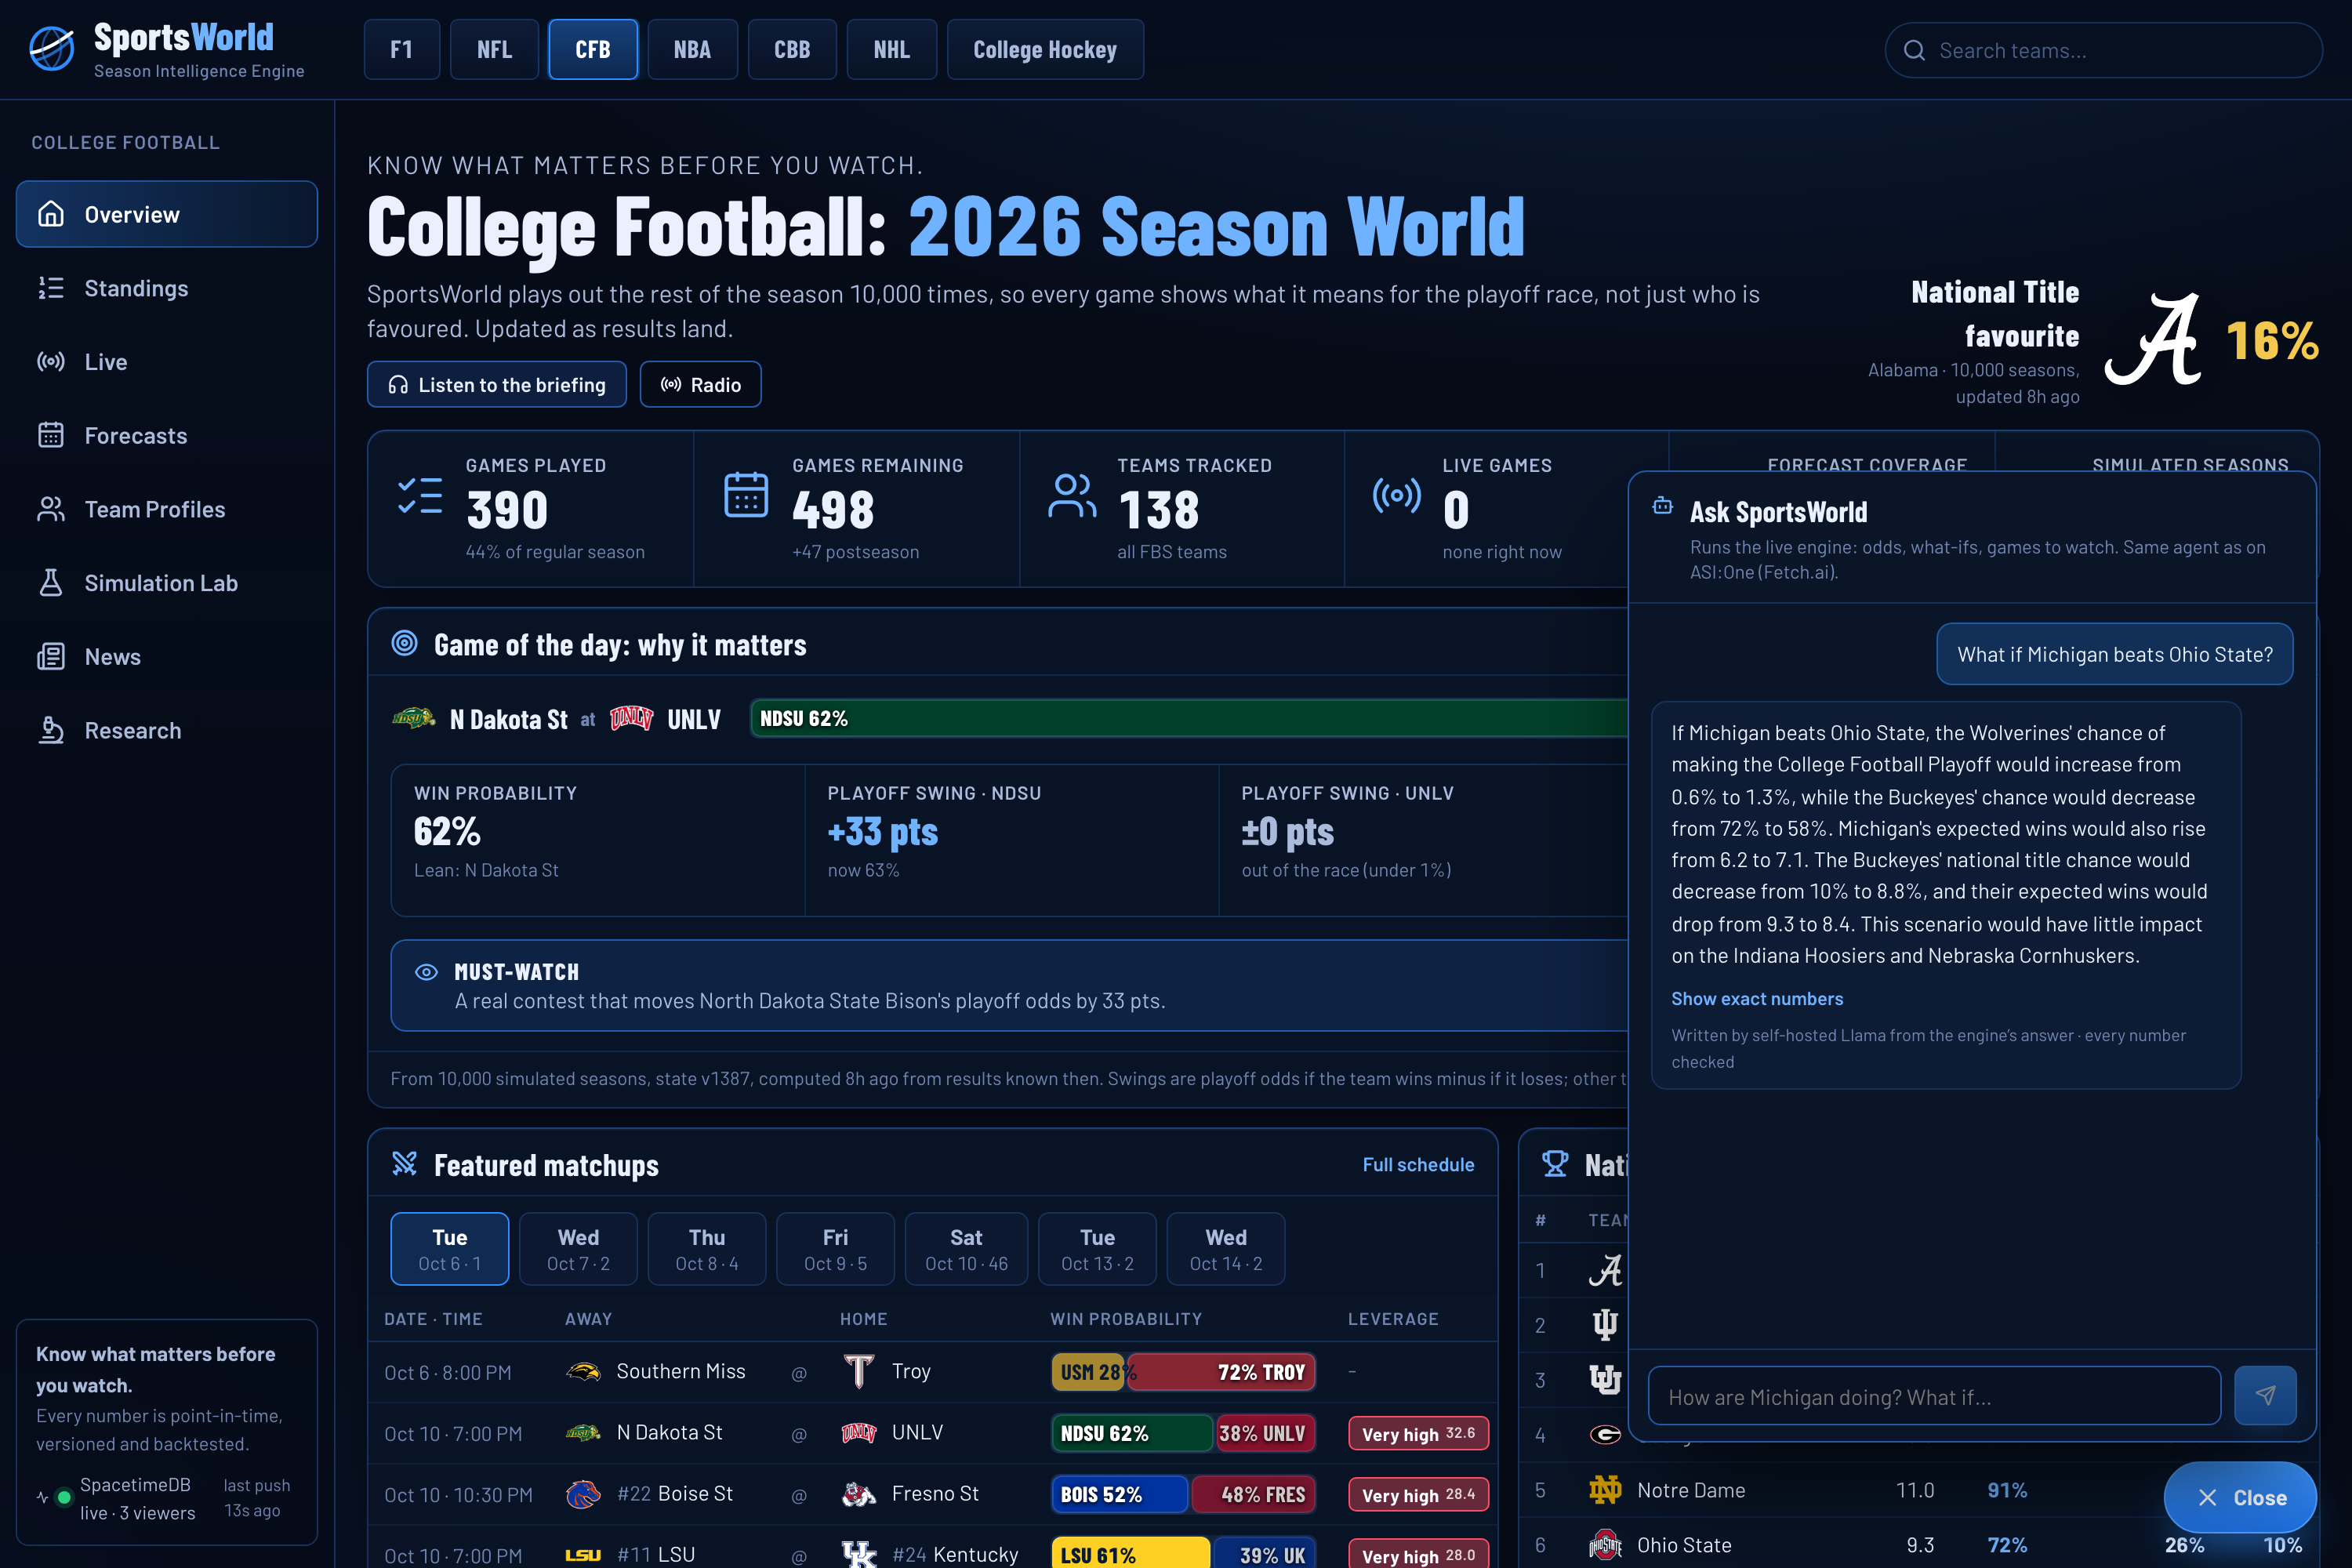
- An agent that runs the engine. SportsWorld Analyst lives on ASI:One (Fetch.ai) and in the site's chat; a self-hosted Llama 3.3 70B rewrites its answers conversationally, and any rewrite with a number or verdict the engine didn't give is rejected.
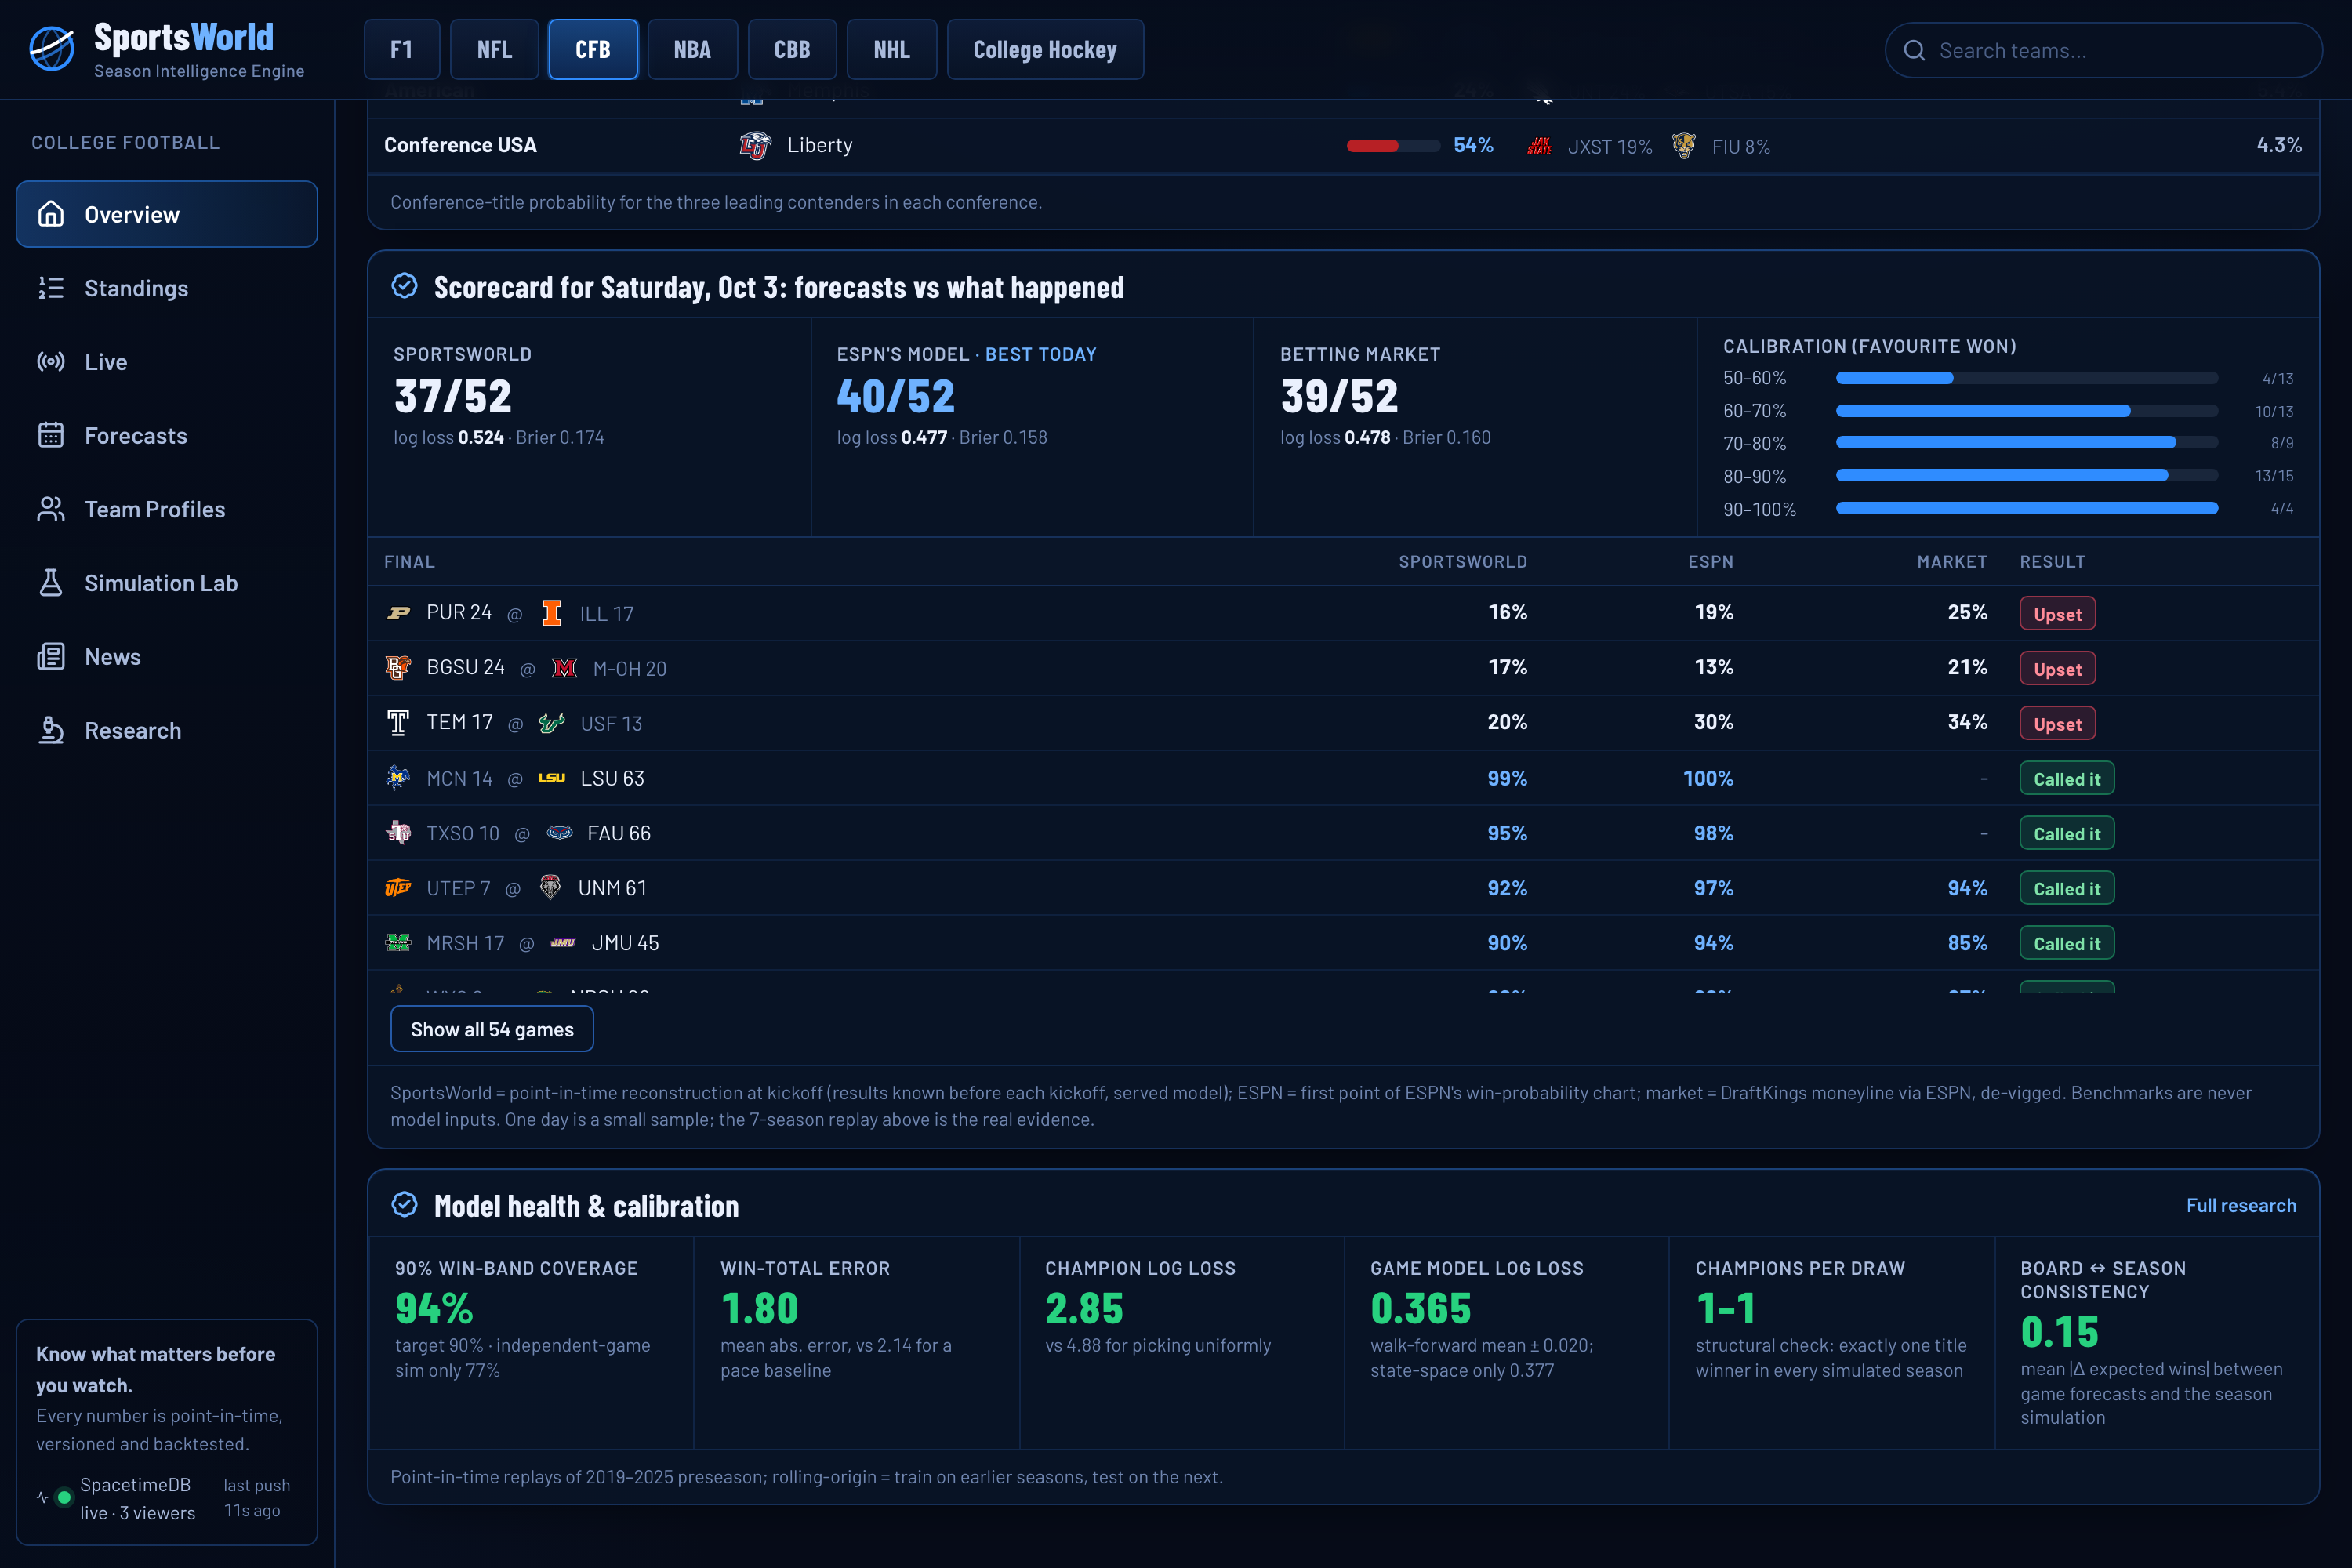
- It grades itself. A daily scorecard compares our point-in-time kickoff forecasts with what happened, next to ESPN's model and the betting market, good days or bad.
How we built it
Data, all real. 101,061 archived games across 8 leagues (2018 to today), play-by-play for 9,829 football games plus NBA and NHL event streams, box scores for every NFL and FBS game since 2018, live injury reports, conference availability reports, Jolpica F1 results and OpenF1 car telemetry. Every observation carries its event time and the time the model knew it, so any competition can be rebuilt exactly as it stood on any past date. Betting lines are a benchmark only, never an input.
Team strength (Kalman filter). Before a game, the expected home margin is
$$\hat{m} = \mu_h - \mu_a + h \cdot \mathbb{1}[\text{not neutral}]$$
and after the result $m$, each team's mean moves by a Kalman gain $K = \frac{\sigma^2}{\sigma_h^2 + \sigma_a^2 + \sigma_{\text{obs}}^2}$ times the surprise $m - \hat{m}$, while its variance shrinks. Home field, observation noise, drift and season-to-season carry-over are fit by one-step predictive likelihood on earlier seasons only.
Win probability. A bootstrap ensemble of logistic models on the strength gap, its uncertainty, home field and rest, plus live state (margin, time left, possession, and down, distance and field position through a learned expected-points model), temperature-calibrated per league.
Season Monte Carlo. The key choice: each simulated season draws every team's true strength once,
$$\theta_i^{(s)} \sim \mathcal{N}(\mu_i, \sigma_i^2), \quad s = 1, \dots, 10{,}000,$$
so a team's games rise and fall together, as they do in real life. Every game is played from those strengths, then the real rules decide standings and brackets. Probabilities are counts: $P(\text{playoffs}) = \frac{1}{S}\sum_s \mathbb{1}[\text{made playoffs in season } s]$.
Leverage and ripple. For a game $g$ and milestone $M$,
$$\Delta_g = P(M \mid \text{win } g) - P(M \mid \text{lose } g),$$
computed from the same simulated seasons for every team at once (one matrix product), and a third team is listed only when $|\Delta| > 3\,\mathrm{SE}$, so we never show simulation noise as insight.
Player absences. Residual margin versus the point-in-time expectation, regressed on who was missing. Each regular is valued by their share of the team's carries, catches and tackles, so every position is tested fairly. Starting QBs: NFL $-3.0 \pm 0.5$ points, FBS $-2.4 \pm 0.3$; FBS ball carriers $-2.2 \pm 0.9$ points per 100 % of carries missing. Only statistically significant effects move a live forecast.
Stack. Python, NumPy and FastAPI for the engine; PyTorch and LightGBM for research bake-offs on GPUs; React and TypeScript for the site; SpacetimeDB Maincloud for live shared state; Neon Postgres for history; ElevenLabs for voice; Llama 3.3 70B (vLLM) for language tasks only; Fetch.ai uAgents on Agentverse and ASI:One; served at worldofsports.tech through a Cloudflare Tunnel.
Challenges we ran into
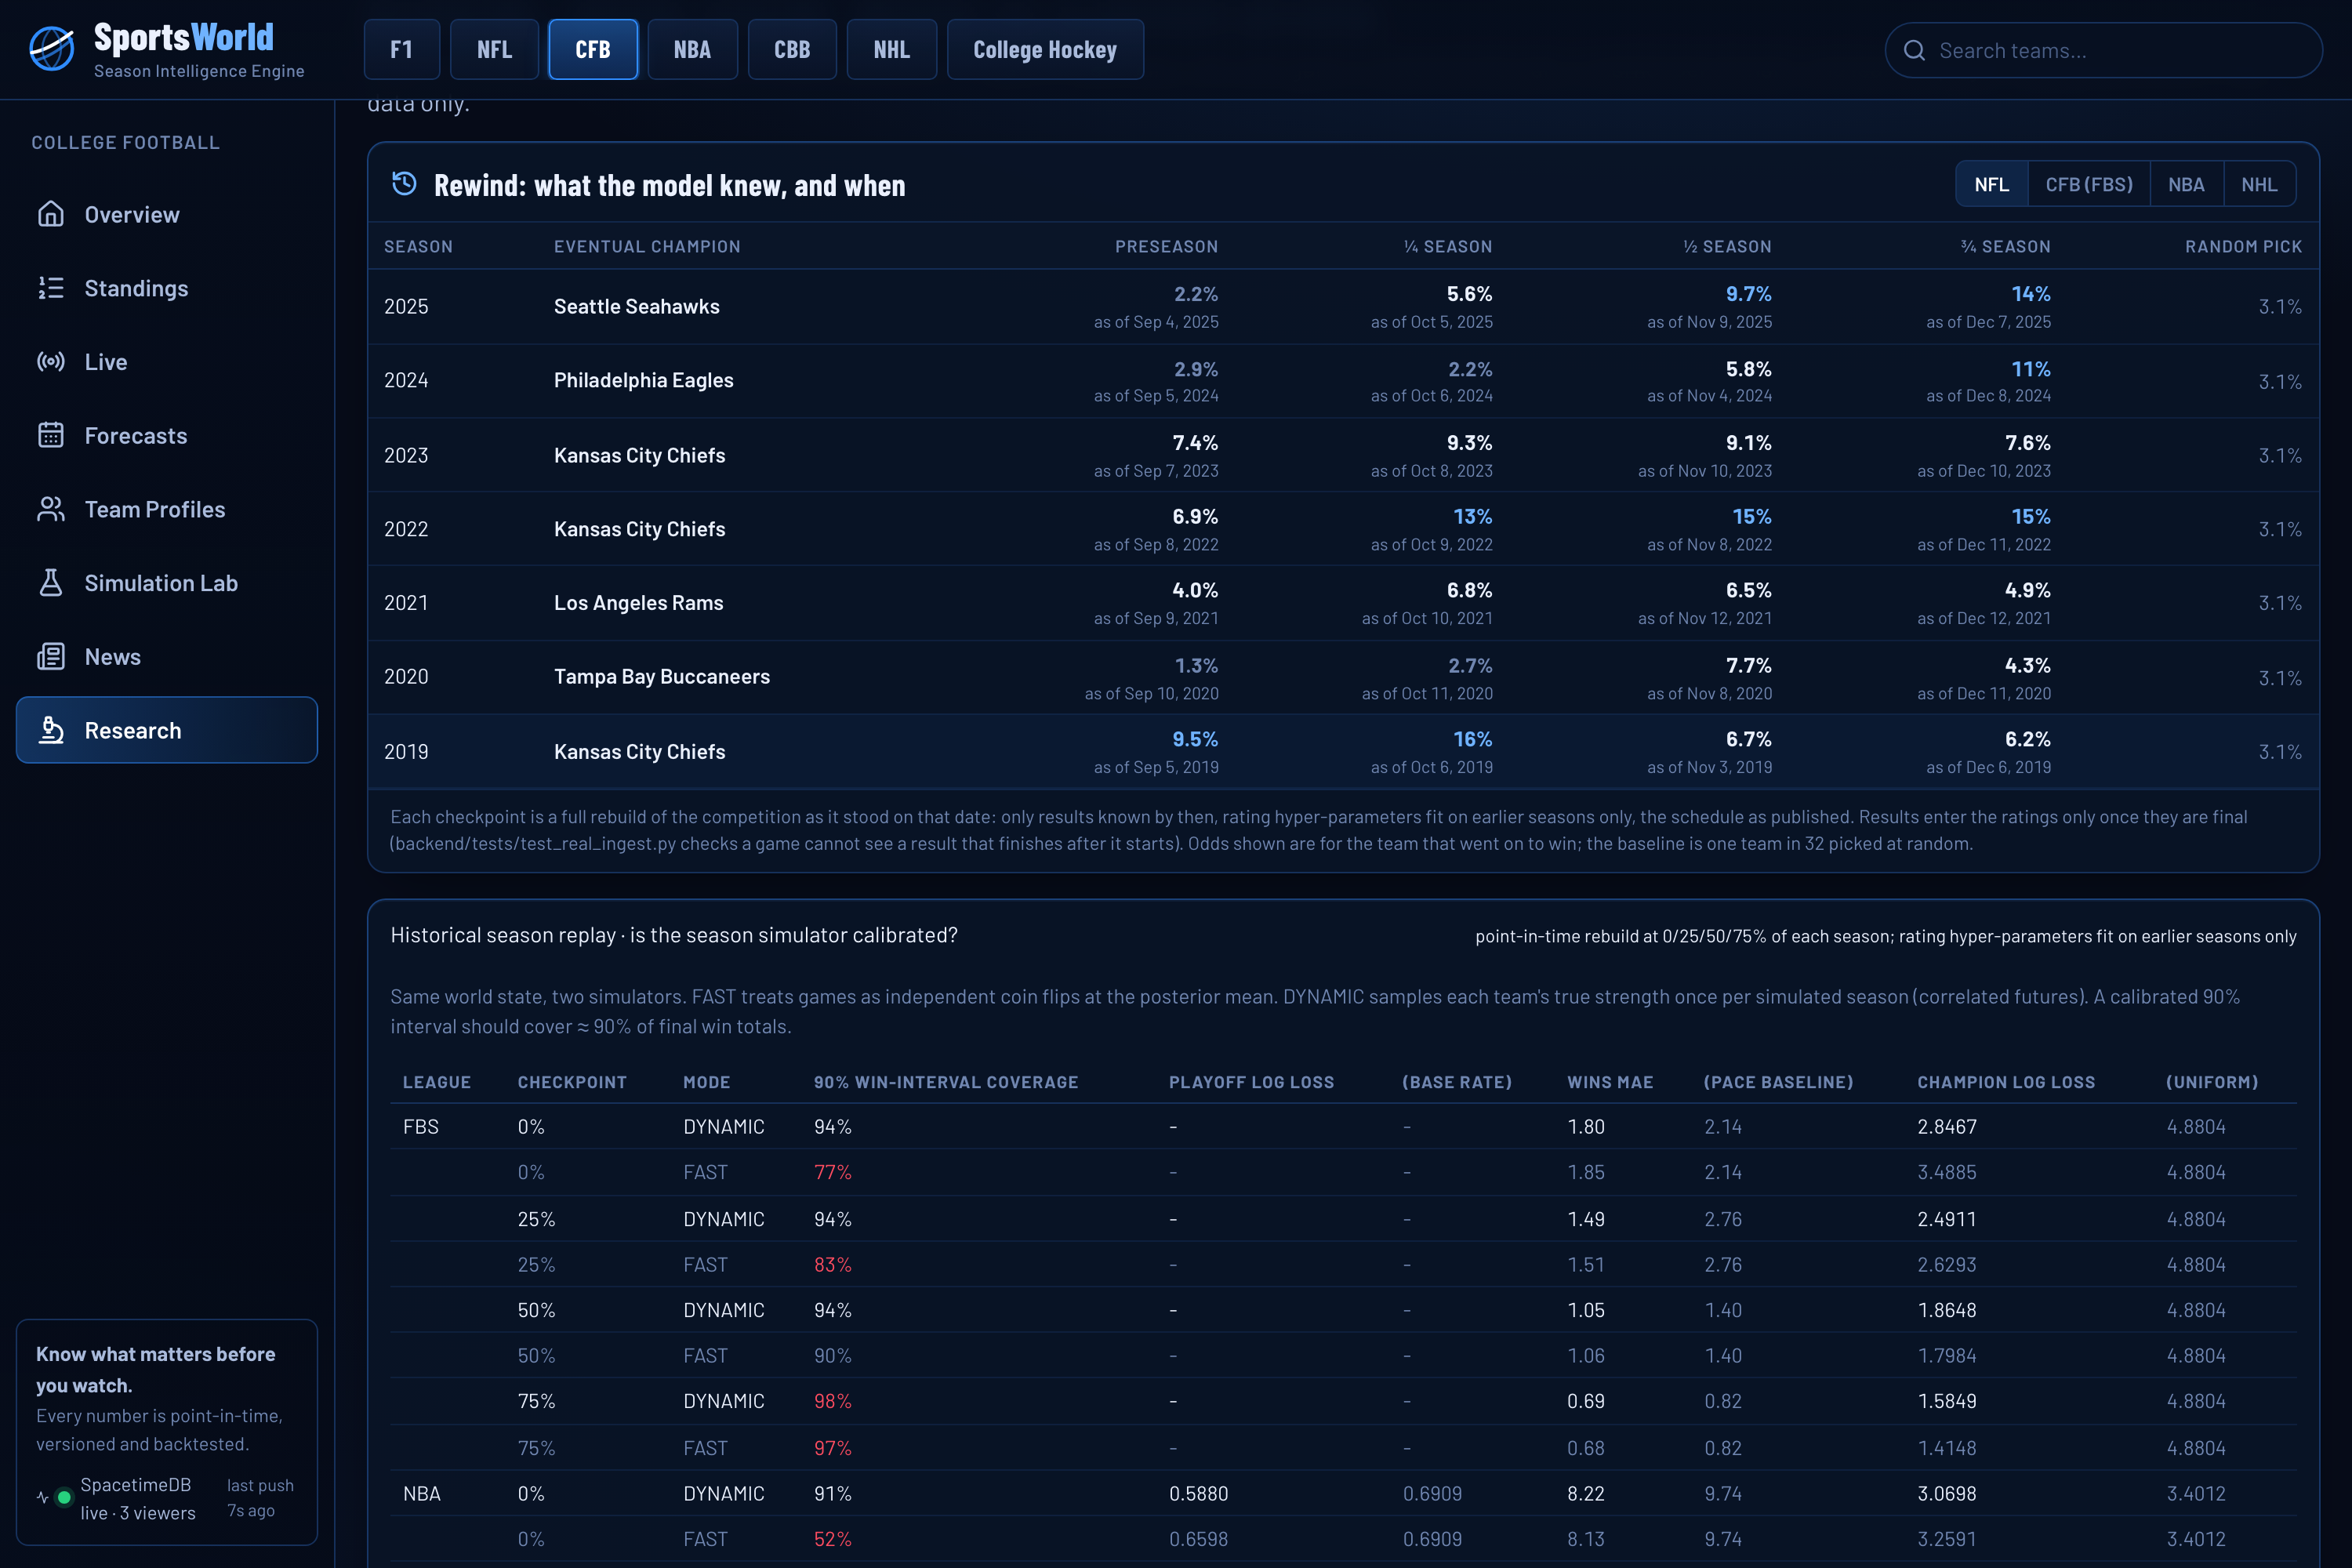
- Our simulator was overconfident. Simulating games as independent coin flips put the true win total inside our 90 % range only 52 to 77 % of the time. Drawing strength once per simulated season fixed it, and then inflated our leverage numbers, because a simulated win was also evidence the team was secretly better. We now take odds from the correlated run and leverage from the independent one.
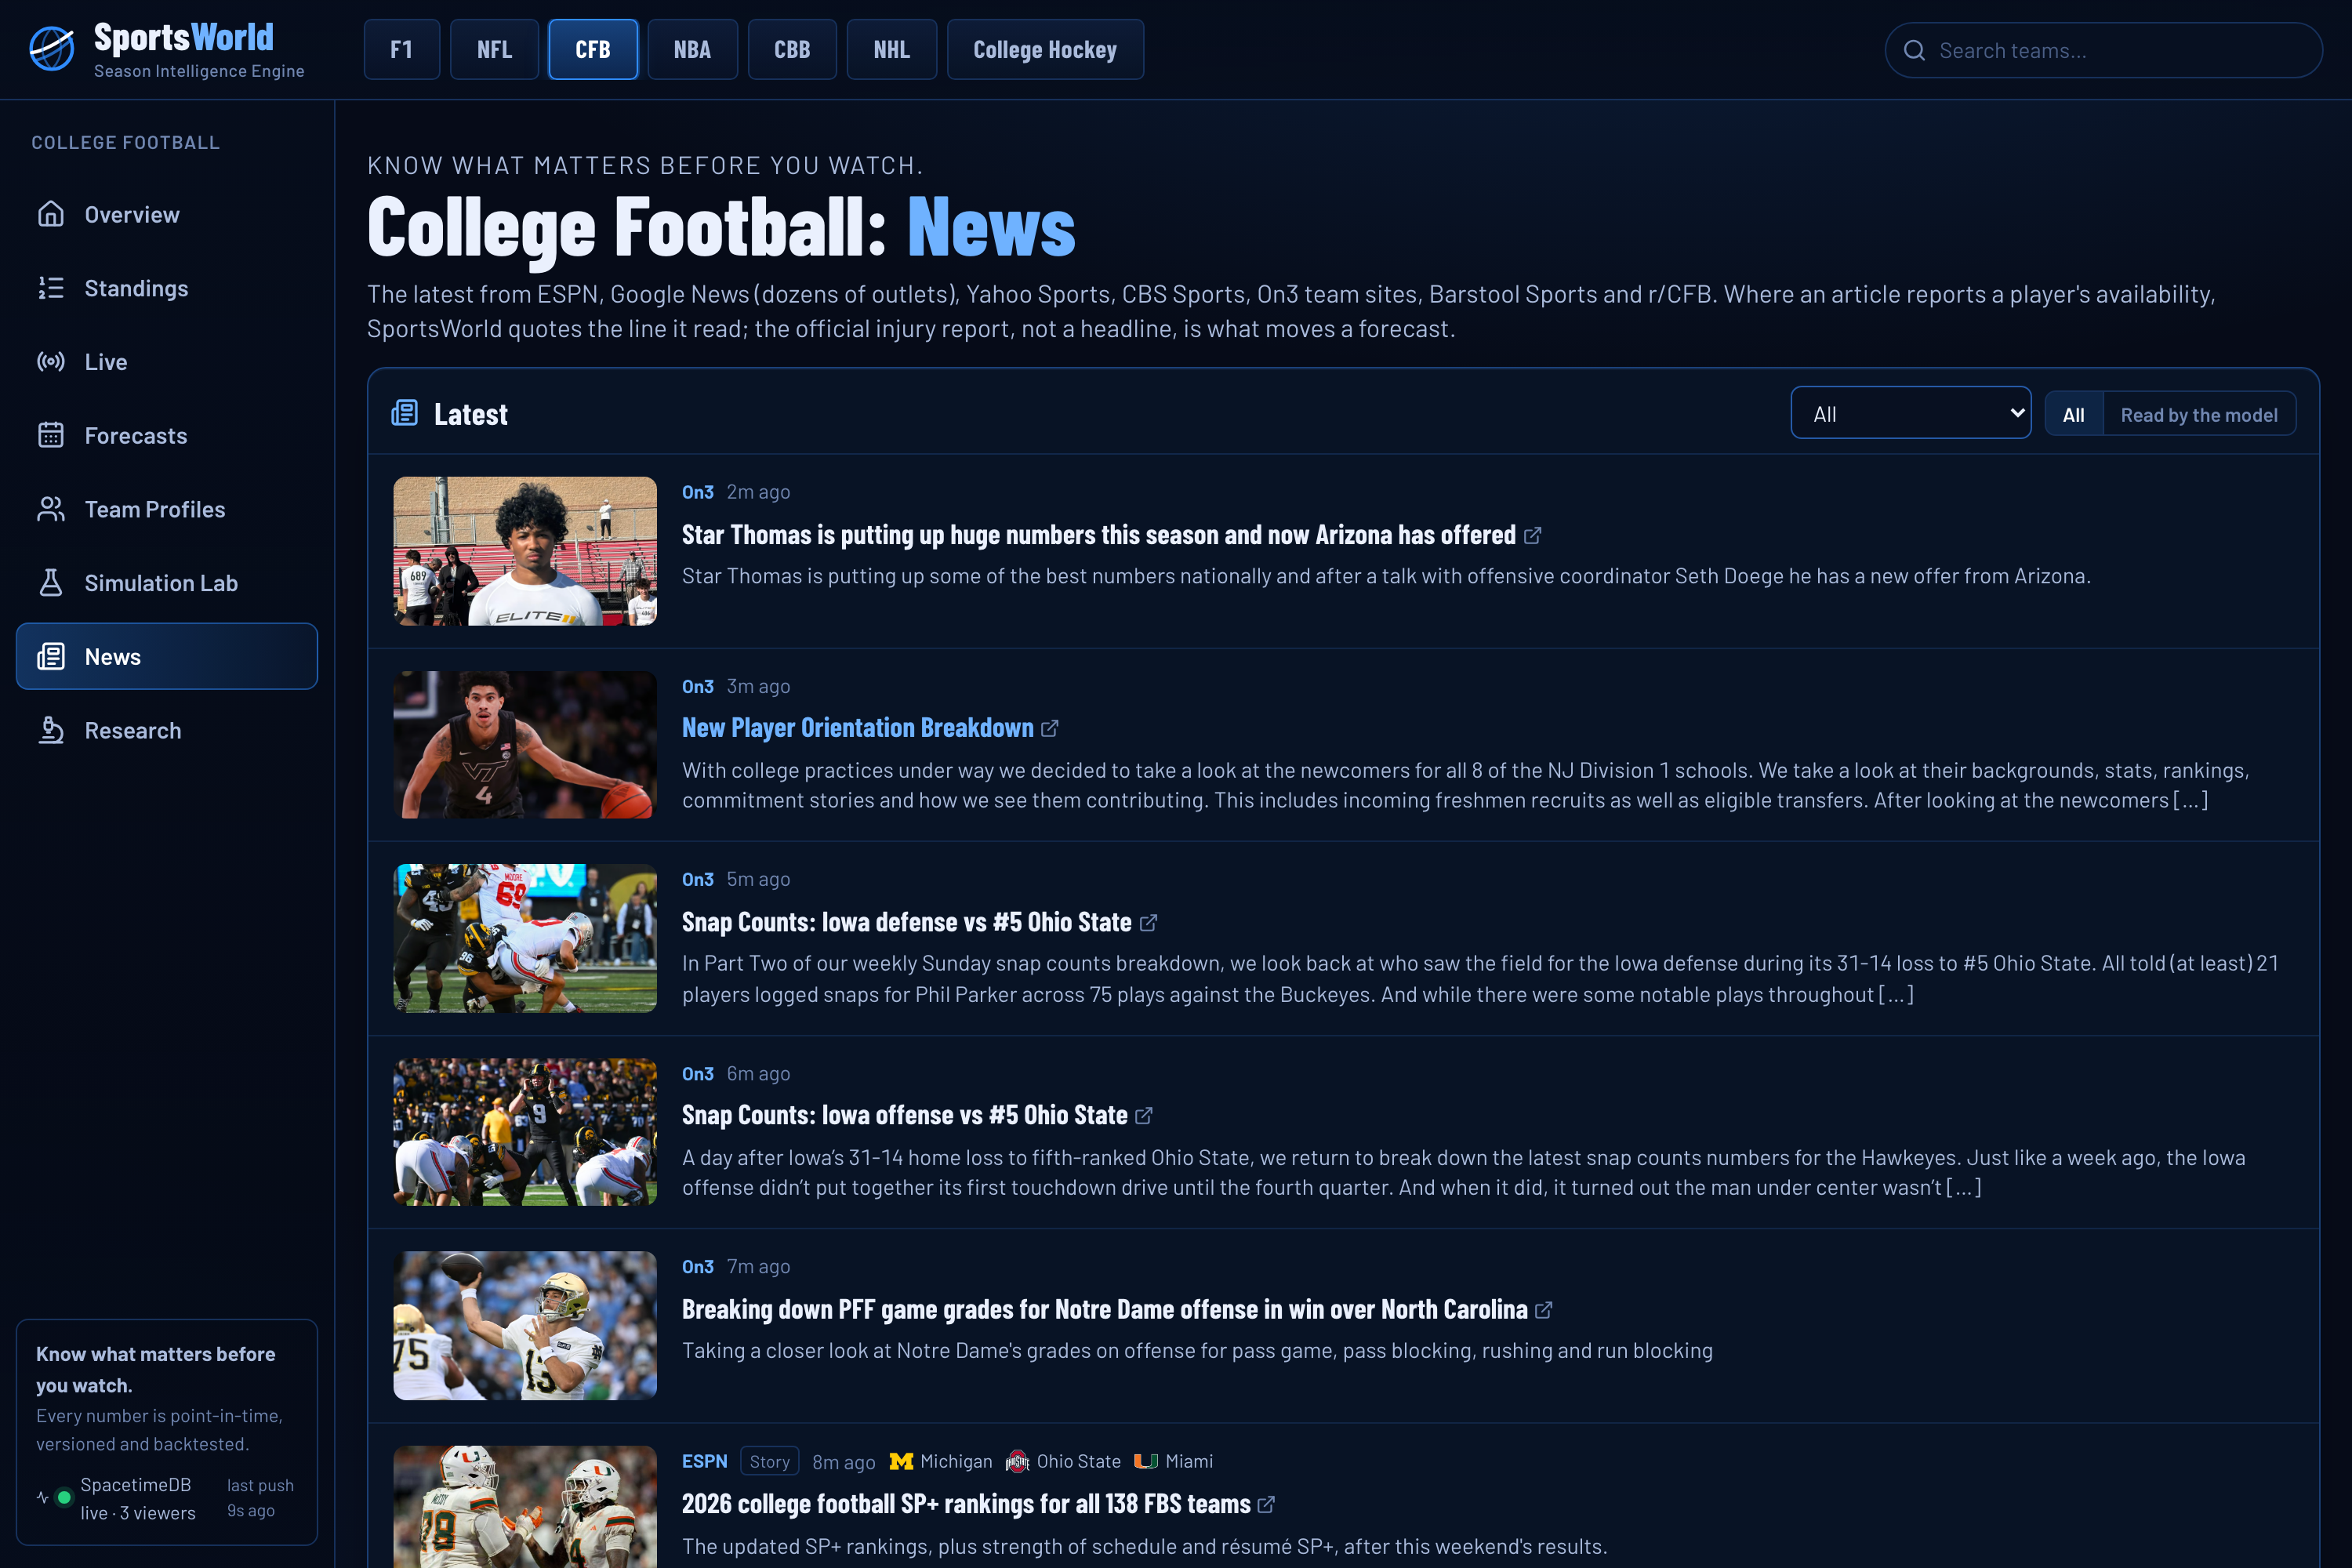
- College football has almost no public injury data. ESPN's injury feed listed three college players nationwide. We found the conferences' mandated availability reports, published as full articles on team sites, and read them with Llama under a strict rule: every claim must quote the article word for word.
- Language models want to editorialise. Llama attached a "Northwestern State" recap to Northwestern, called a 94 % game "very close", and appended "a clear favourite" to a scenario. Each became a check: ESPN's own team tags constrain entity matching, and rewrites are rejected for any number, closeness claim or verdict the engine never gave.
- Late-game football was wrong in obvious ways (down 2 at the opponent's 19 with 0:38 left showed 29 %) until expected points were conditioned on the clock (67 %).
- Live commentary missed scores because plays arrive out of order and conversions are separate plays; the scoreboard became the source of truth and the play stream resumes by sequence.
- Honest measurement is humbling. On the full Saturday slate (47 games) ESPN's model (0.452 log loss) and the market (0.439) beat us (0.497). We publish that on the product.
Accomplishments that we're proud of
- Calibration that holds up on history: across seven replayed seasons, our 90 % ranges contain the true win total 91 to 95 % of the time, versus 52 to 77 % for the standard independent-game approach.
- Point-in-time all the way down: Rewind shows what the model gave each eventual champion on each past date, rebuilt from only what it knew then (Seattle started last season at 2 % and the model climbed to 14 % by December).
- One engine for seven very different competitions, from a 12-team CFP to FIA count-back.
- Watching a score land and the whole season redraw itself in every open browser within seconds.
- An agent that does things: it runs 10,000-season counterfactuals instead of chatting about sports.
- Saying out loud where we lose. Our edge isn't a better coin flip; it's a model of the season you can trust and question.
What we learned
Uncertainty about the state matters more than precision about any single game. Most of a world model's value is in the correlations: the same latent strength drives a dozen games, and ignoring that makes every probability look sharper than it is. Model capacity only pays when the state is long and data-rich (a GRU wins on NBA possessions, neural models win in hockey once the archive is backfilled), and in football the honest answer was "logistic is tied". We also learned that most individual absences are worth less than a point, smaller than one game's noise, which is exactly why it takes thousands of games to measure them, and why a model should say "not measurable" instead of guessing.
What's next for SportsWorld
- Lineups and depth charts, the main thing the market knows that we don't, with the market as the yardstick for each new source.
- Offensive-line value from play-by-play (sacks, pressure, yards before contact), since box scores can't see linemen.
- Conditioning simulations on postseasons already in progress, and exact tiebreaks for every league.
- Alerts when a game you care about swings your team's odds, and a public API for the season world.
Built With
- .tech
- agentverse
- cloudflare
- elevenlabs
- espn
- google-news
- llama
- neon
- numpy
- openf1
- postgresql
- python
- pytorch
- spacetimedb
- typescript
- vllm

Log in or sign up for Devpost to join the conversation.