Inspiration
Cricket decisions often depend on knowing which bowlers are most effective in different parts of a T20 innings. We wanted to make historical ball-by-ball data easier to use for planning bowling rotations.
What it does
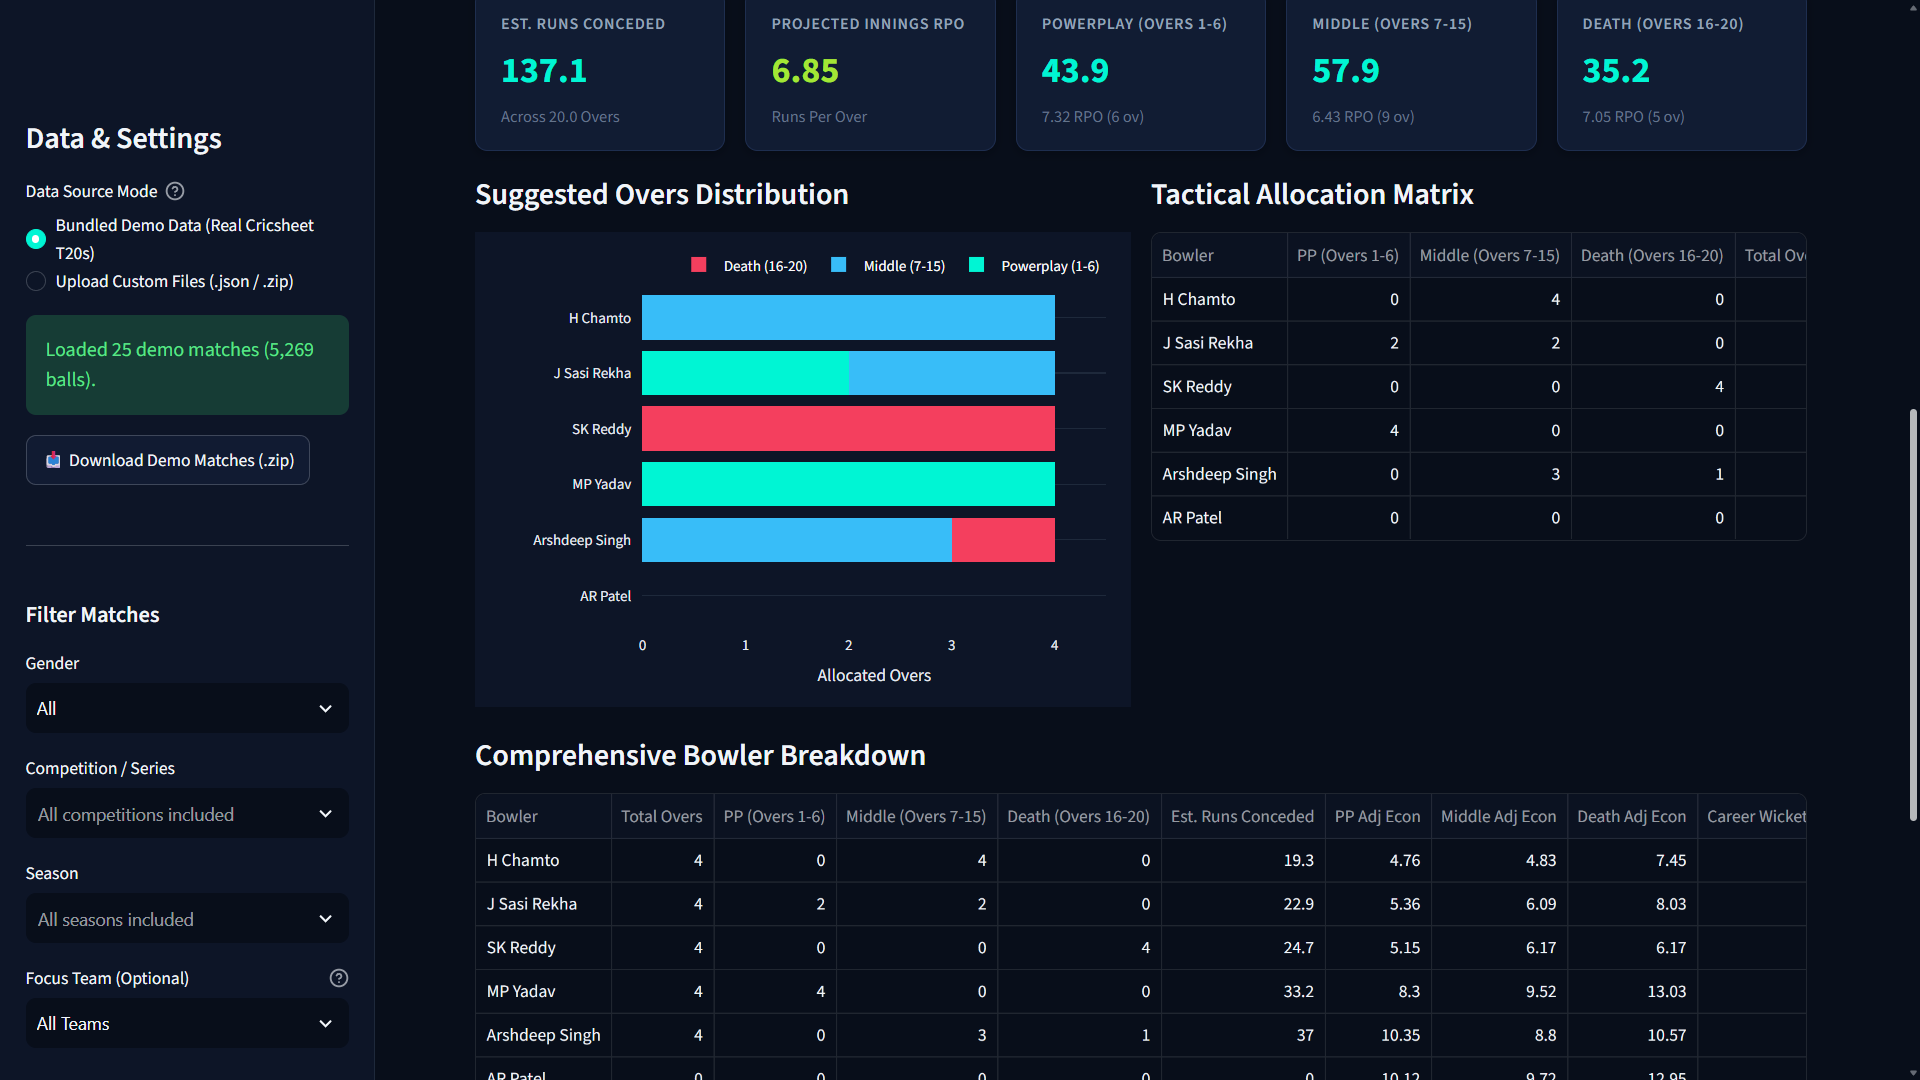
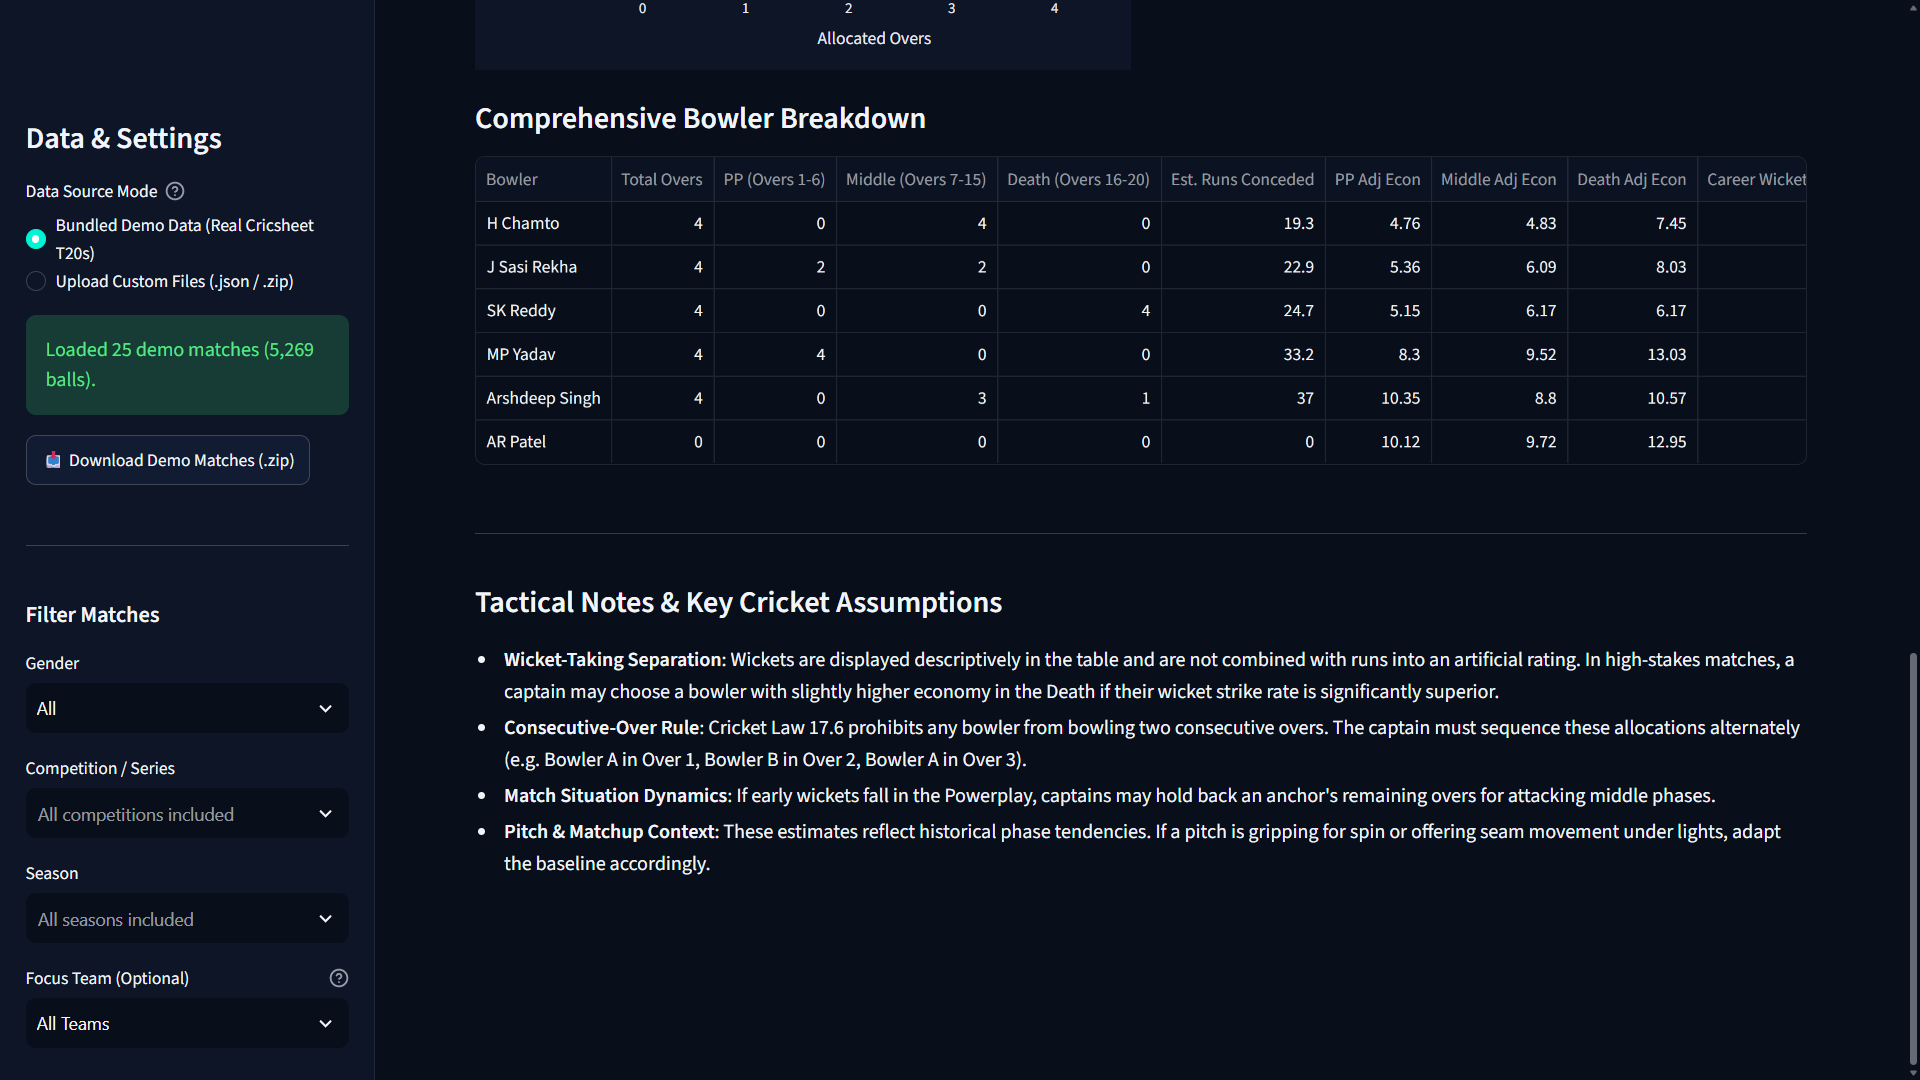
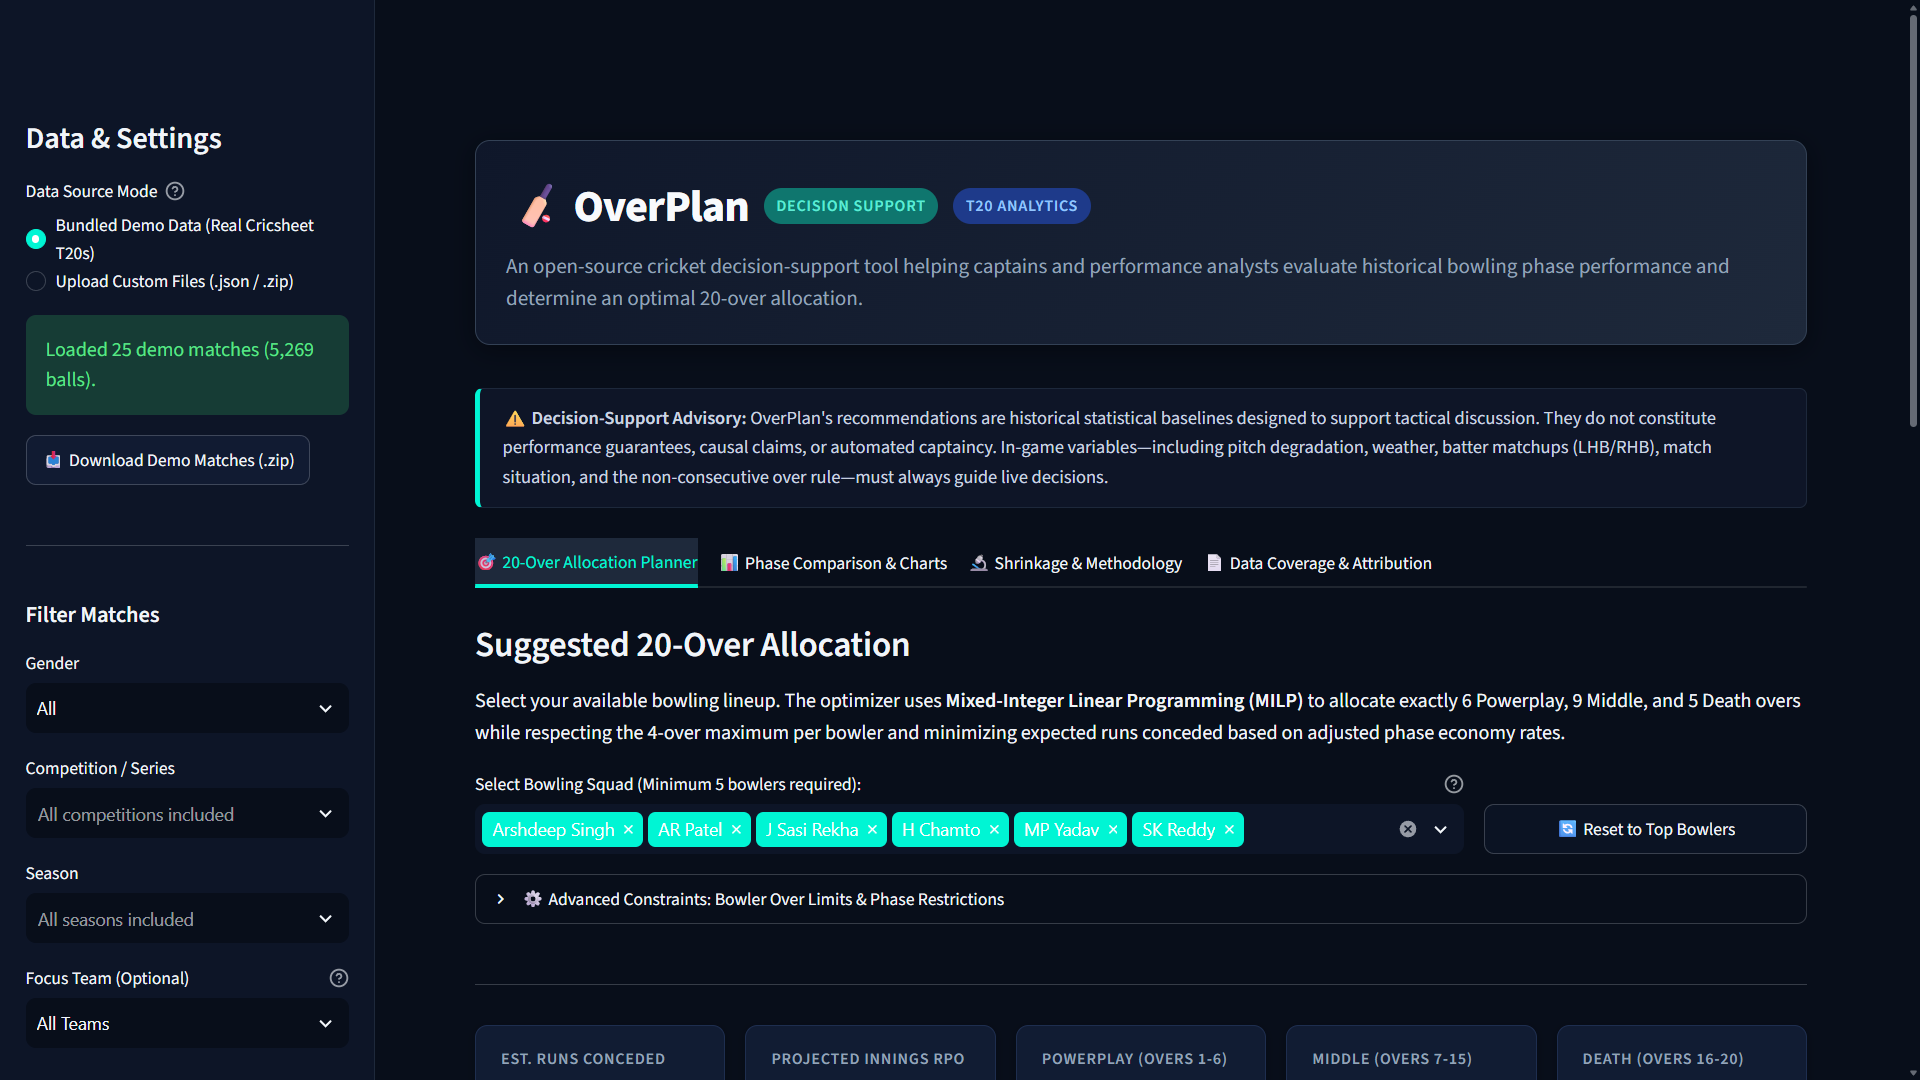
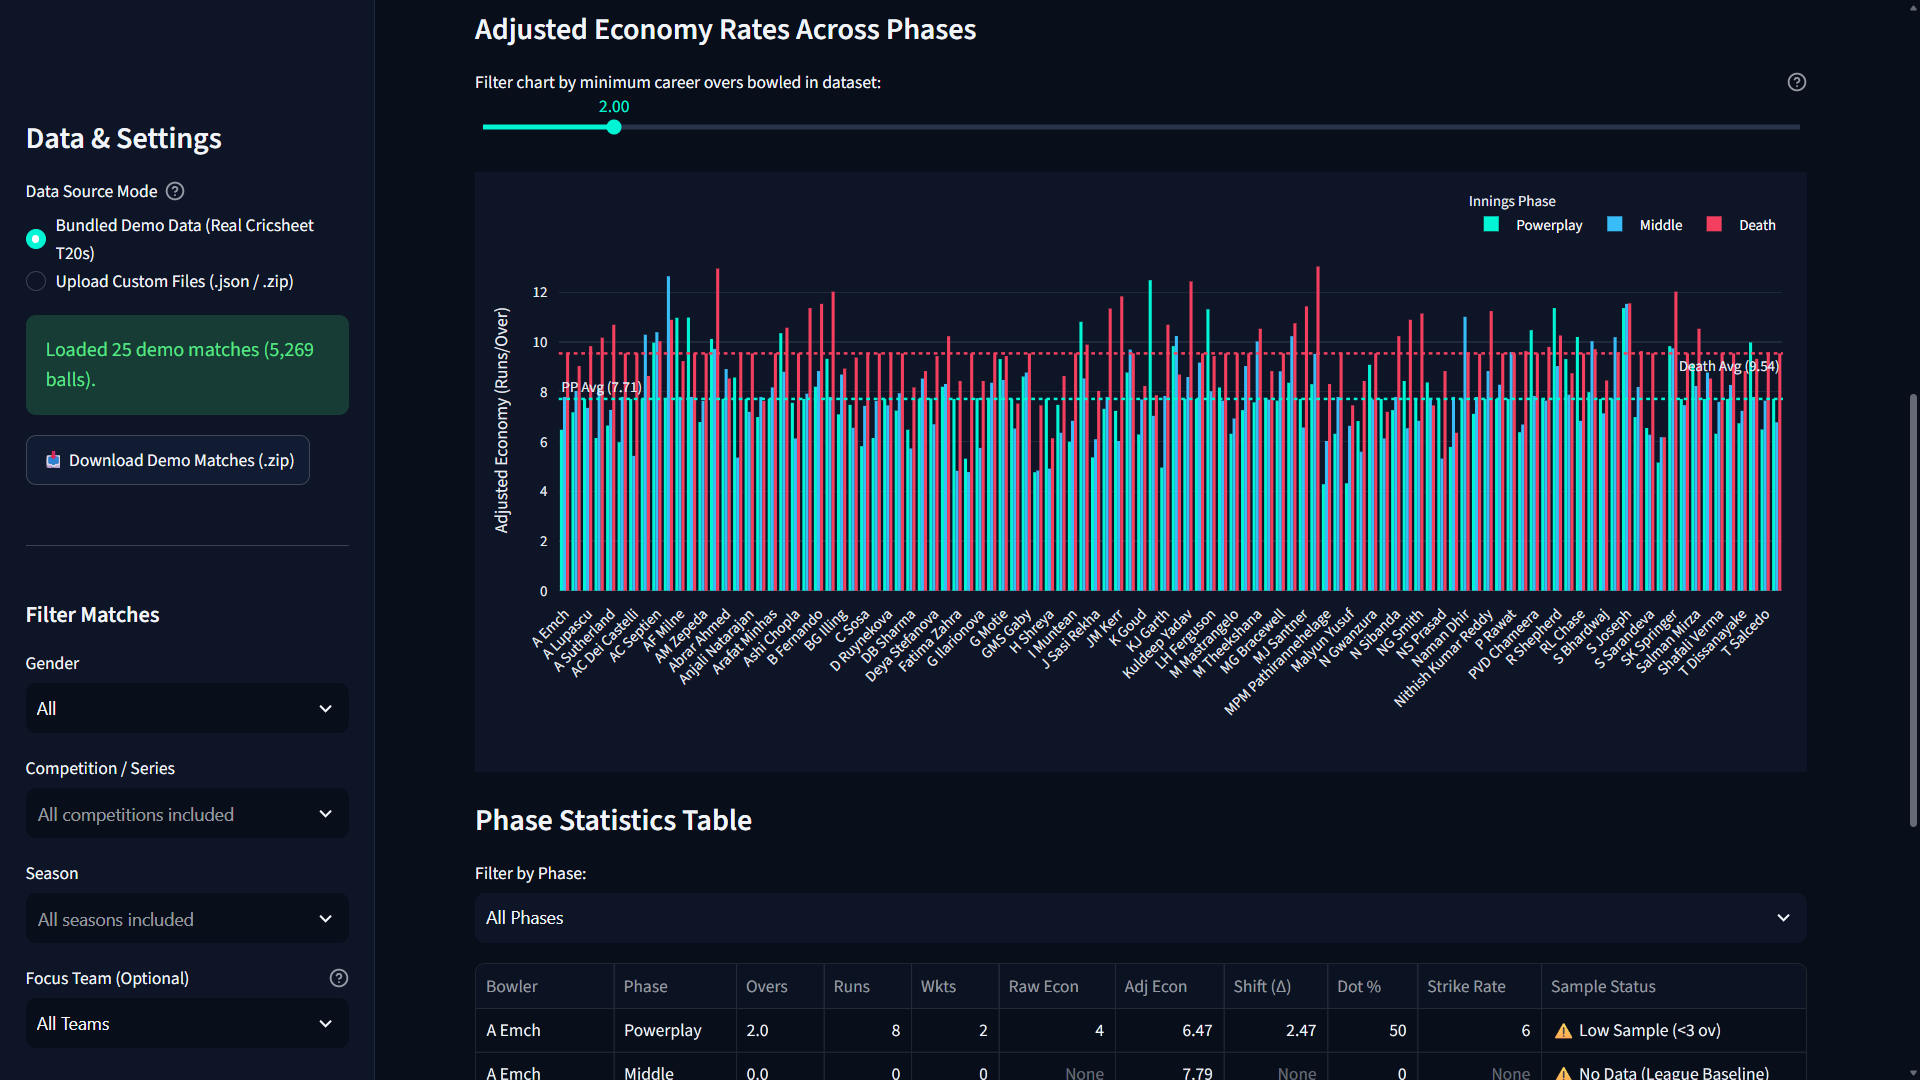
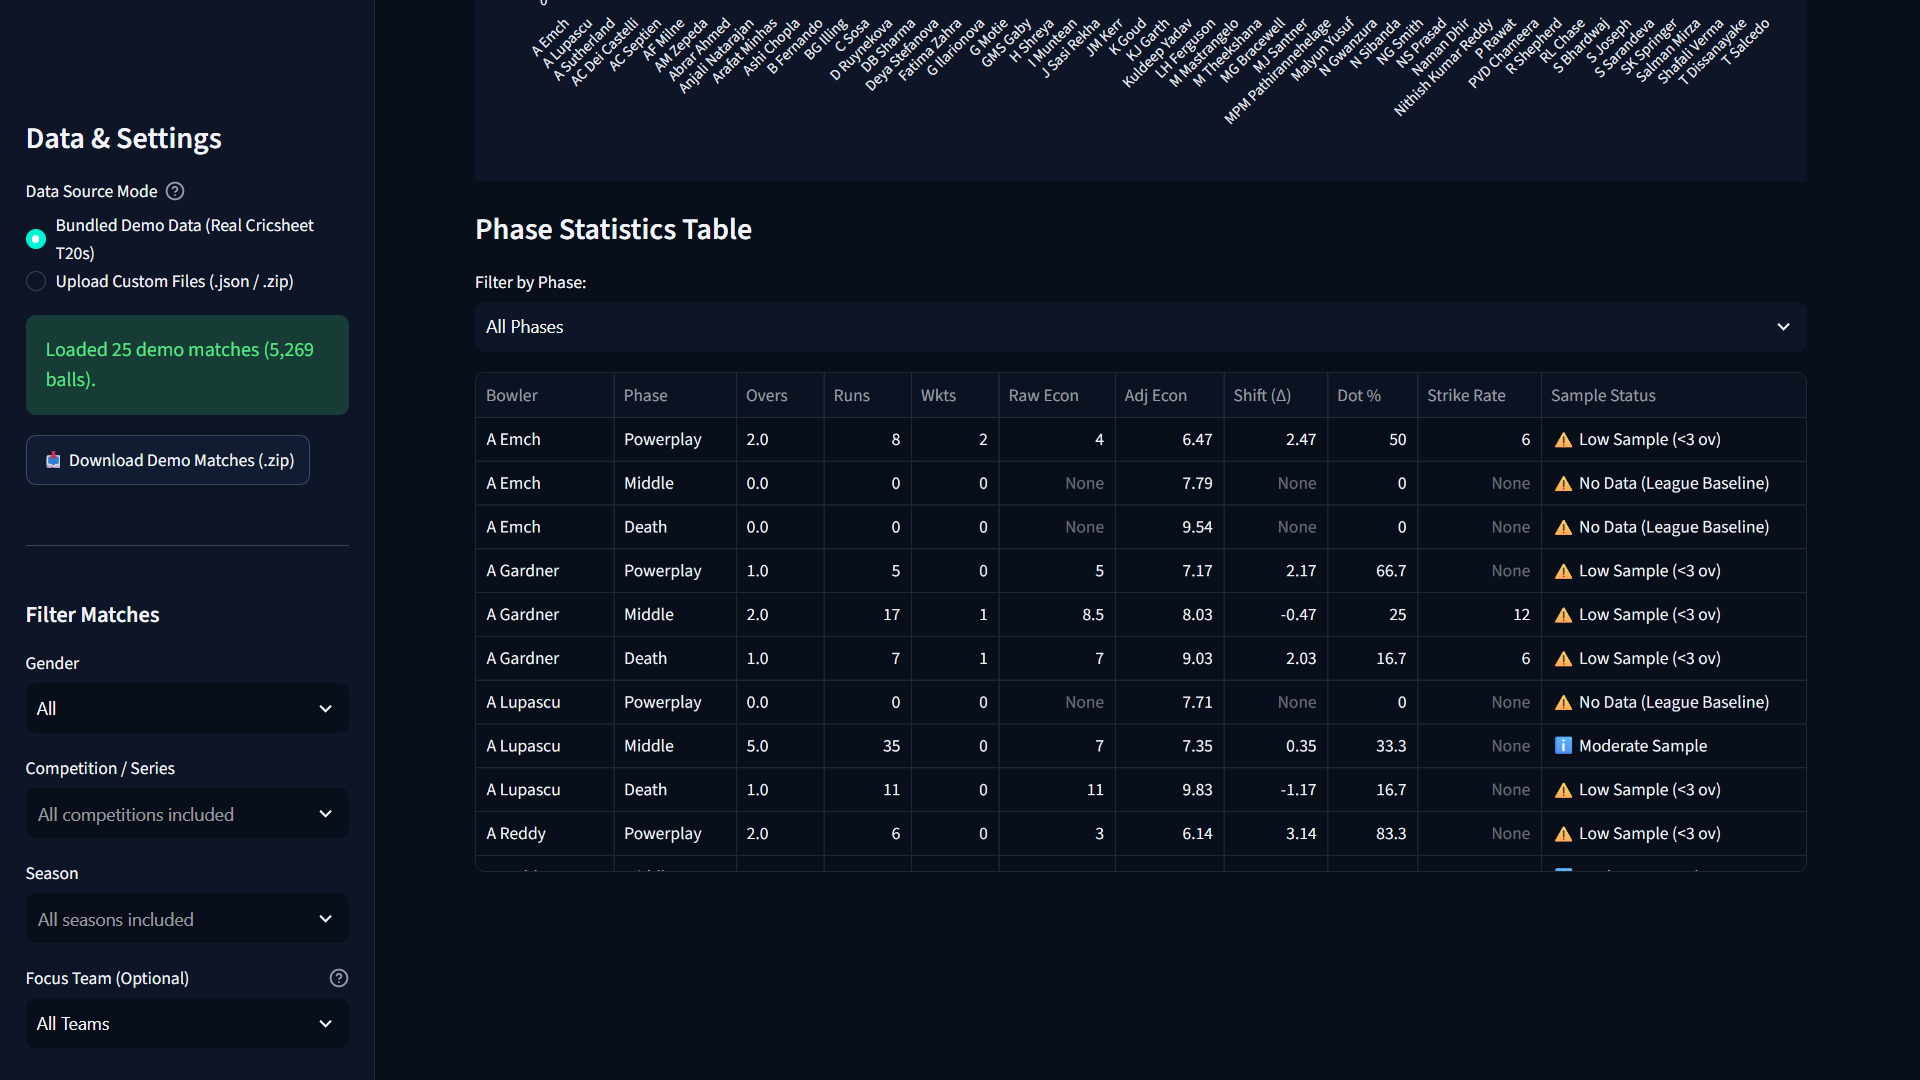
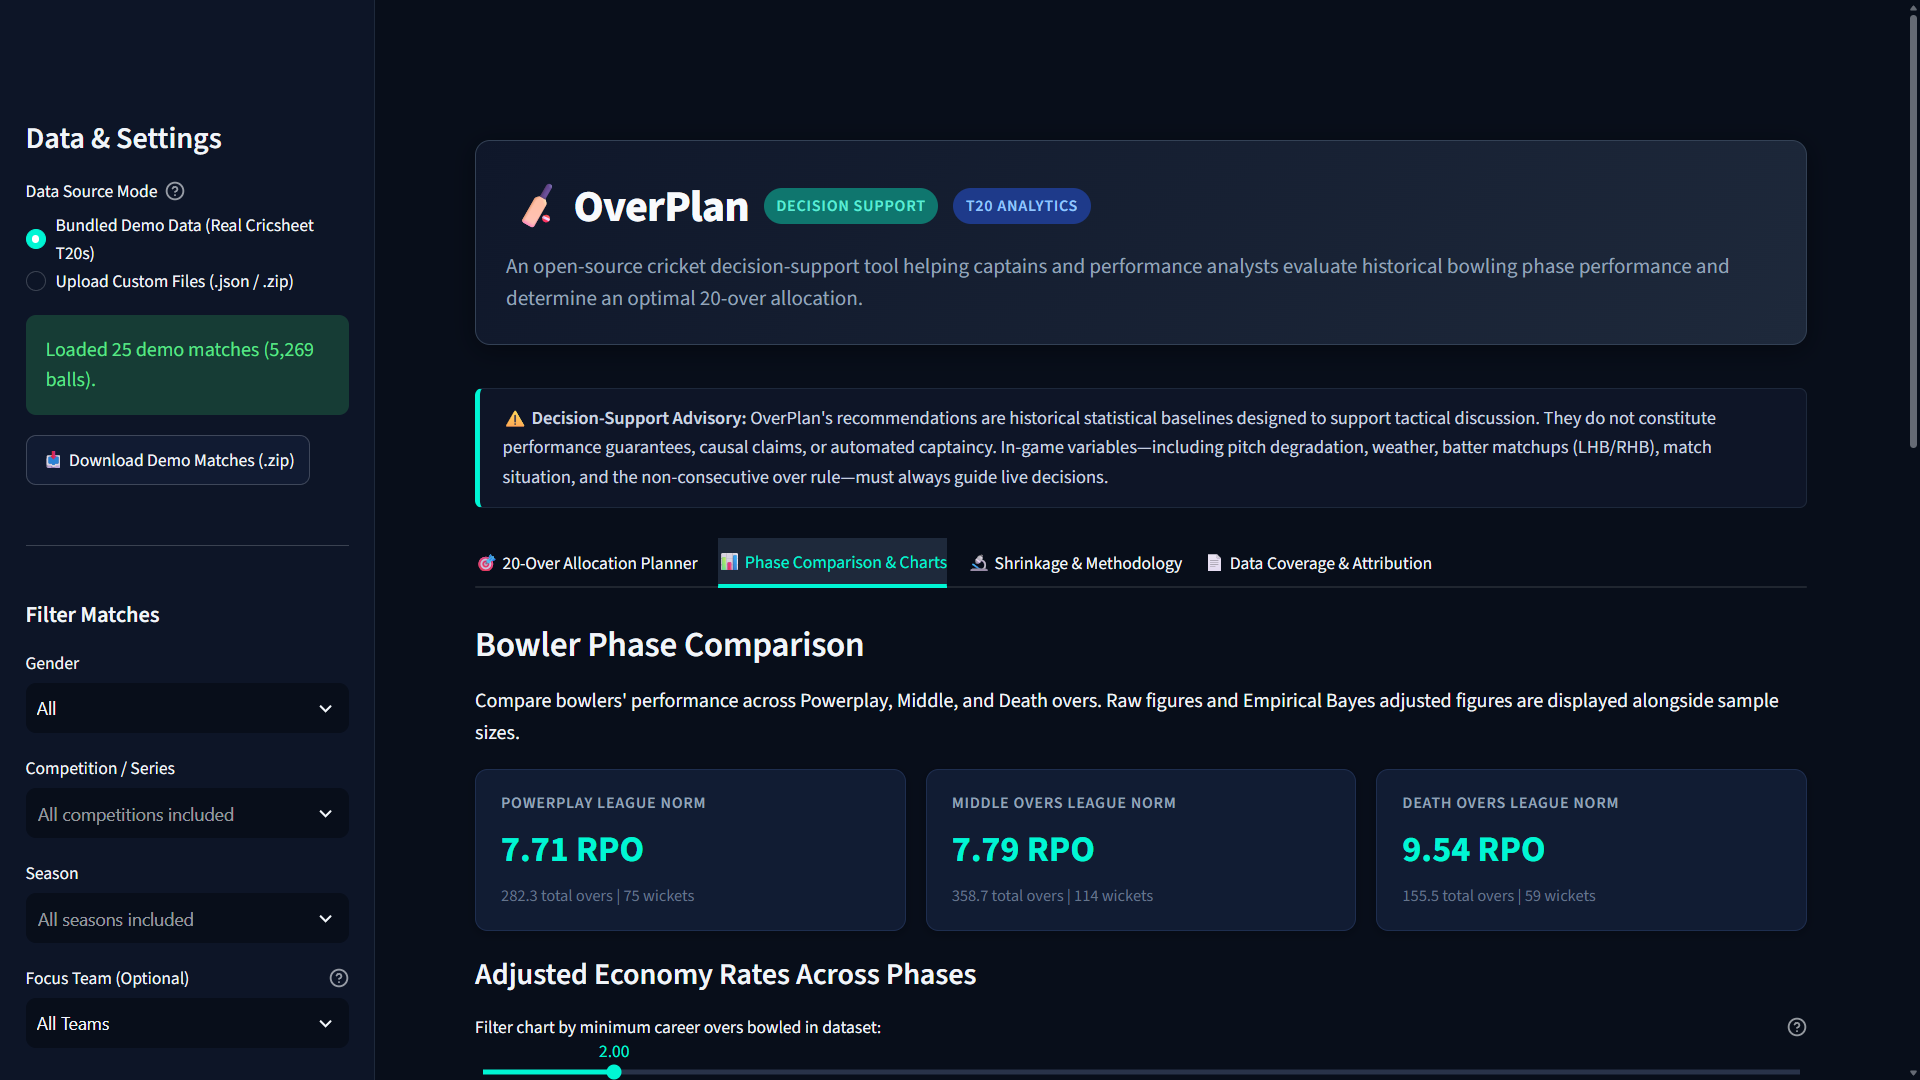
OverPlan compares bowlers’ performance in the powerplay, middle overs, and death overs. It displays economy rates, wickets, and sample sizes, then suggests how to allocate 20 overs across a selected bowling roster. The recommendation is based on historical results and is presented as a guide, not a guarantee.
How we built it
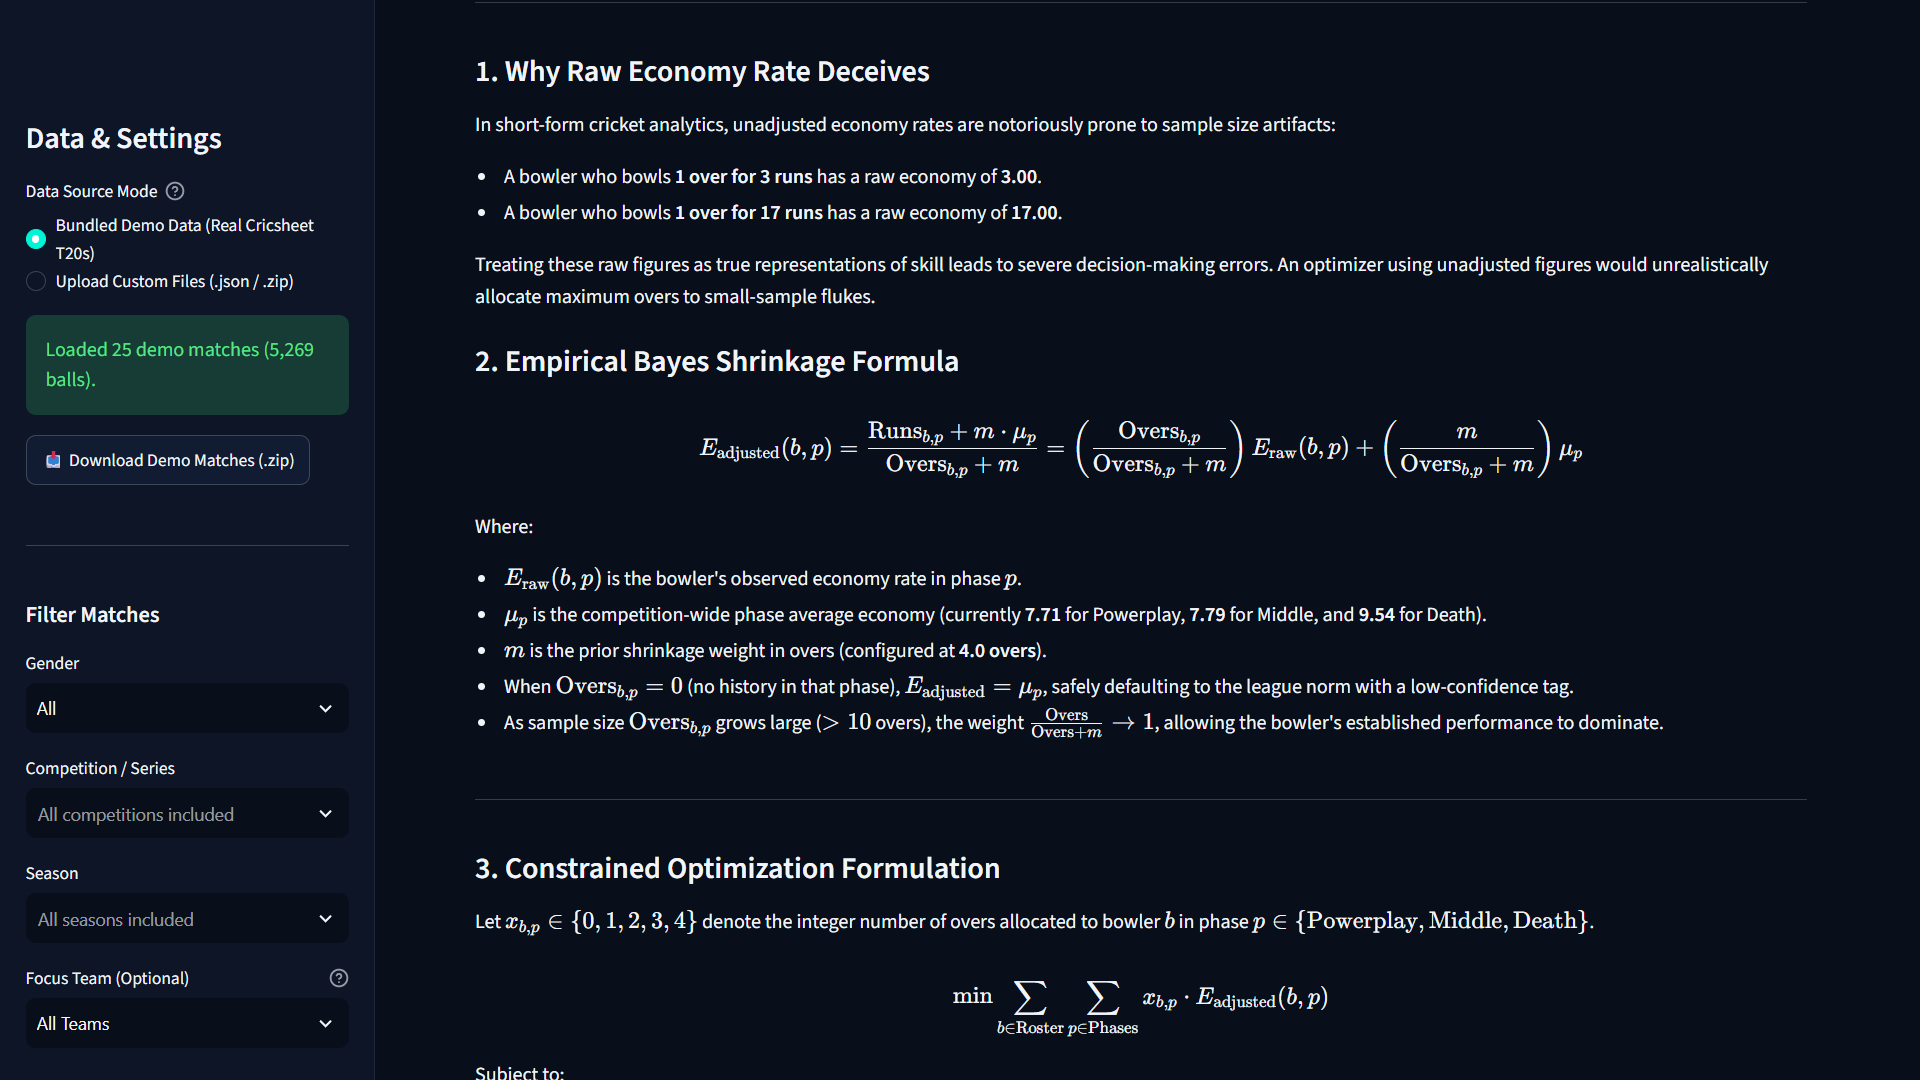
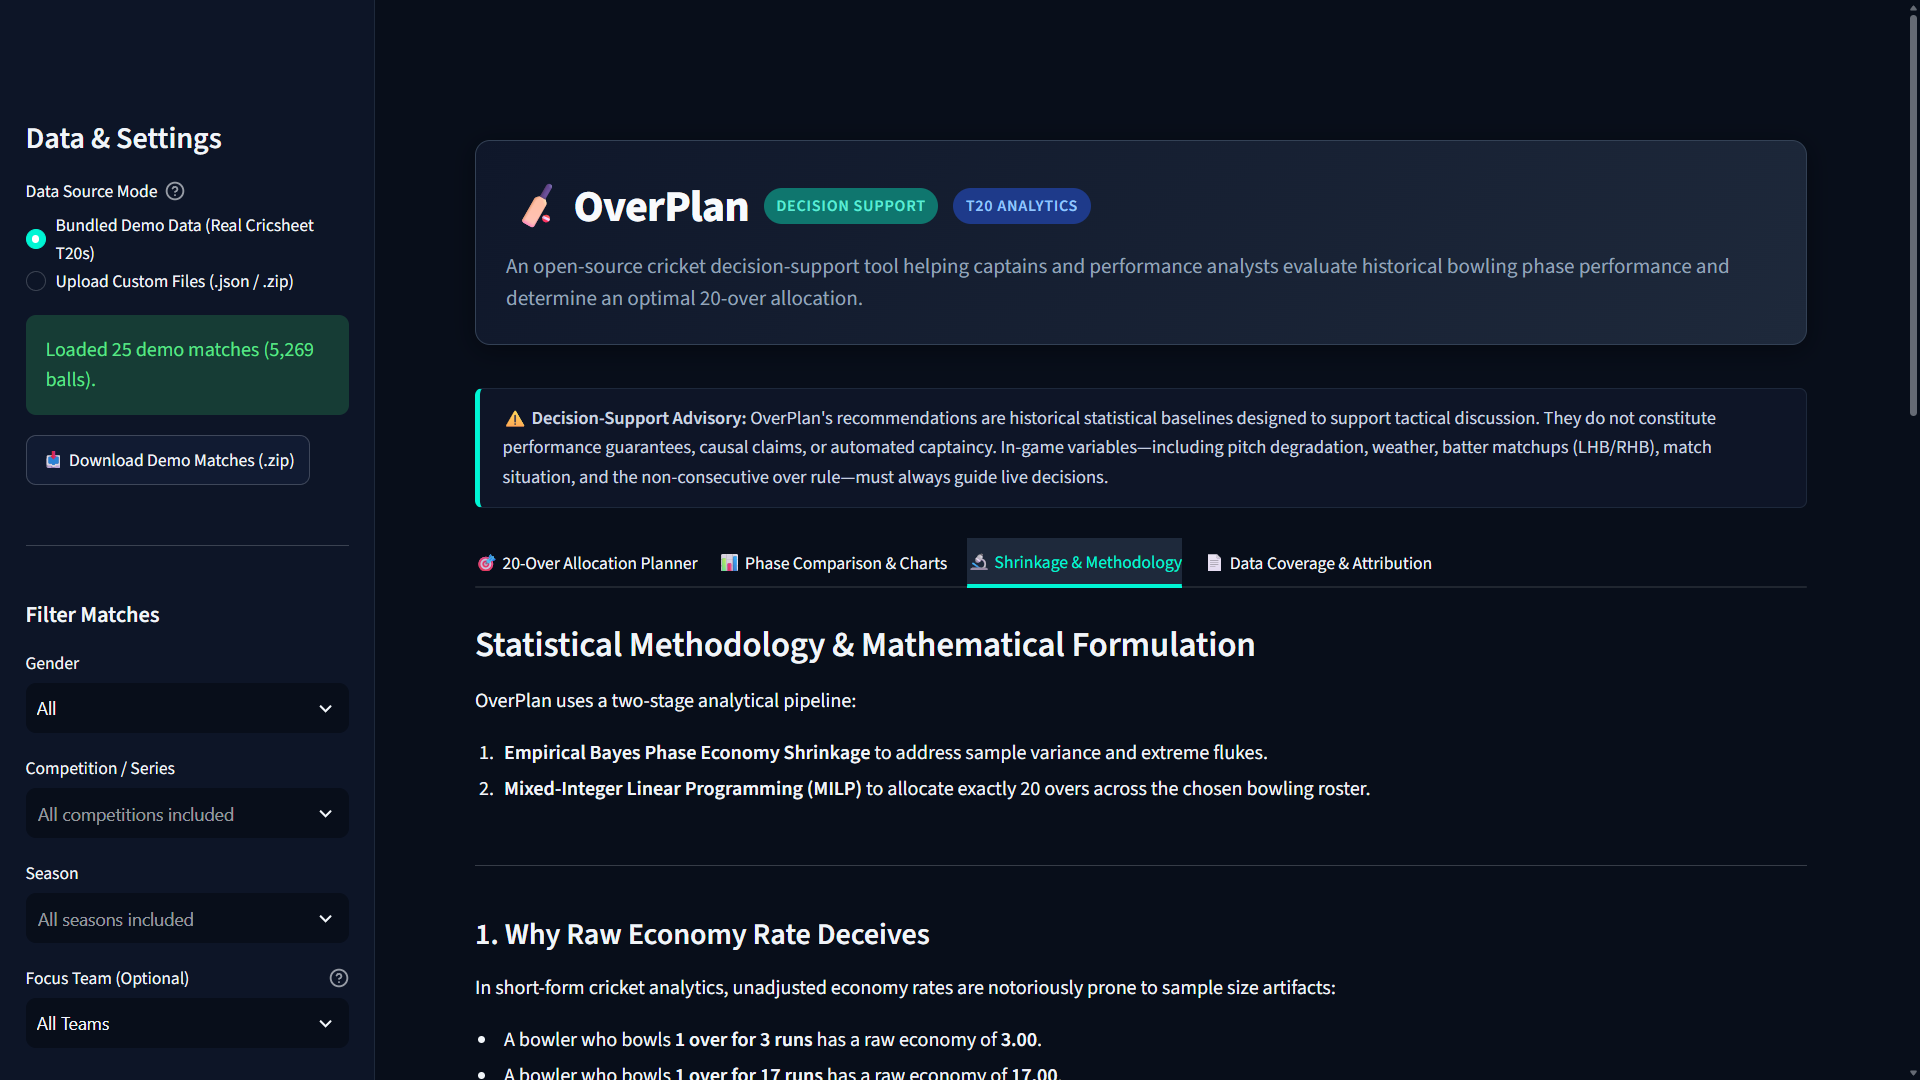
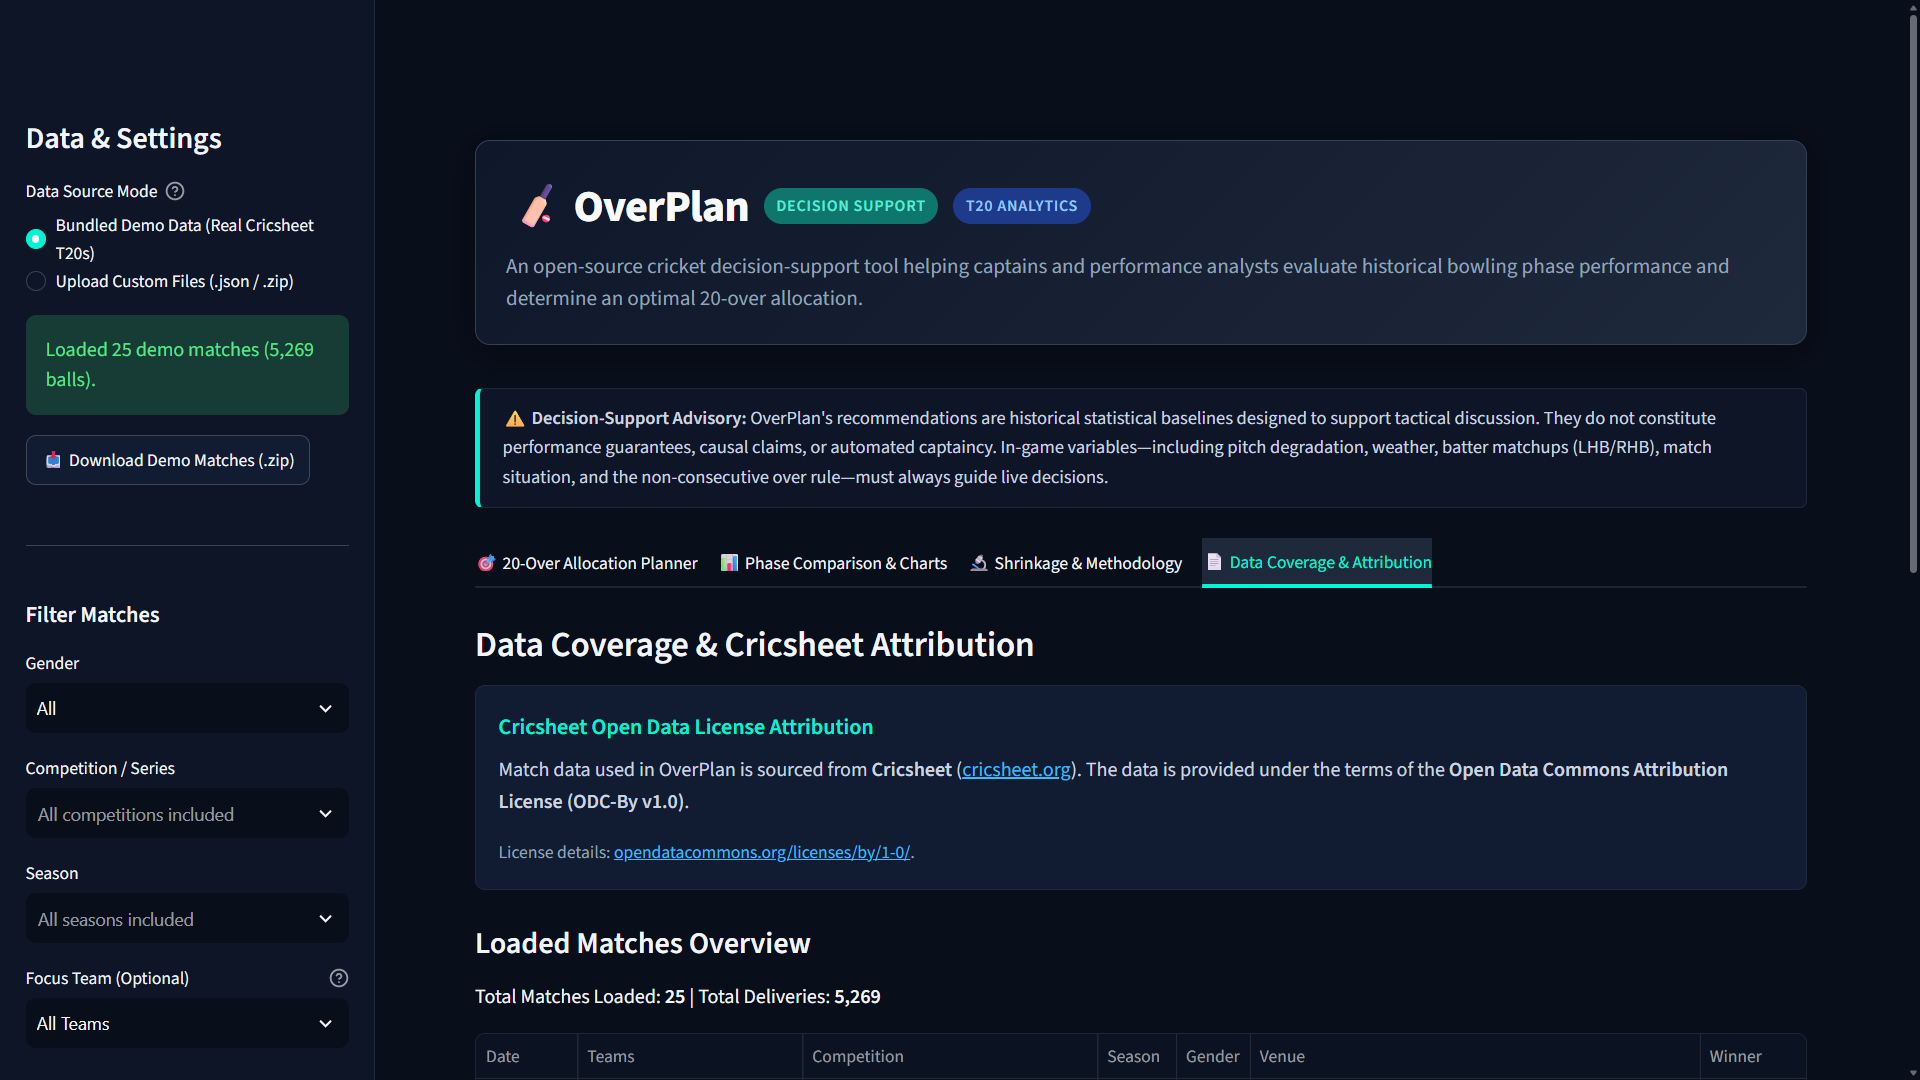
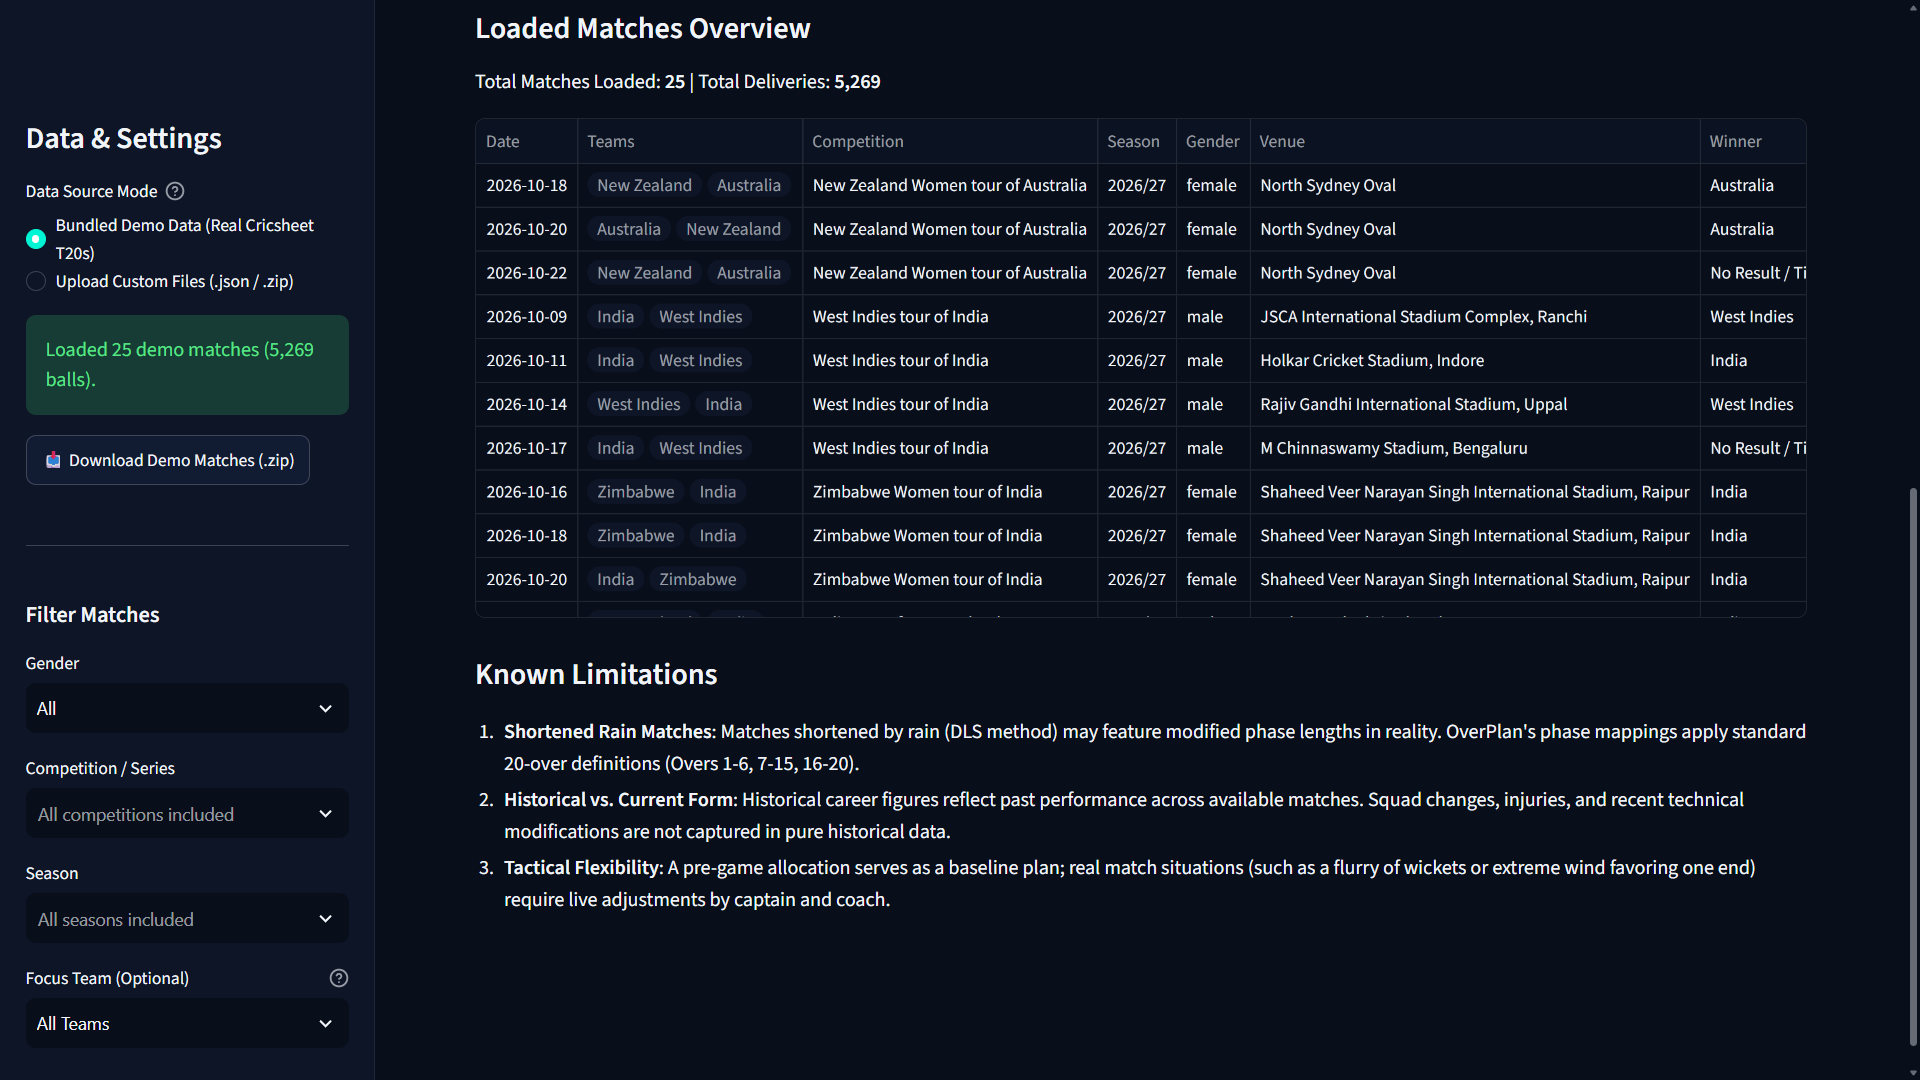
We built a web app using Python and Streamlit. It reads Cricsheet match data, calculates phase-level bowling statistics, and displays comparisons and a suggested over allocation. We adjusted estimates toward phase averages when a bowler had limited data, and included warnings so users can see when a recommendation has low confidence.
Challenges we ran into
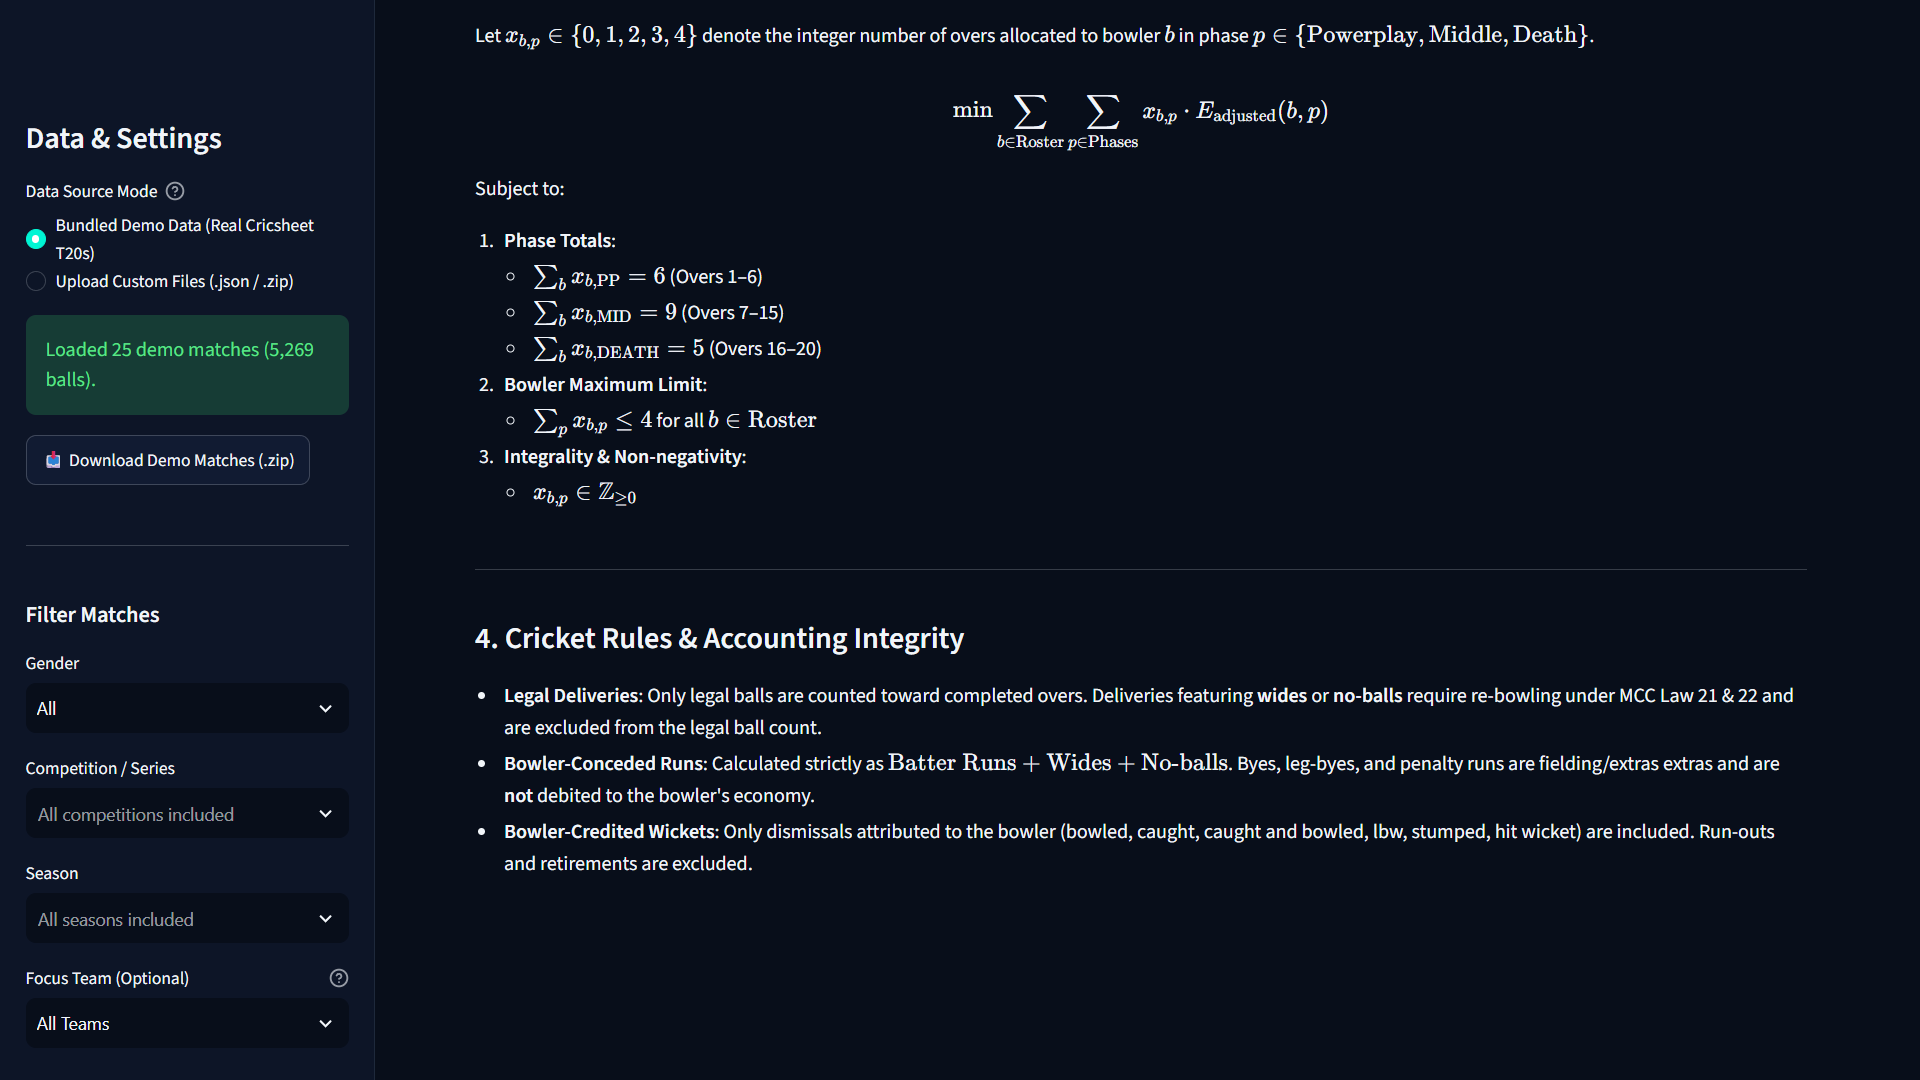
Cricket data needs careful interpretation: wides and no-balls affect a bowler’s runs conceded, while byes and leg-byes do not. We also had to account for differences in sample size so a few overs would not dominate a bowler’s comparison.
Accomplishments that we're proud of
We turned detailed ball-by-ball records into a tool focused on a clear coaching decision. OverPlan shows how each recommendation was formed, including the relevant phase statistics and sample sizes.
What we learned
We learned that useful sports analytics depends on more than producing a ranking. Data definitions, sample sizes, and clear explanations matter when turning historical results into practical guidance.
What's next for overplan
We’d like to add more competition filters, compare bowling plans against specific opponents, and include additional context such as venue and match conditions. We would also evaluate the recommendations on held-out historical matches before relying on them for more advanced planning.

Log in or sign up for Devpost to join the conversation.