Inspiration Cricket isn't just a sport; it’s a religion governed by numbers. Every ball bowled and every run scored generates a massive trail of data. We realized that while standard sports apps offer basic scorecards, they rarely dive deep enough to satisfy the hunger of modern cricket fans, analysts, and fantasy players. We wanted to build a centralized, immersive "control room" that goes beyond surface-level statistics to decode the patterns behind the game.
What it does Innings X is a comprehensive, live-style IPL analytics hub featuring:
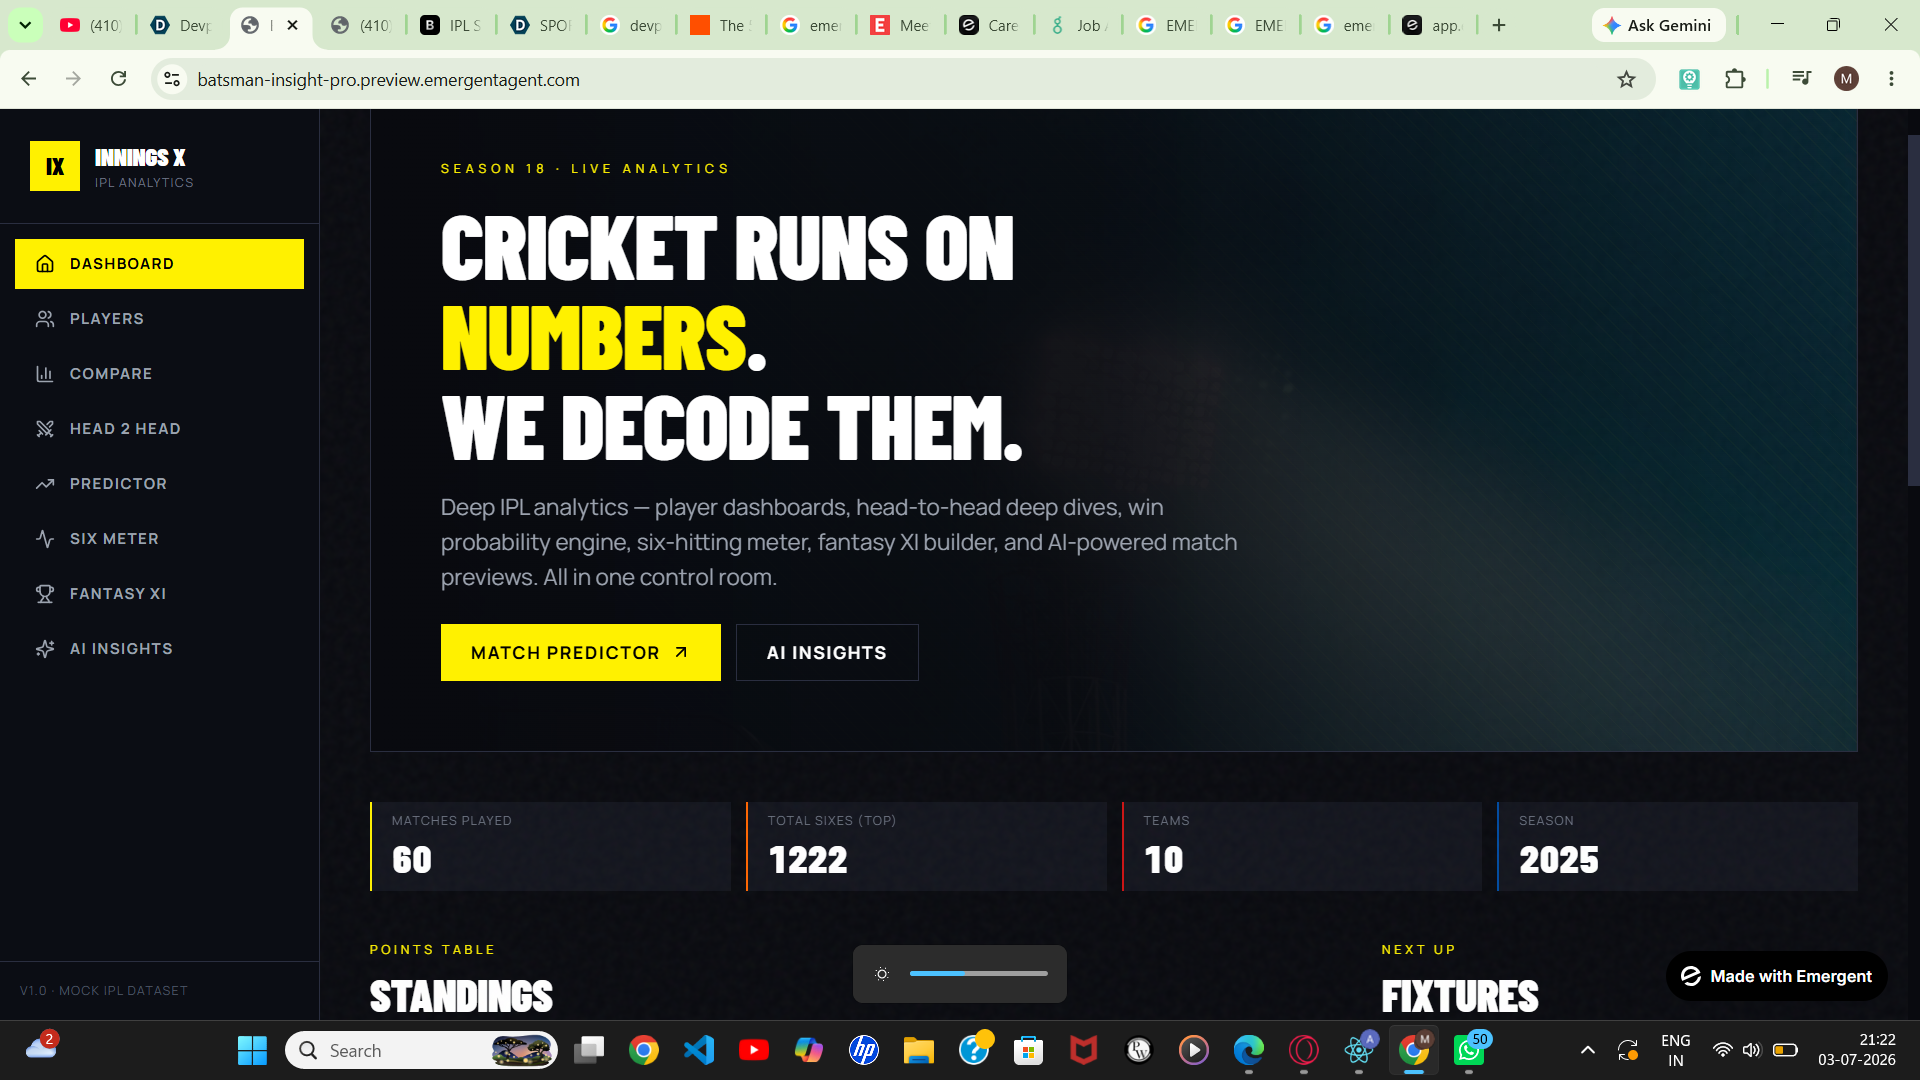
Live Standings & Fixtures: A clean, automated leaderboard tracking teams, points, and Net Run Rate (NRR).
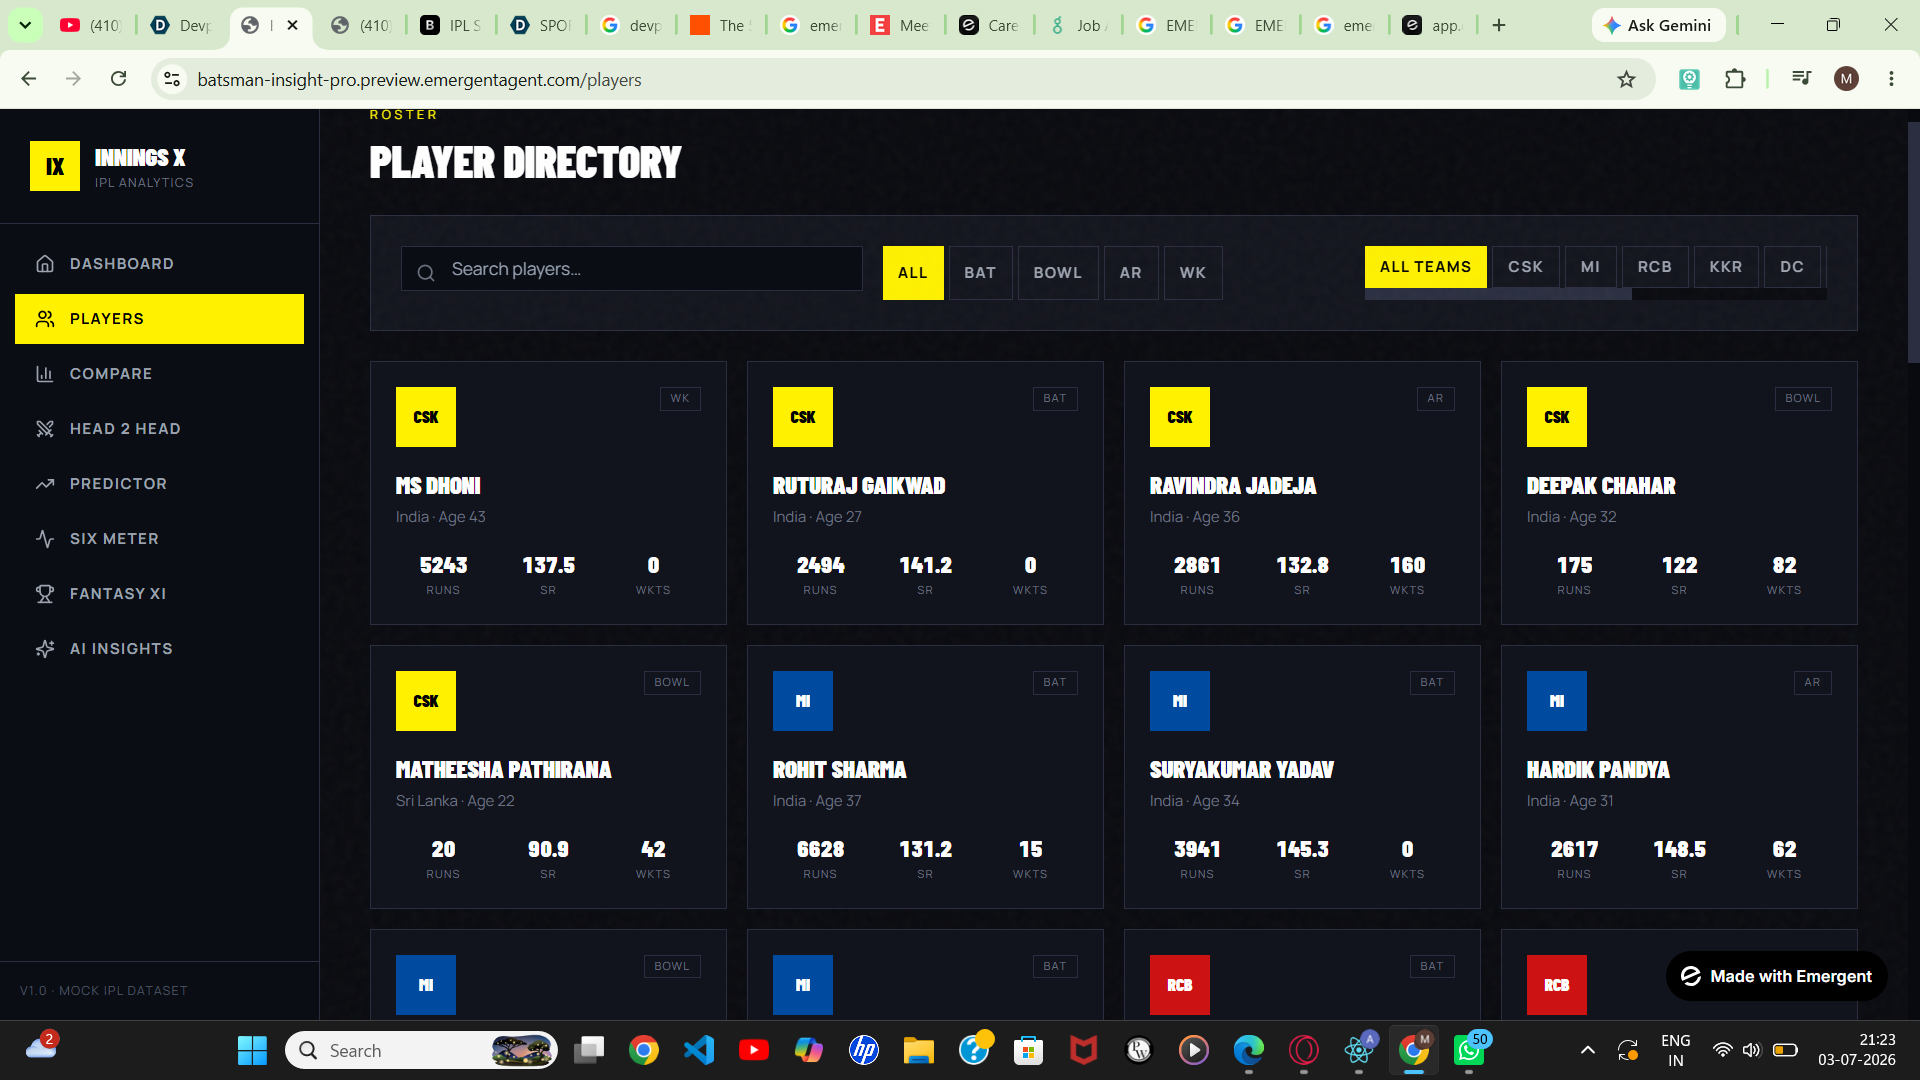
Leaderboards: Instant access to top performers across crucial metrics (Most Runs, Best Strike Rate, Most Sixes, and Most Wickets).
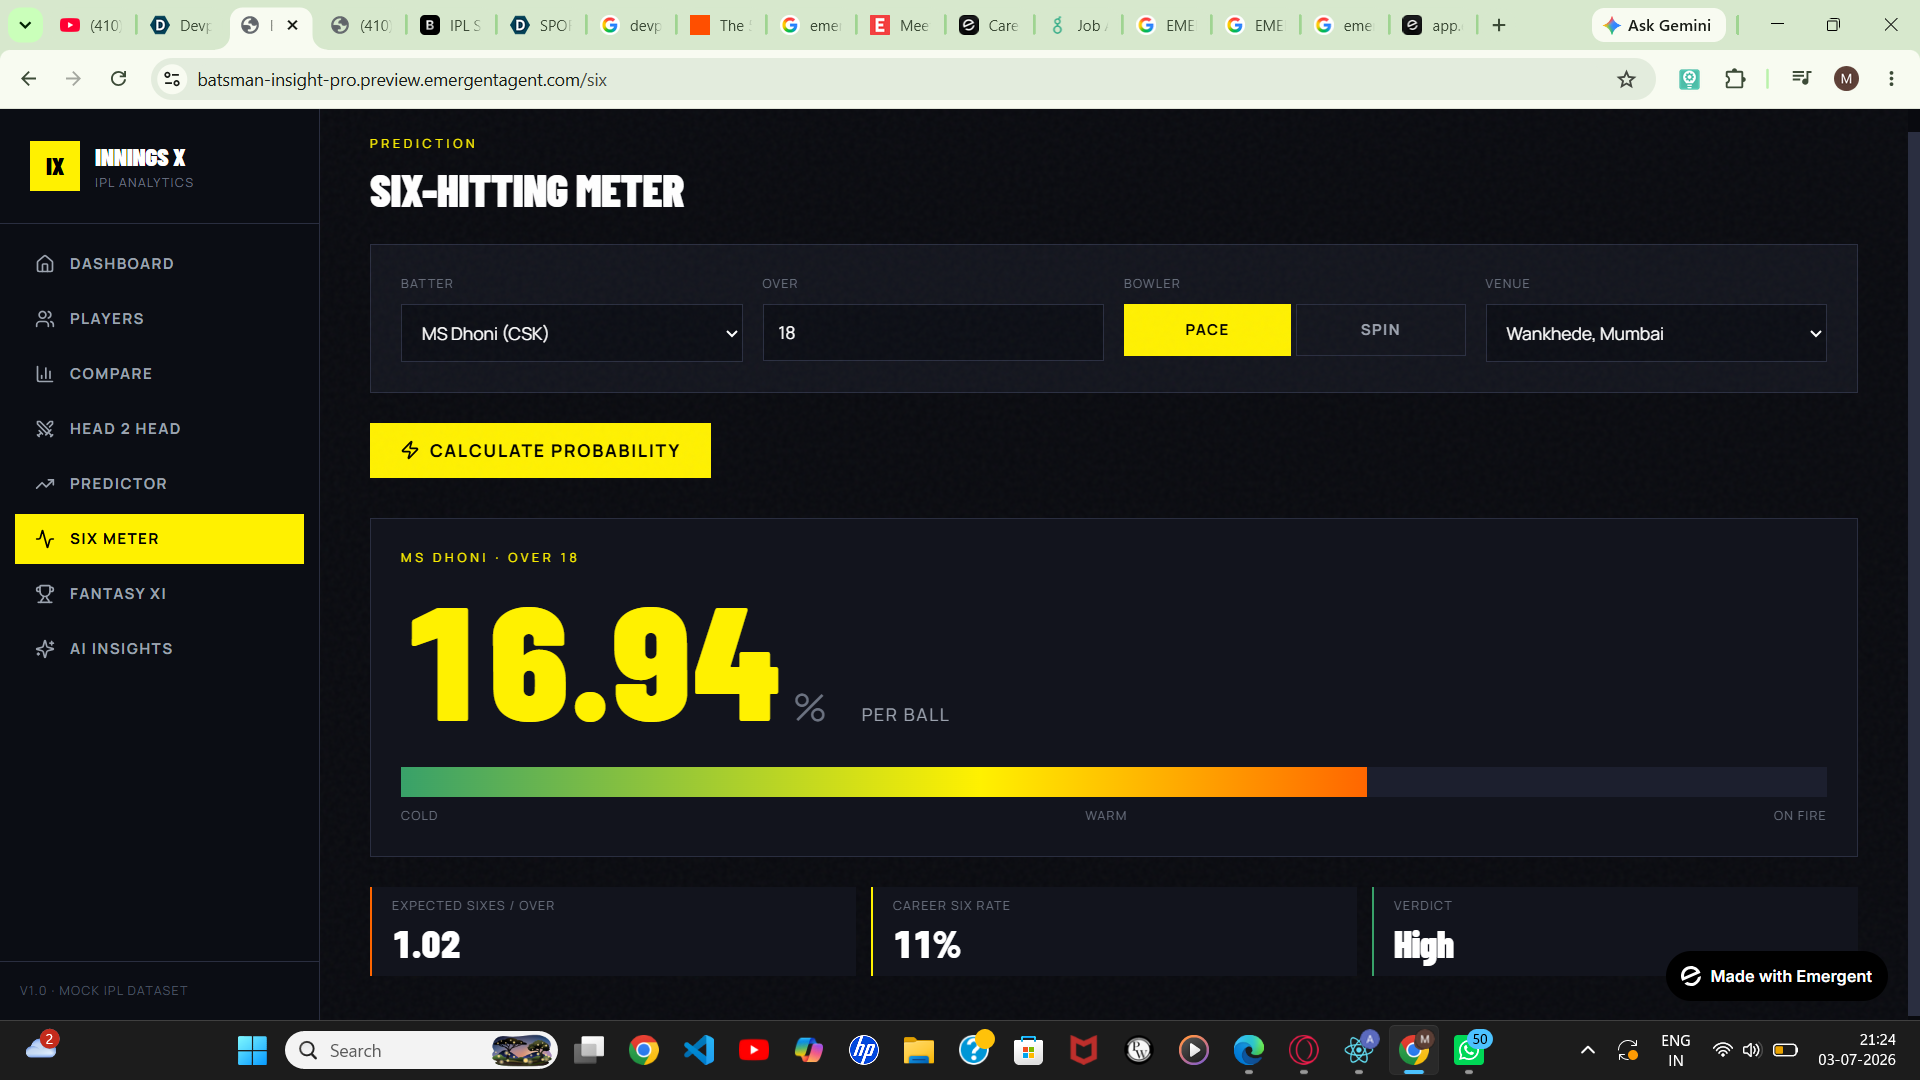
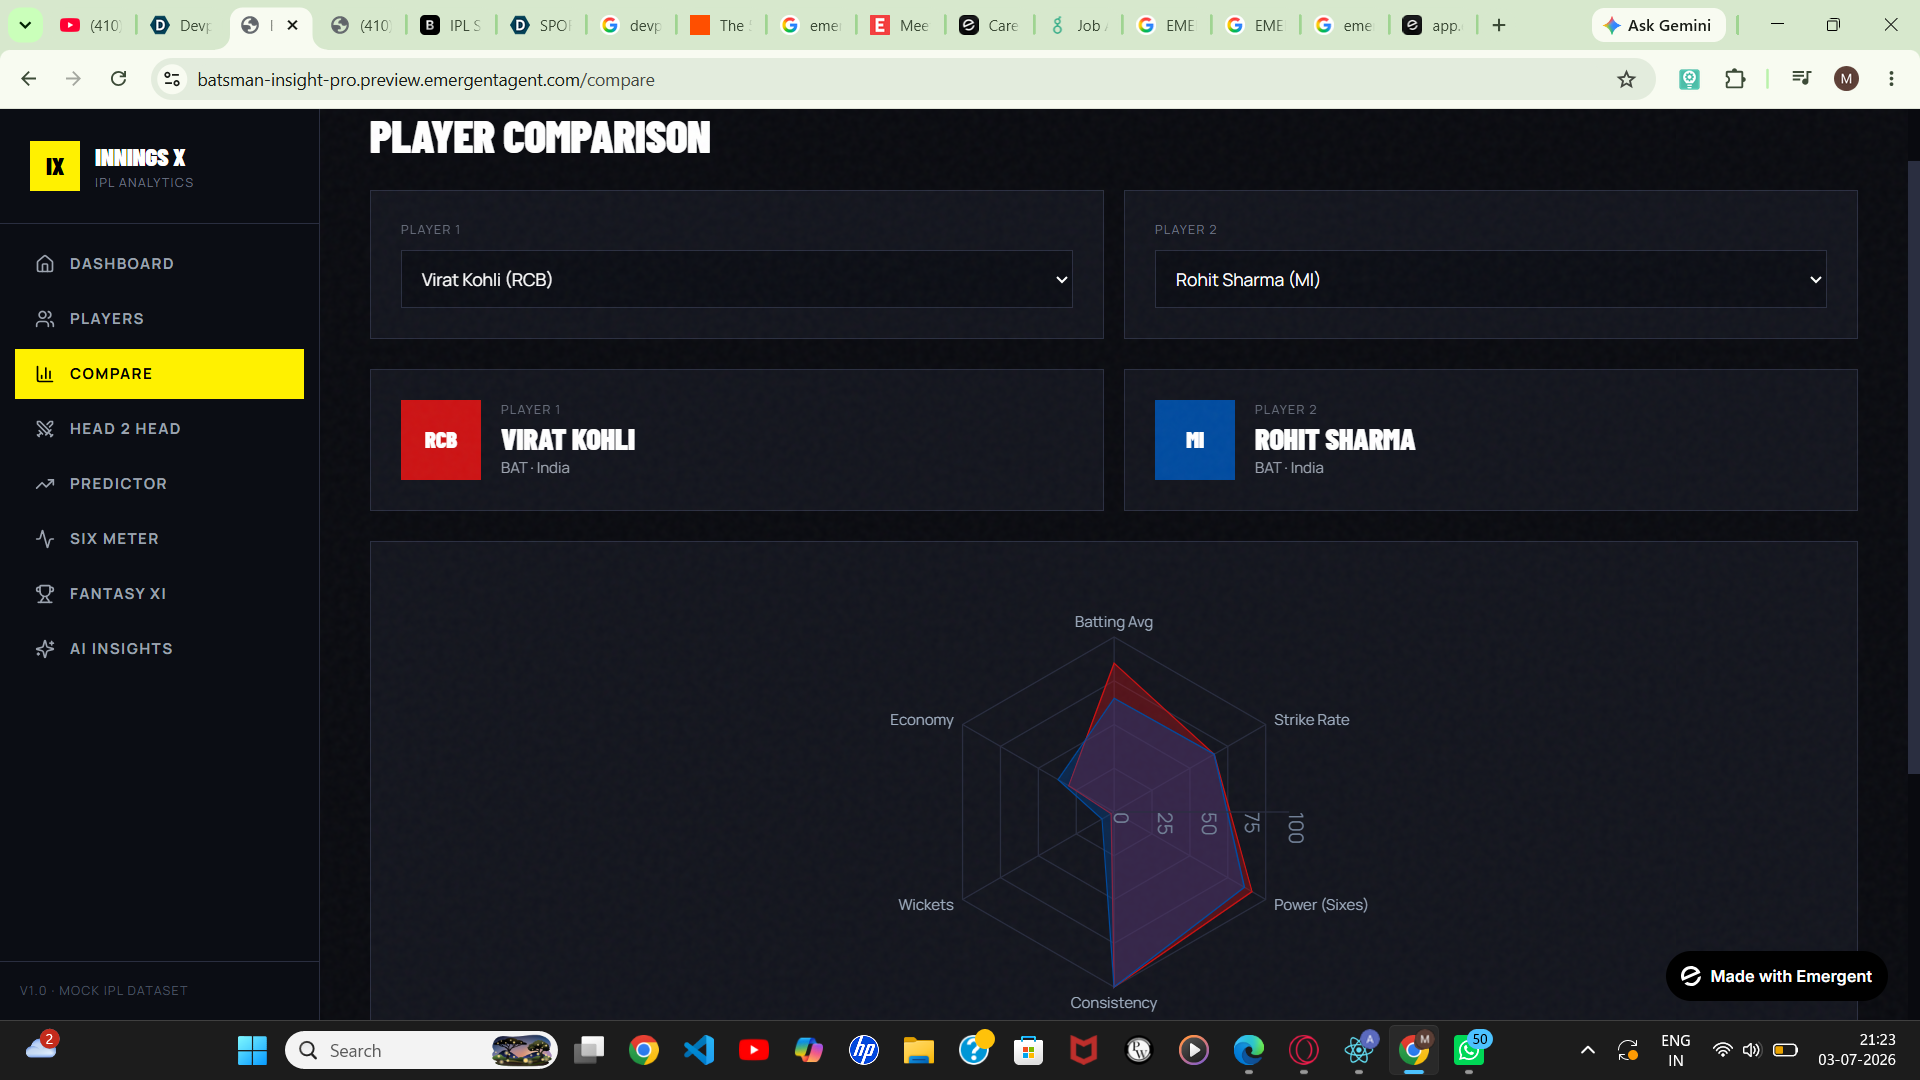
Deep Dives: Specialized views for player profiles, head-to-head comparisons, and a dedicated "Six Meter."
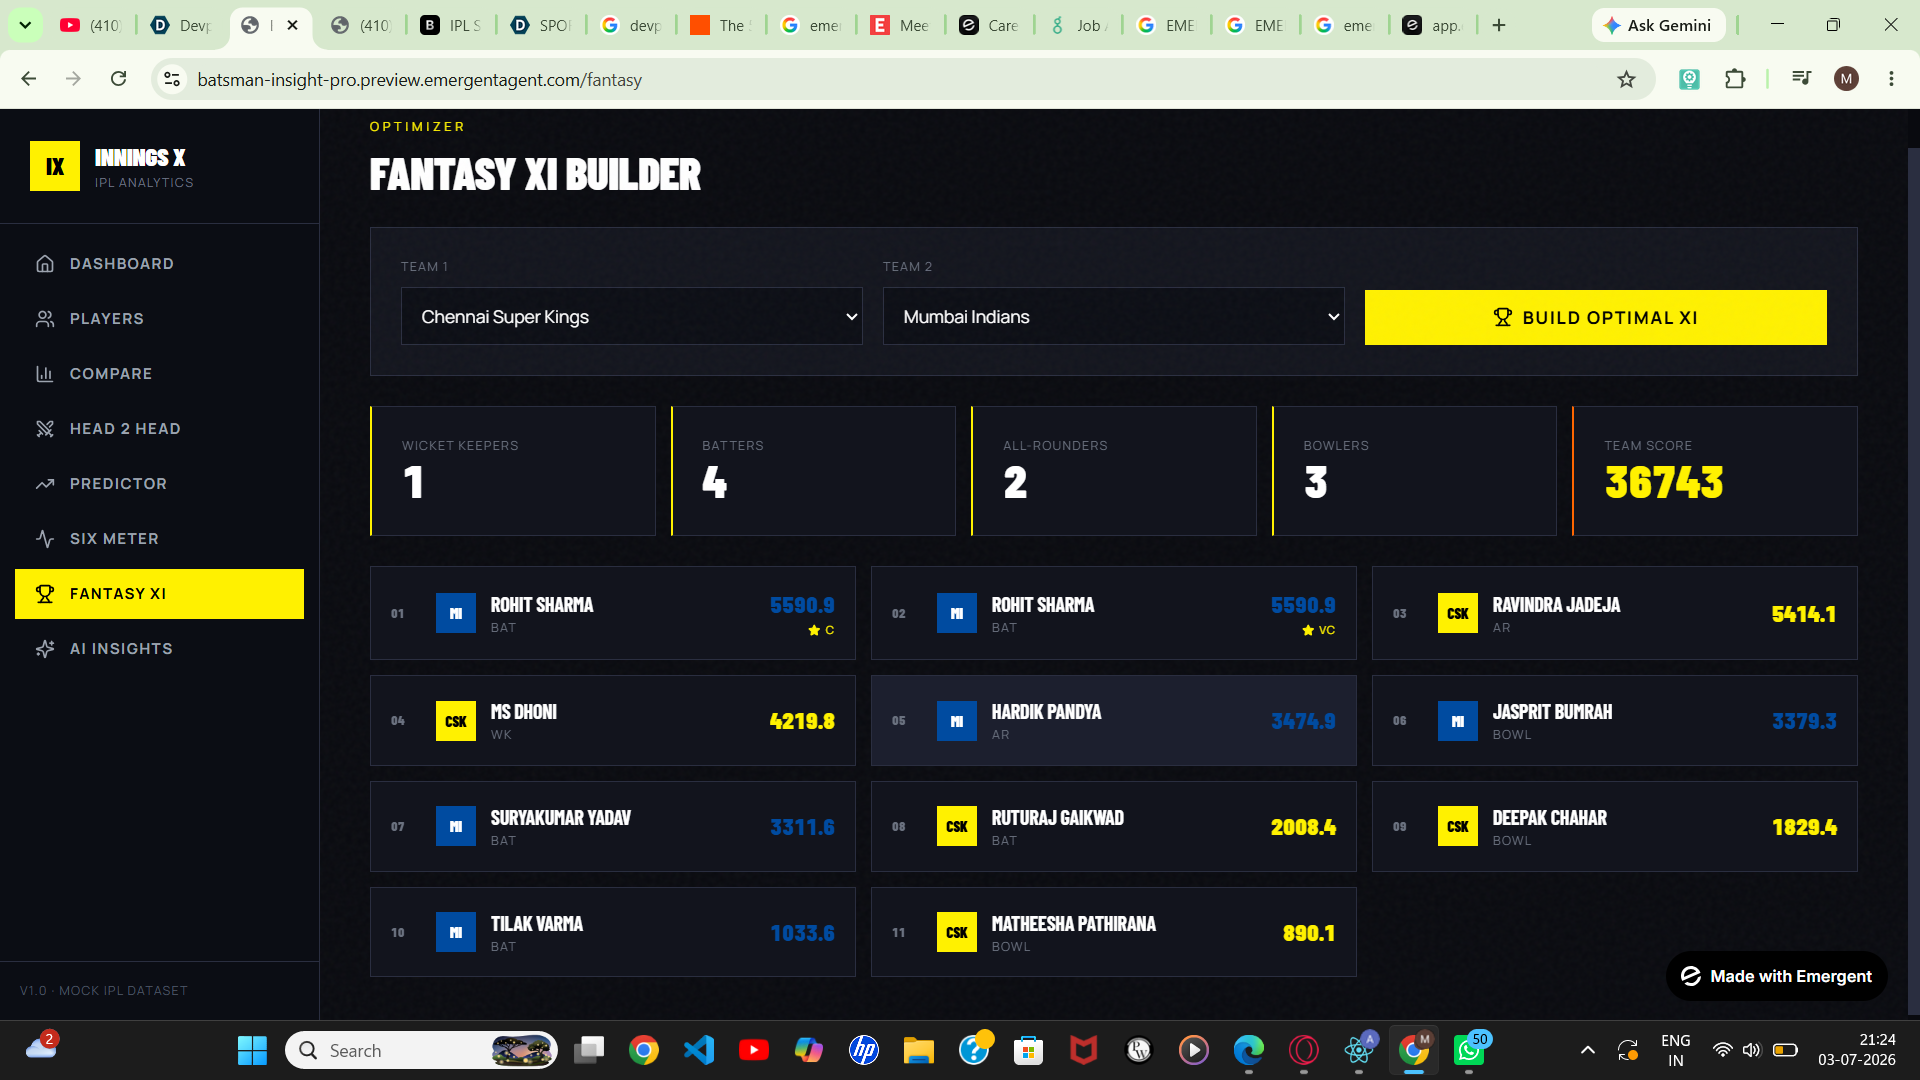
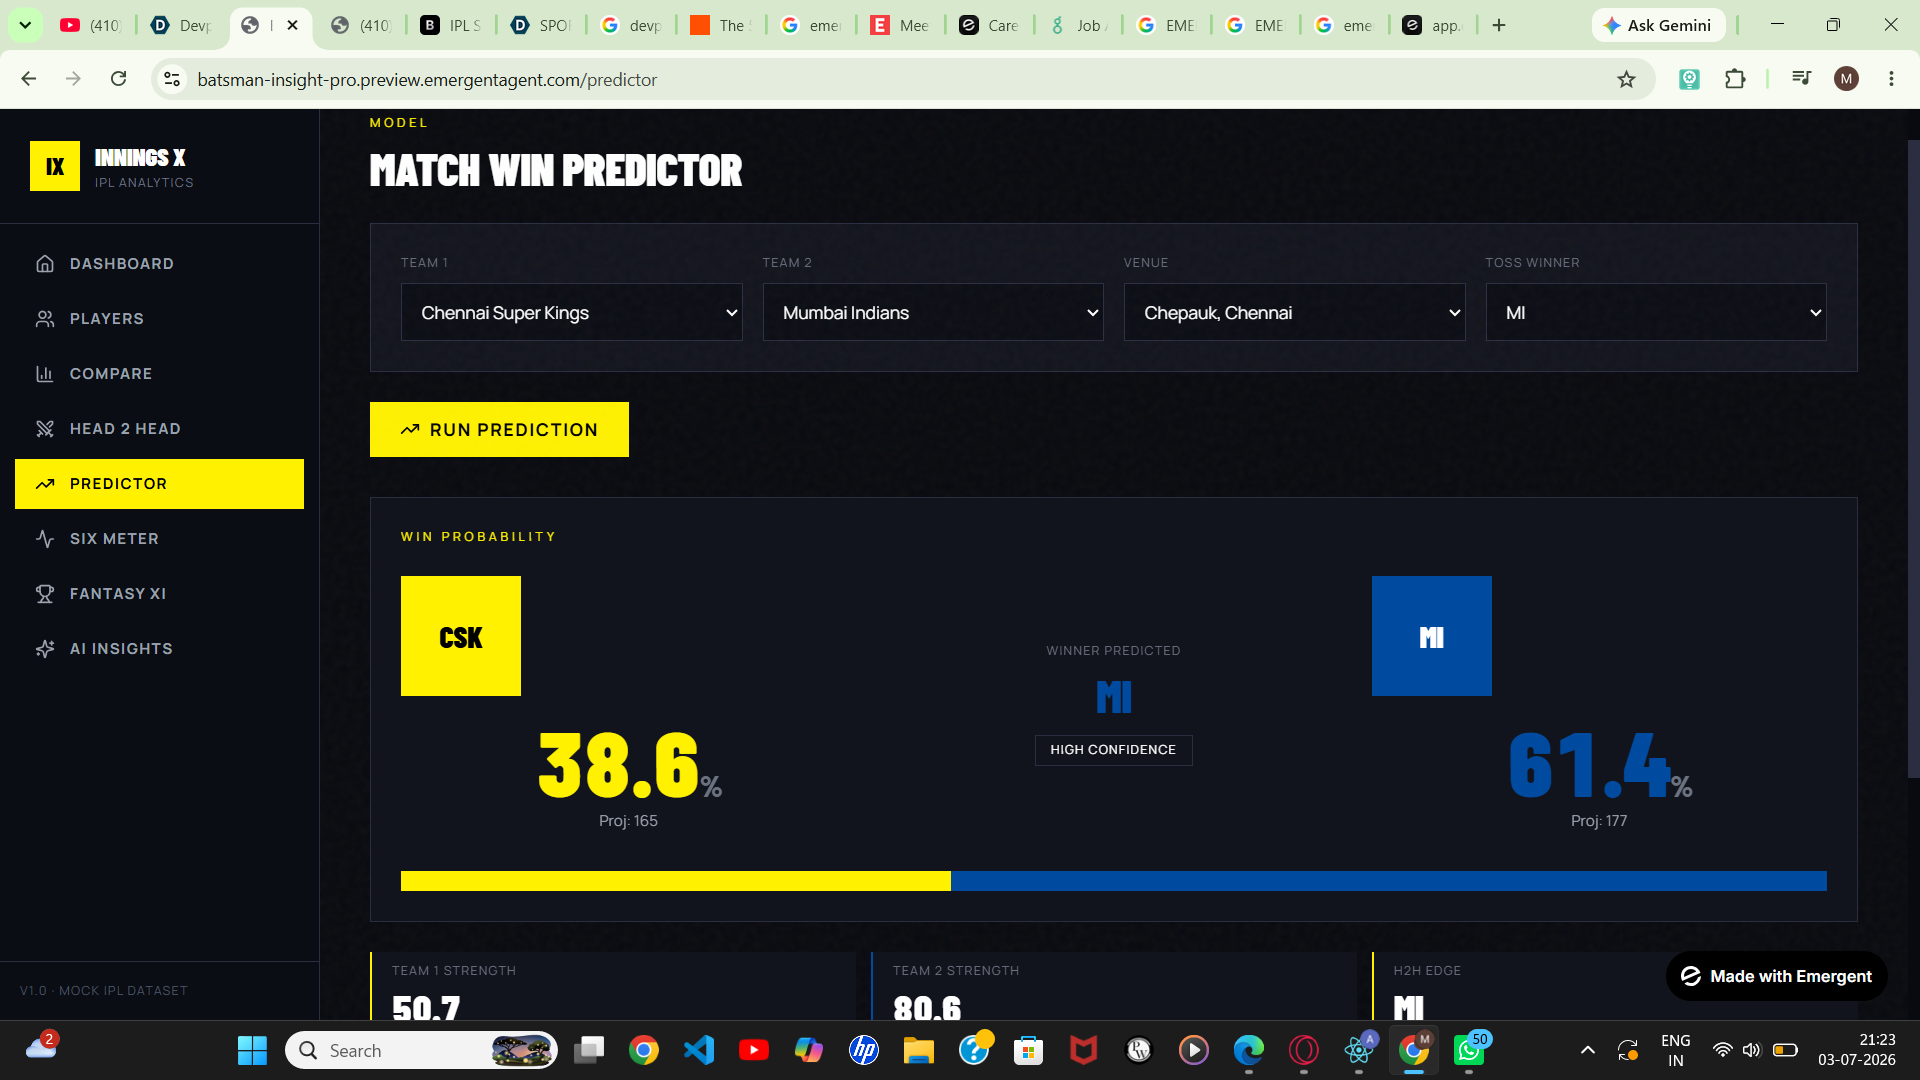
Advanced Tools: A Win Probability Match Predictor, Fantasy XI Builder, and an AI Insights module to deliver automated match previews and tactical breakdowns.
How we built it We engineered this platform using a modern fullstack architecture optimized for handling and rendering large, fast-moving datasets:
Frontend: Built with React/Next.js for an ultra-responsive, modular dashboard layout.
Styling: Designed with a sleek, dark-mode-first aesthetic using Tailwind CSS to mimic a high-tech sports command center.
Data Layer: Utilized a mock IPL dataset structured to simulate real-time season telemetry, handling structured tables for player metrics and match schedules efficiently.
Challenges we ran into One of our biggest hurdles was data formatting and scannability. Cricket statistics are notoriously dense. Presenting team standings, upcoming schedules, and multiple individual leaderboards on a single screen without overwhelming the user required a lot of trial and error with UI hierarchy. Balancing the visual real estate between global league tables and granular player metrics forced us to think critically about responsive layout design.
Accomplishments that we're proud of Visual Clarity at a Glance: Successfully creating a high-density analytics interface that remains incredibly easy to read and navigate.
Seamless Feature Set: Integrating diverse tools like a Fantasy XI builder and an AI Match Predictor under one cohesive design language.
Performance: Achieving smooth transitions and zero-lag rendering when sorting through extensive player data lists.
What we learned We learned the true value of data visualization hierarchy. Having massive amounts of data means nothing if the end-user can't pull an insight from it within three seconds of looking at the screen. We also sharpened our skills in building highly responsive frontend tables that gracefully handle long player lists and fluctuating statistics.
What's next for SPORTS DASHBOARD Real-Time API Integration: Transitioning from our mock dataset to a live, production-grade cricket data feed for real-time in-play analytics.
Predictive Machine Learning: Upgrading the Match Predictor from a rule-based engine to a machine learning model trained on historical pitch conditions, player matchups, and weather data.
Custom Notifications: Allowing users to follow specific teams or fantasy players and get instant telemetry alerts directly to their devices.
Built With
- css
- css3
- html5
- javascript
- next.js
- react
- tailwind
- typescript

Log in or sign up for Devpost to join the conversation.