-
-
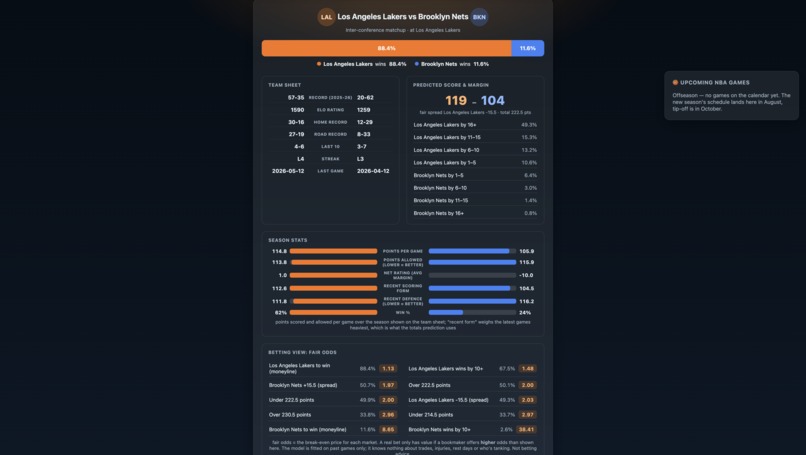
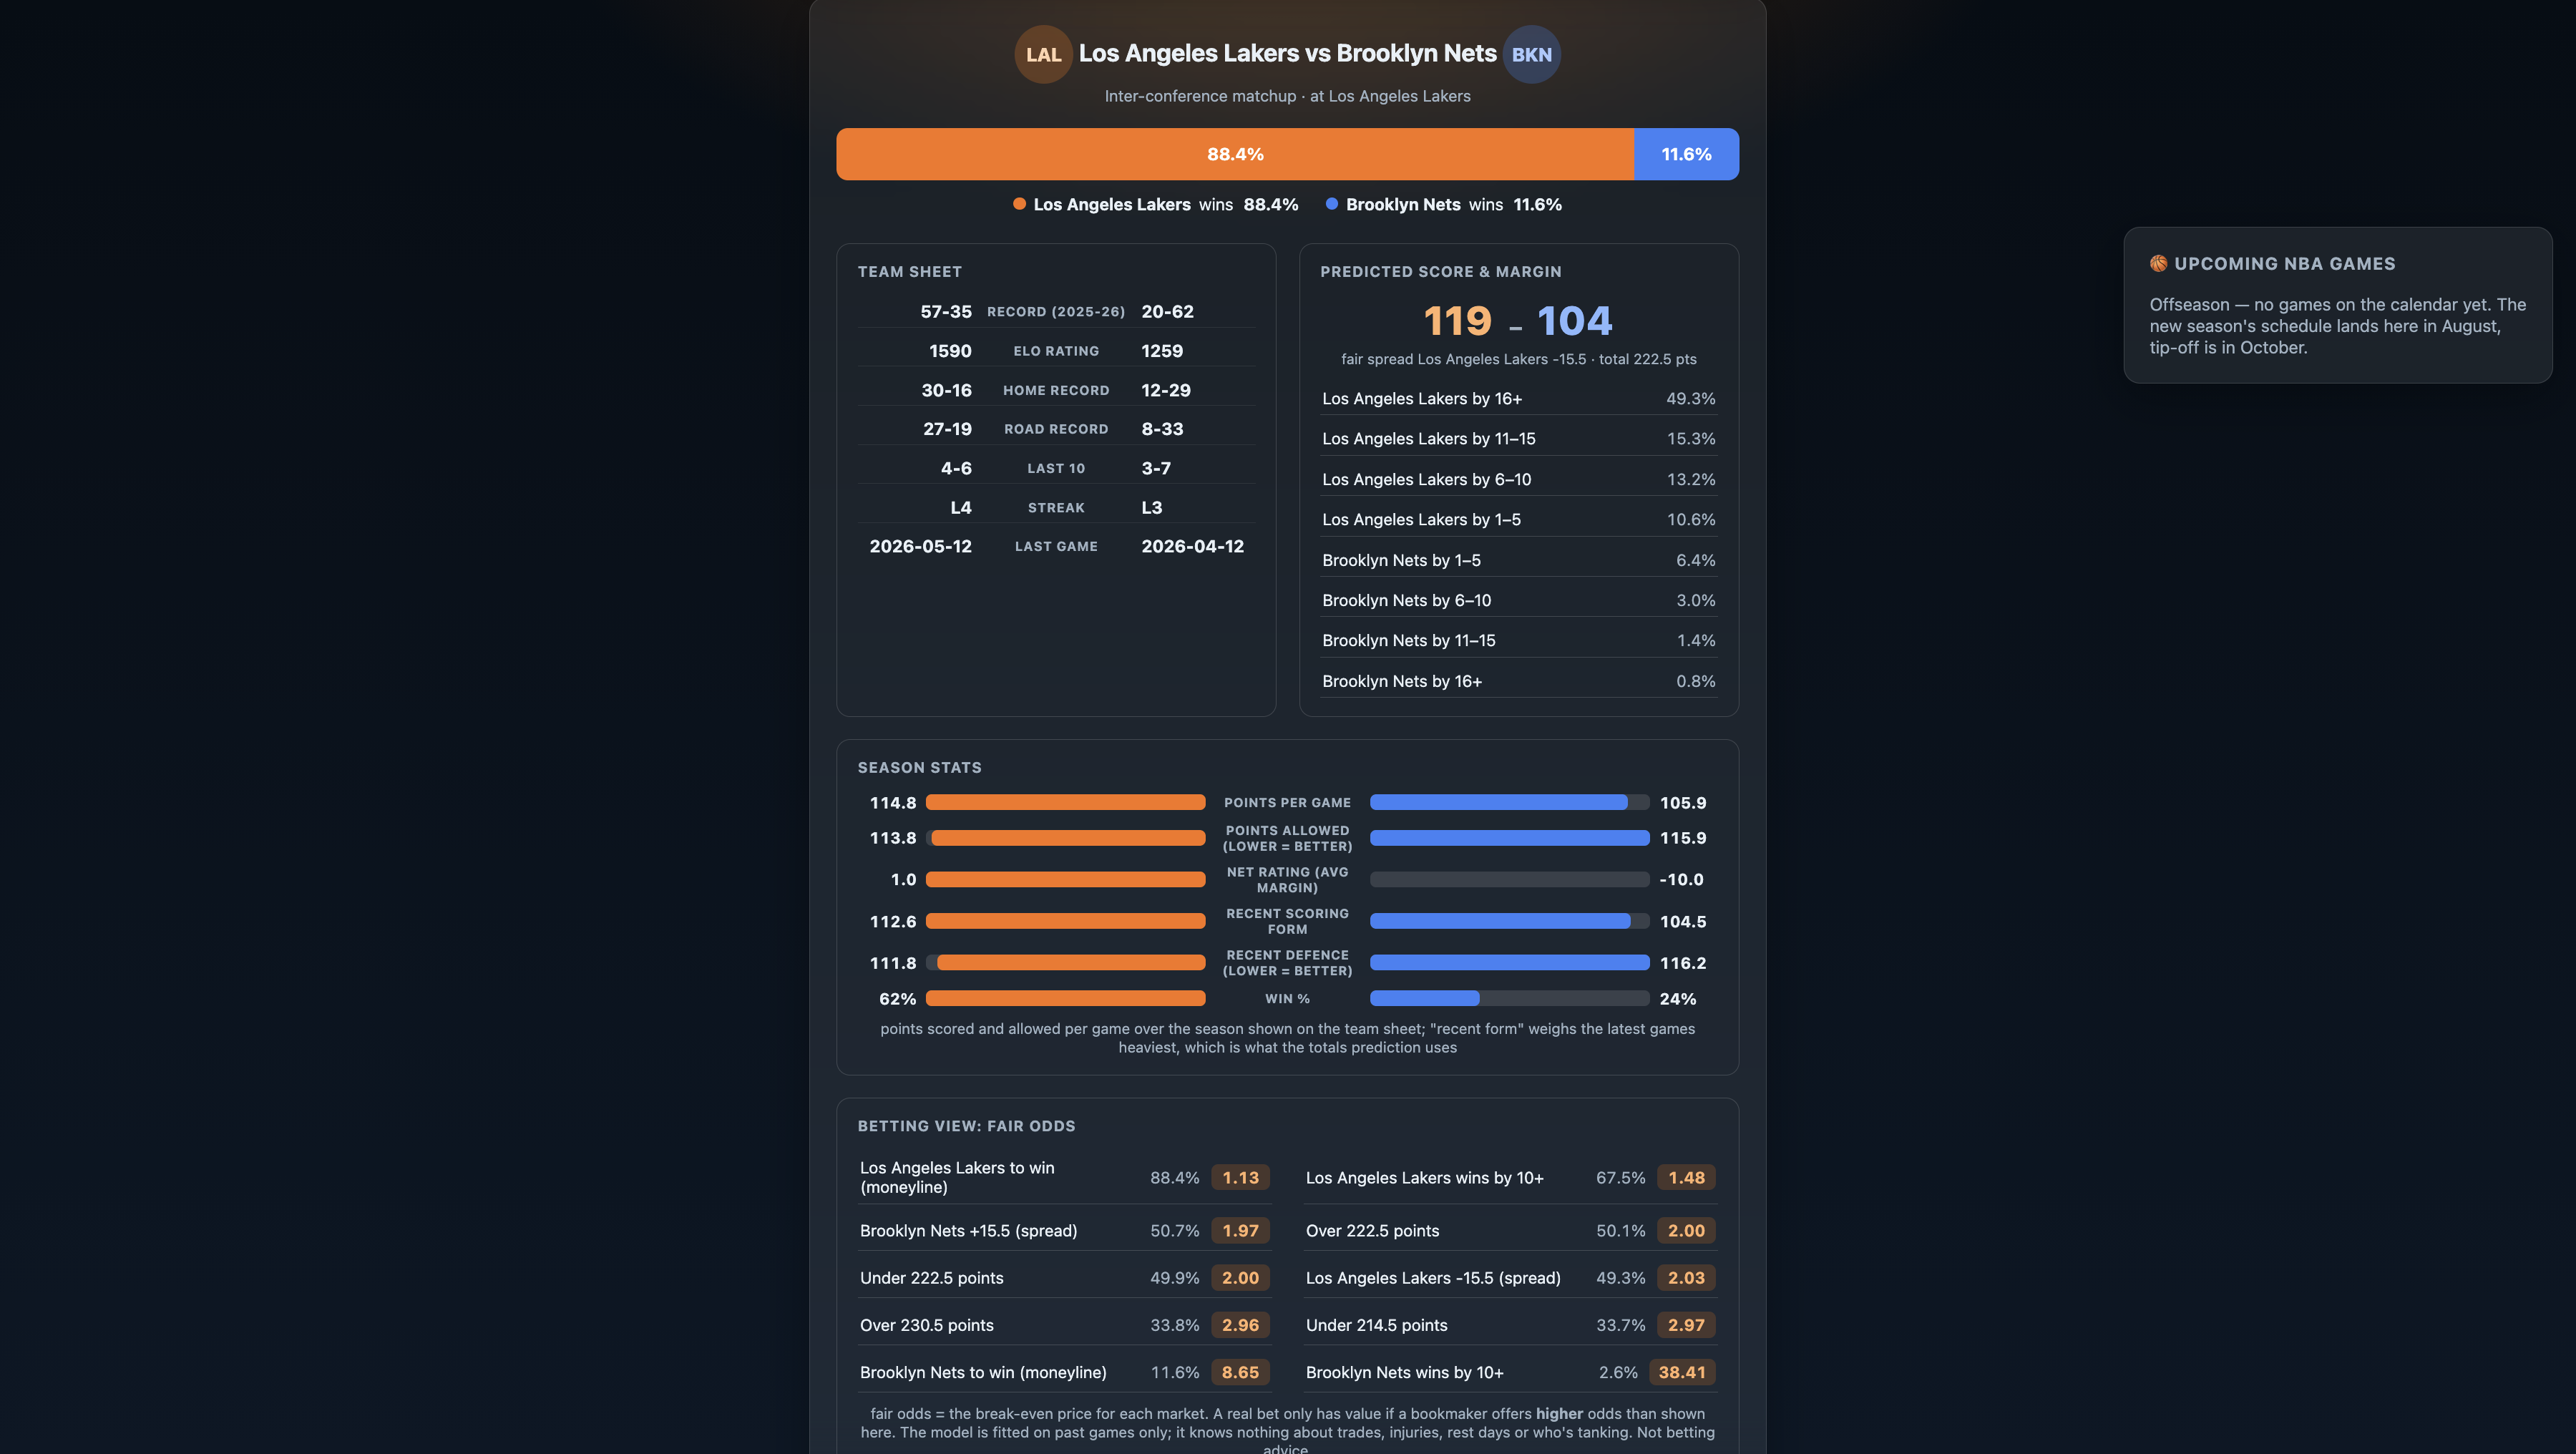
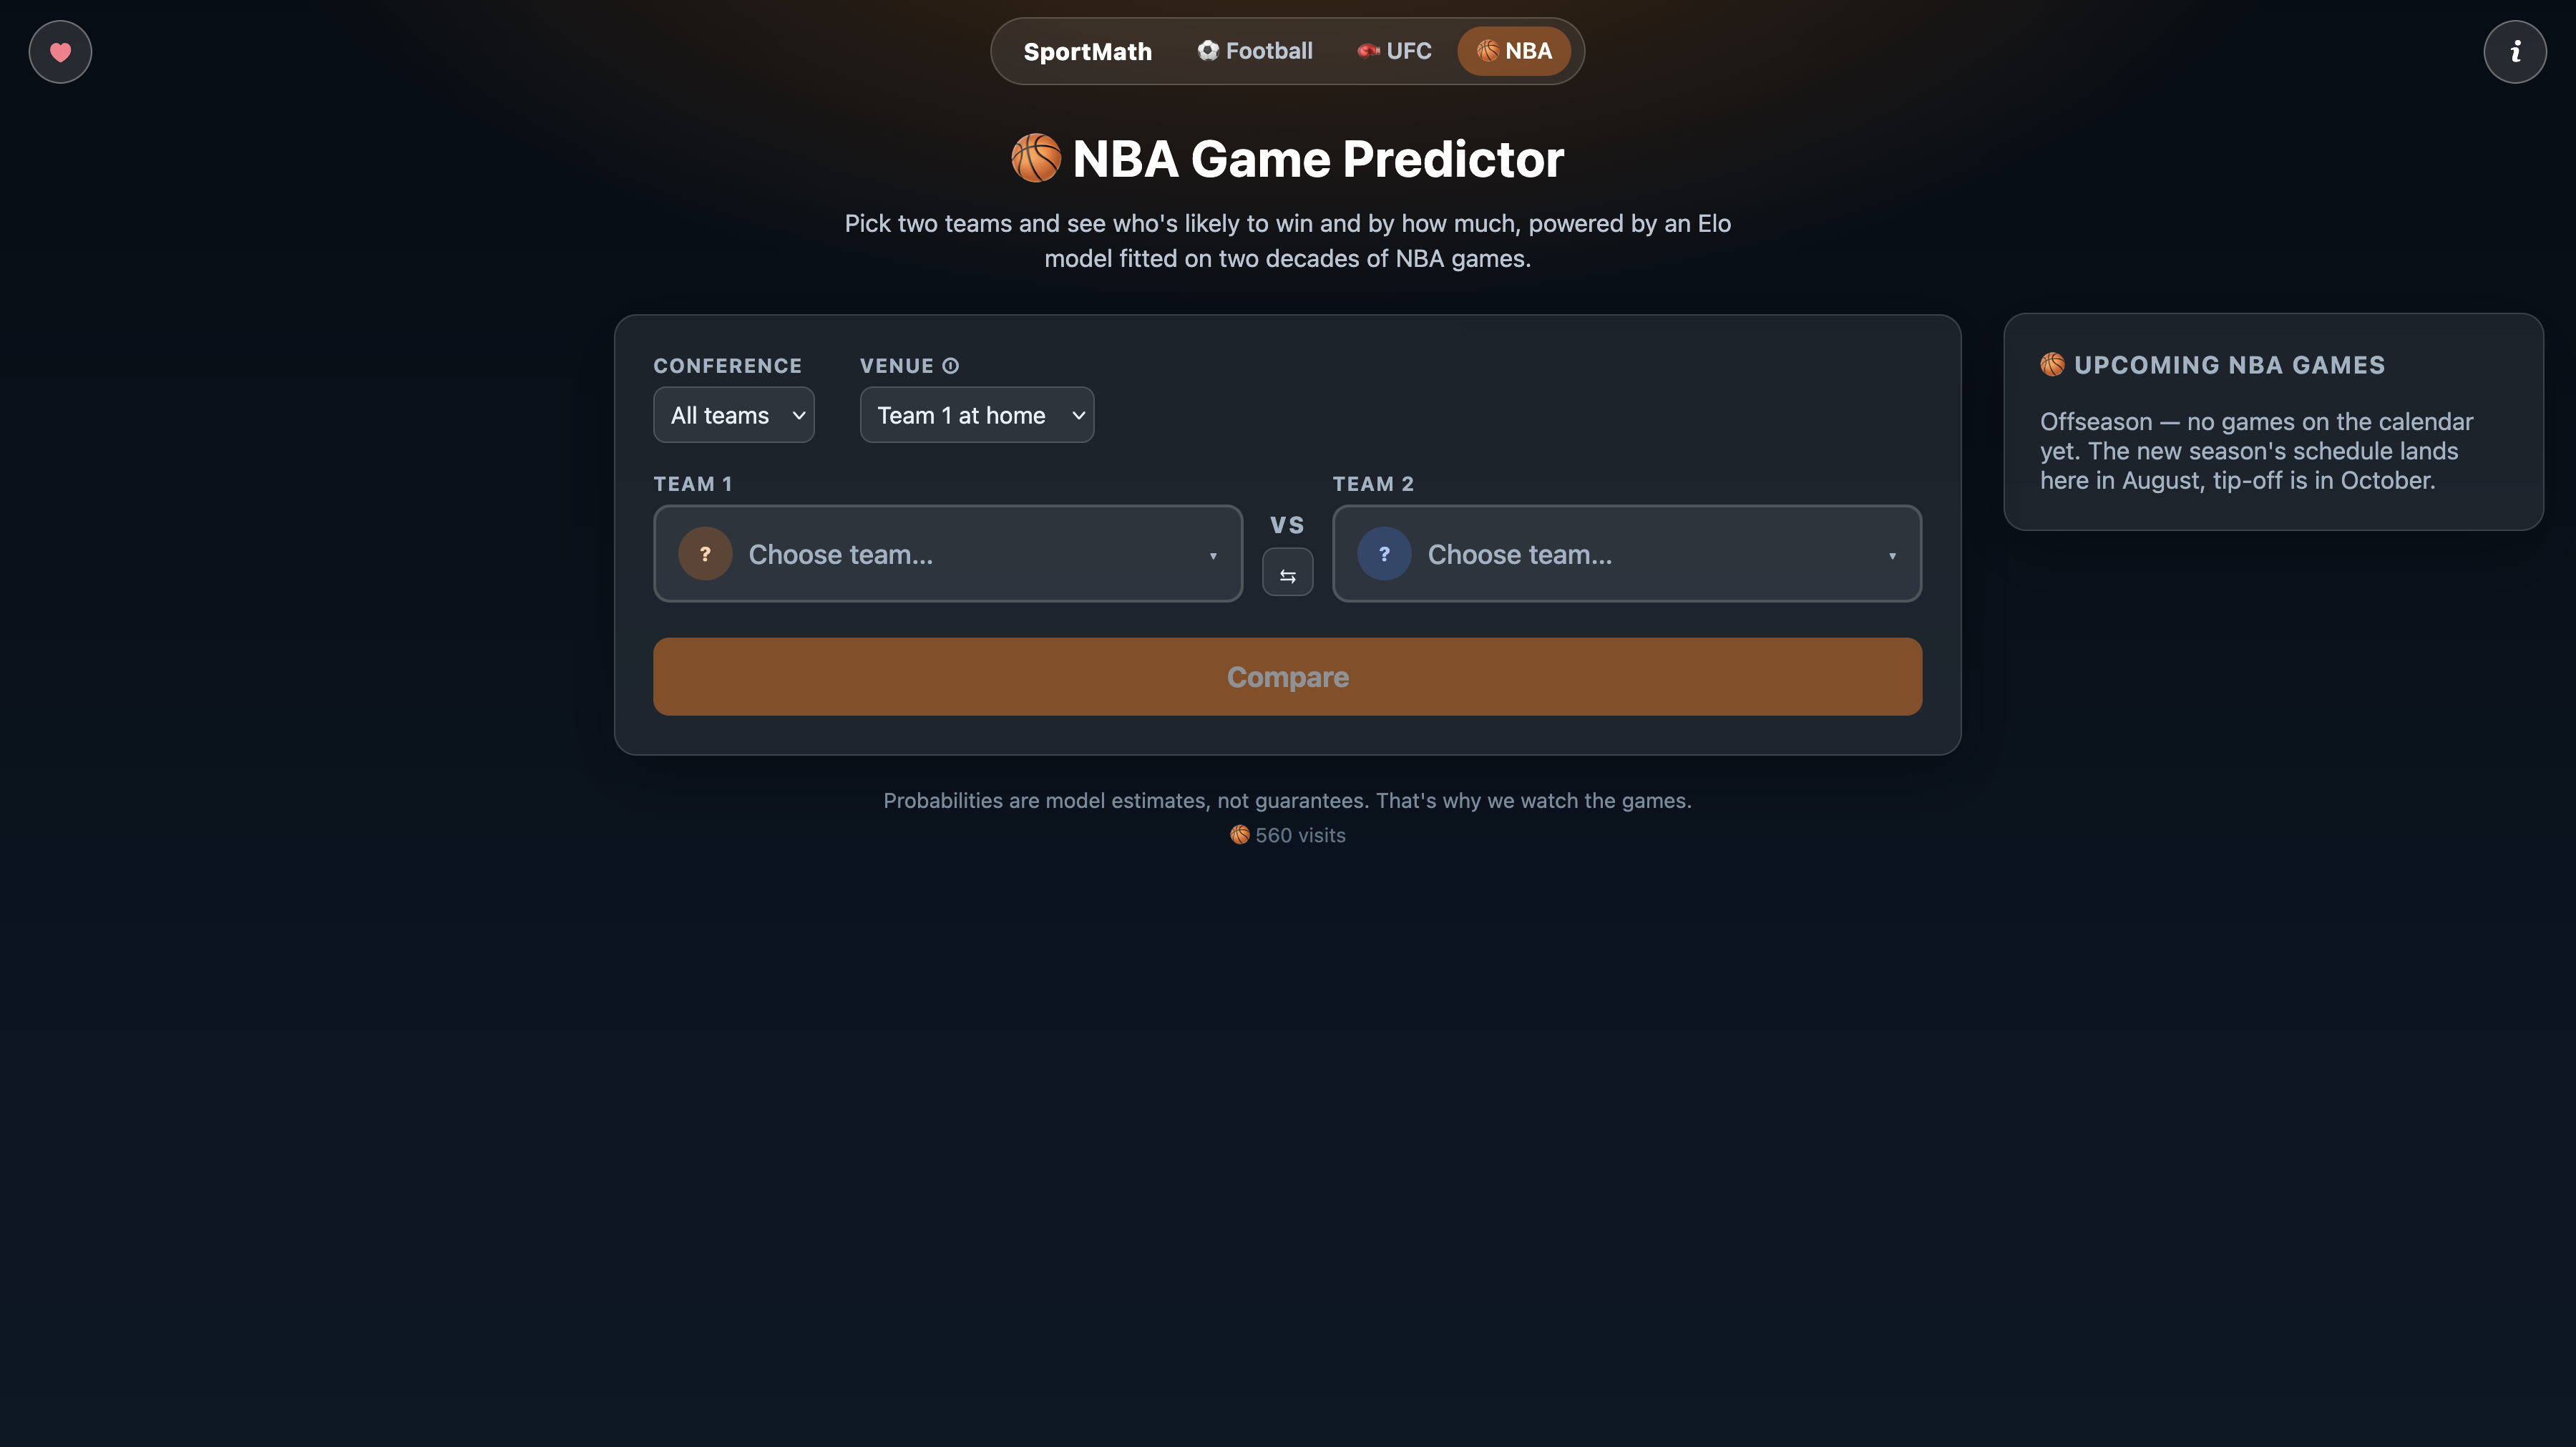
nba calculation
-
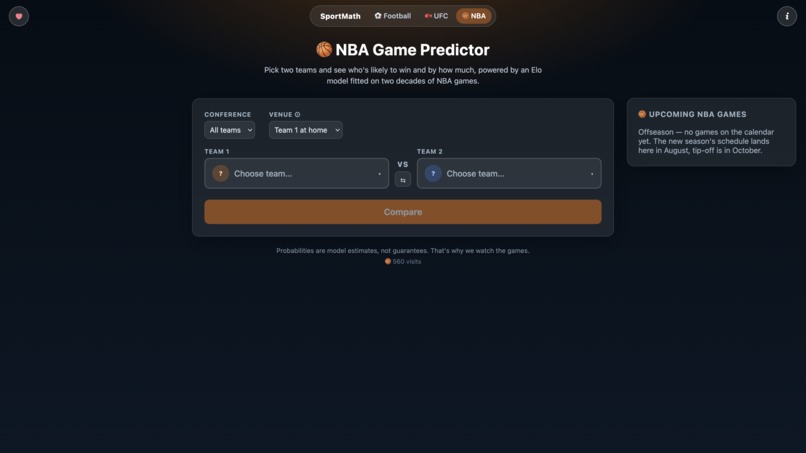
basketball page
-
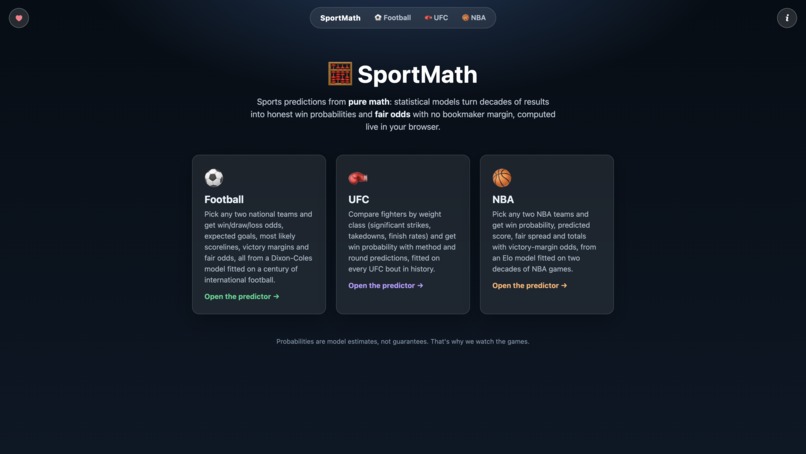
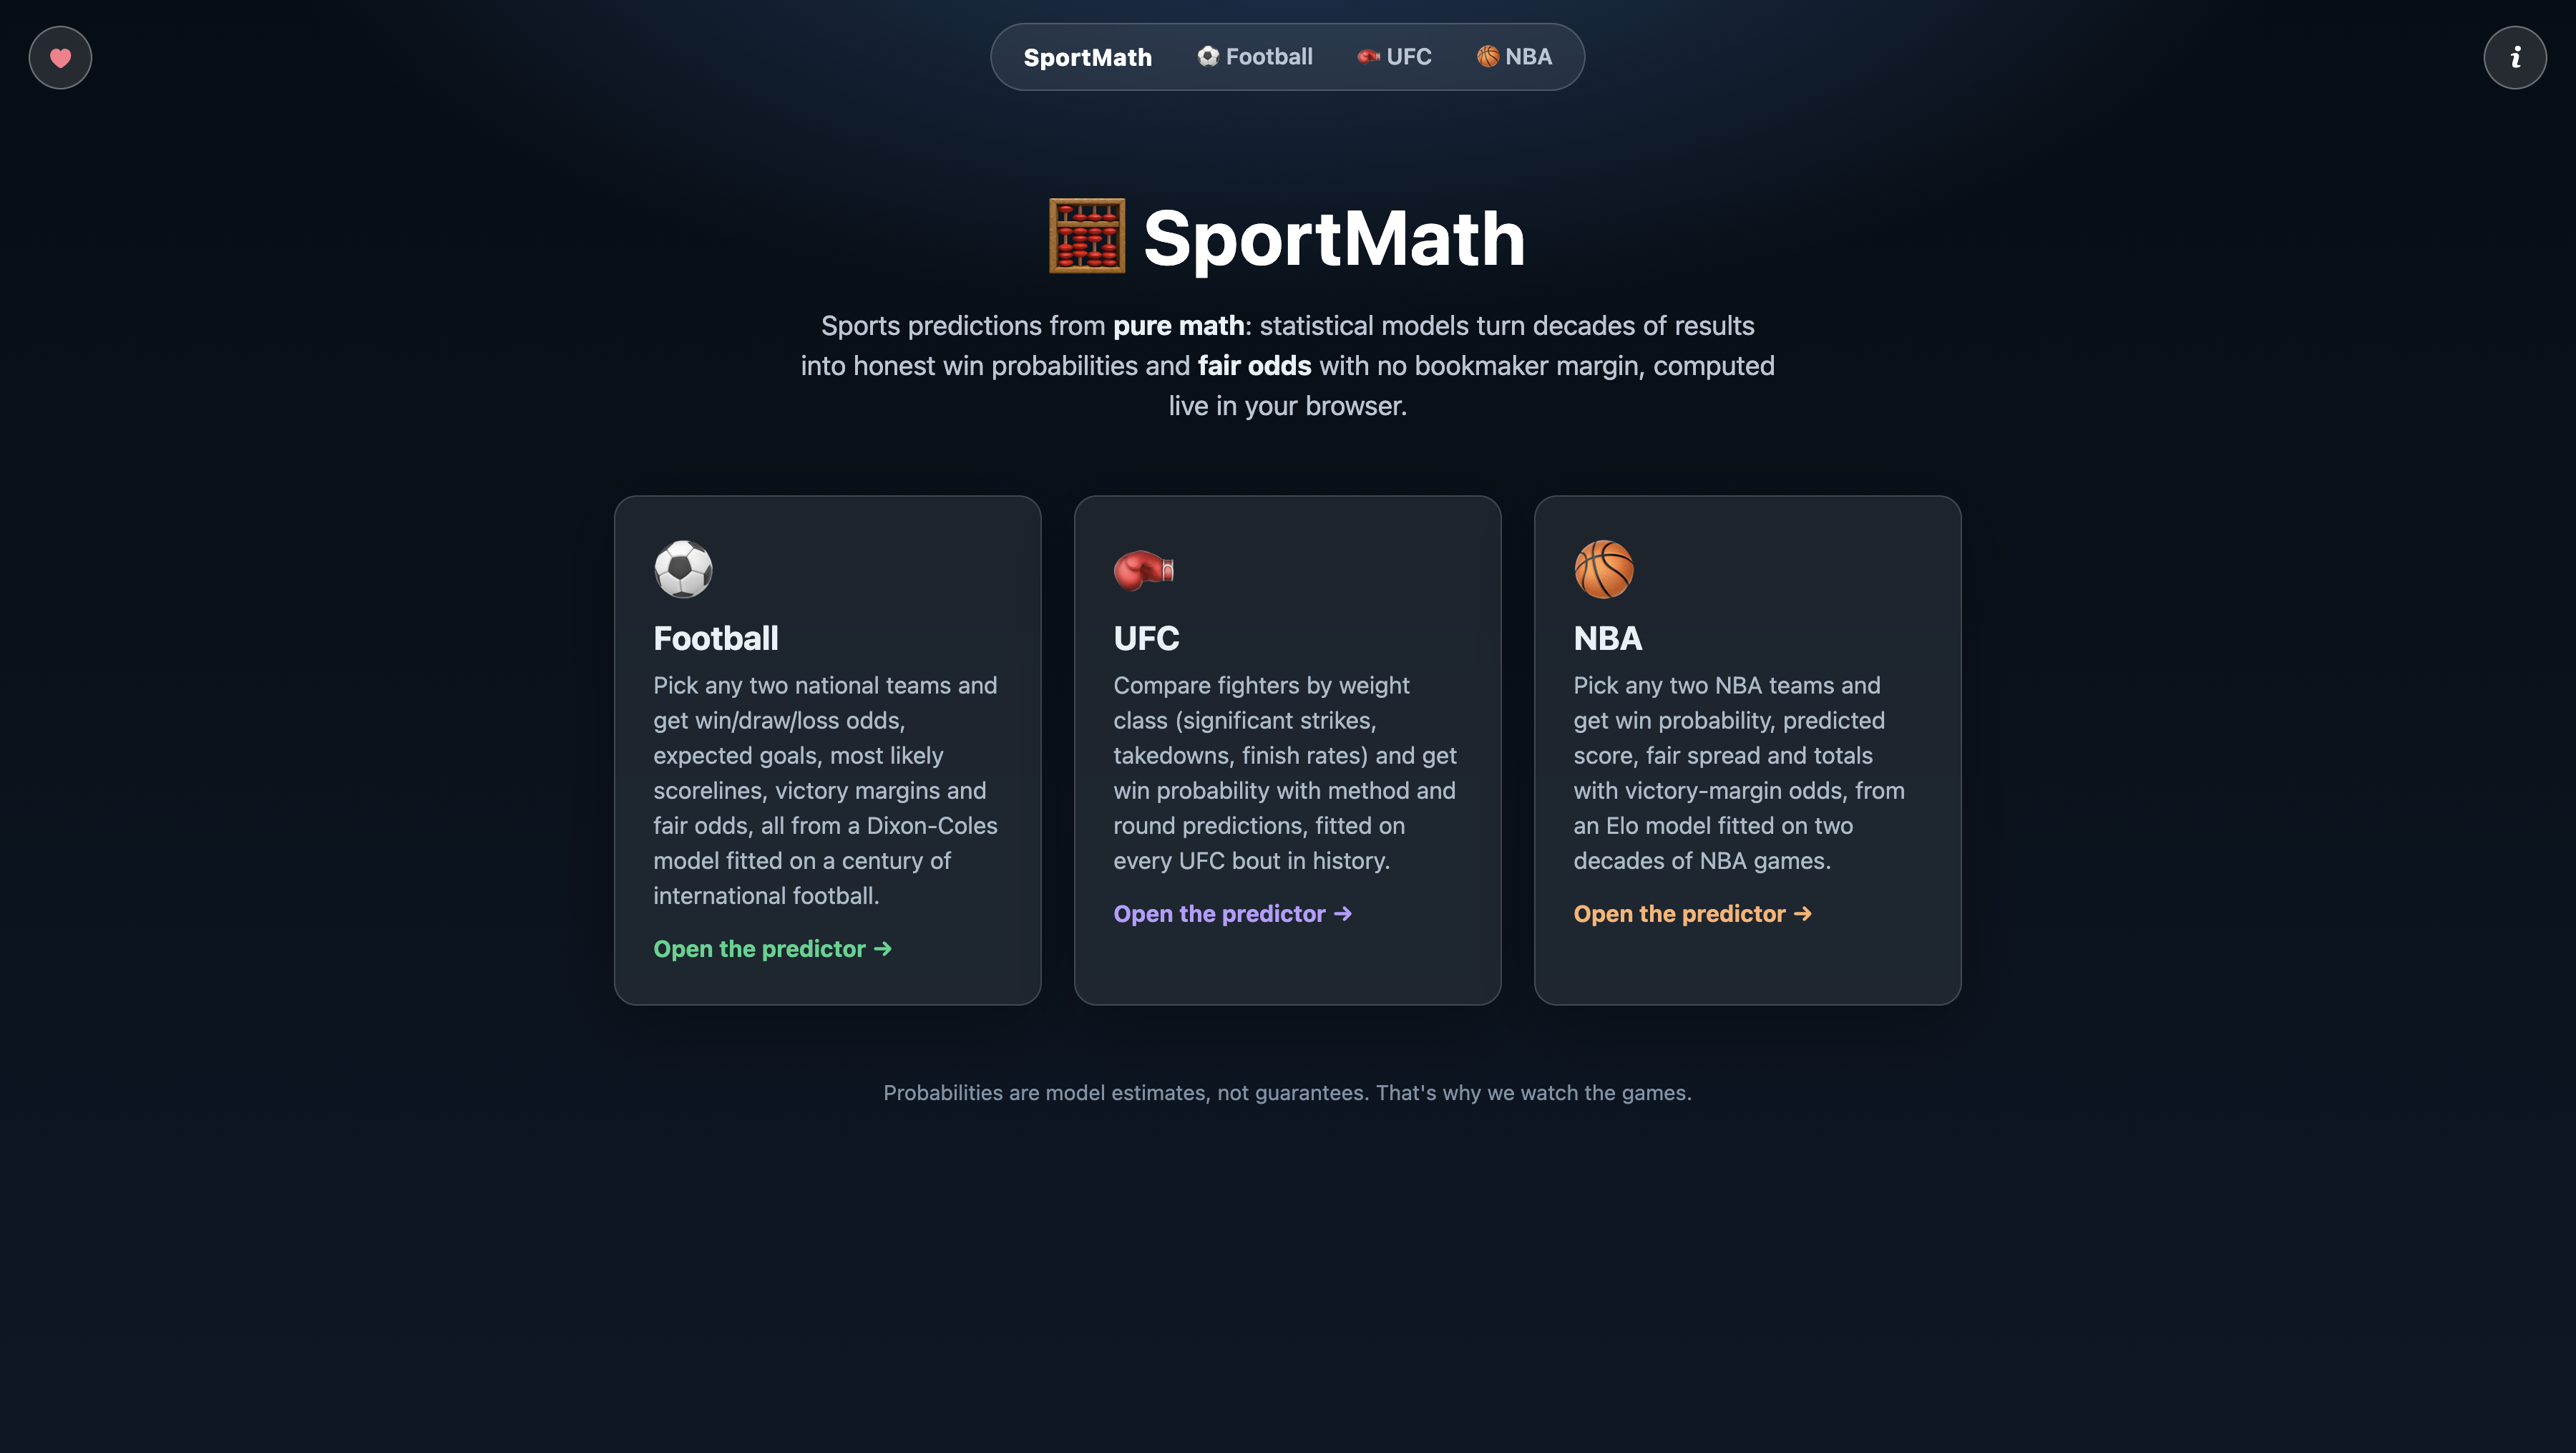
homepage
-
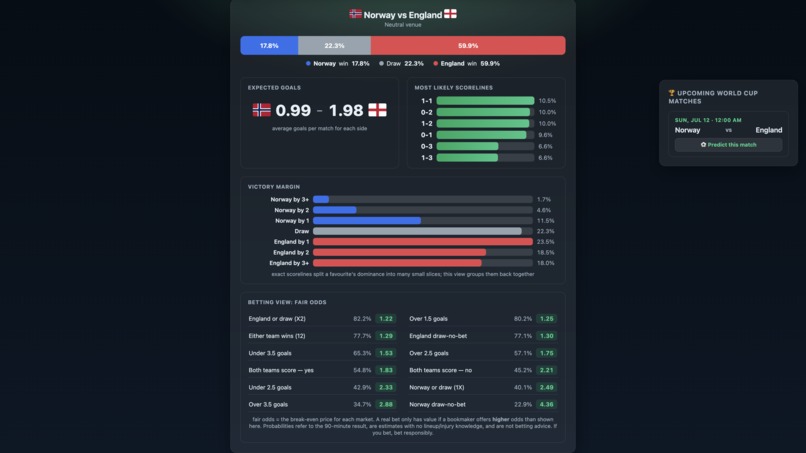
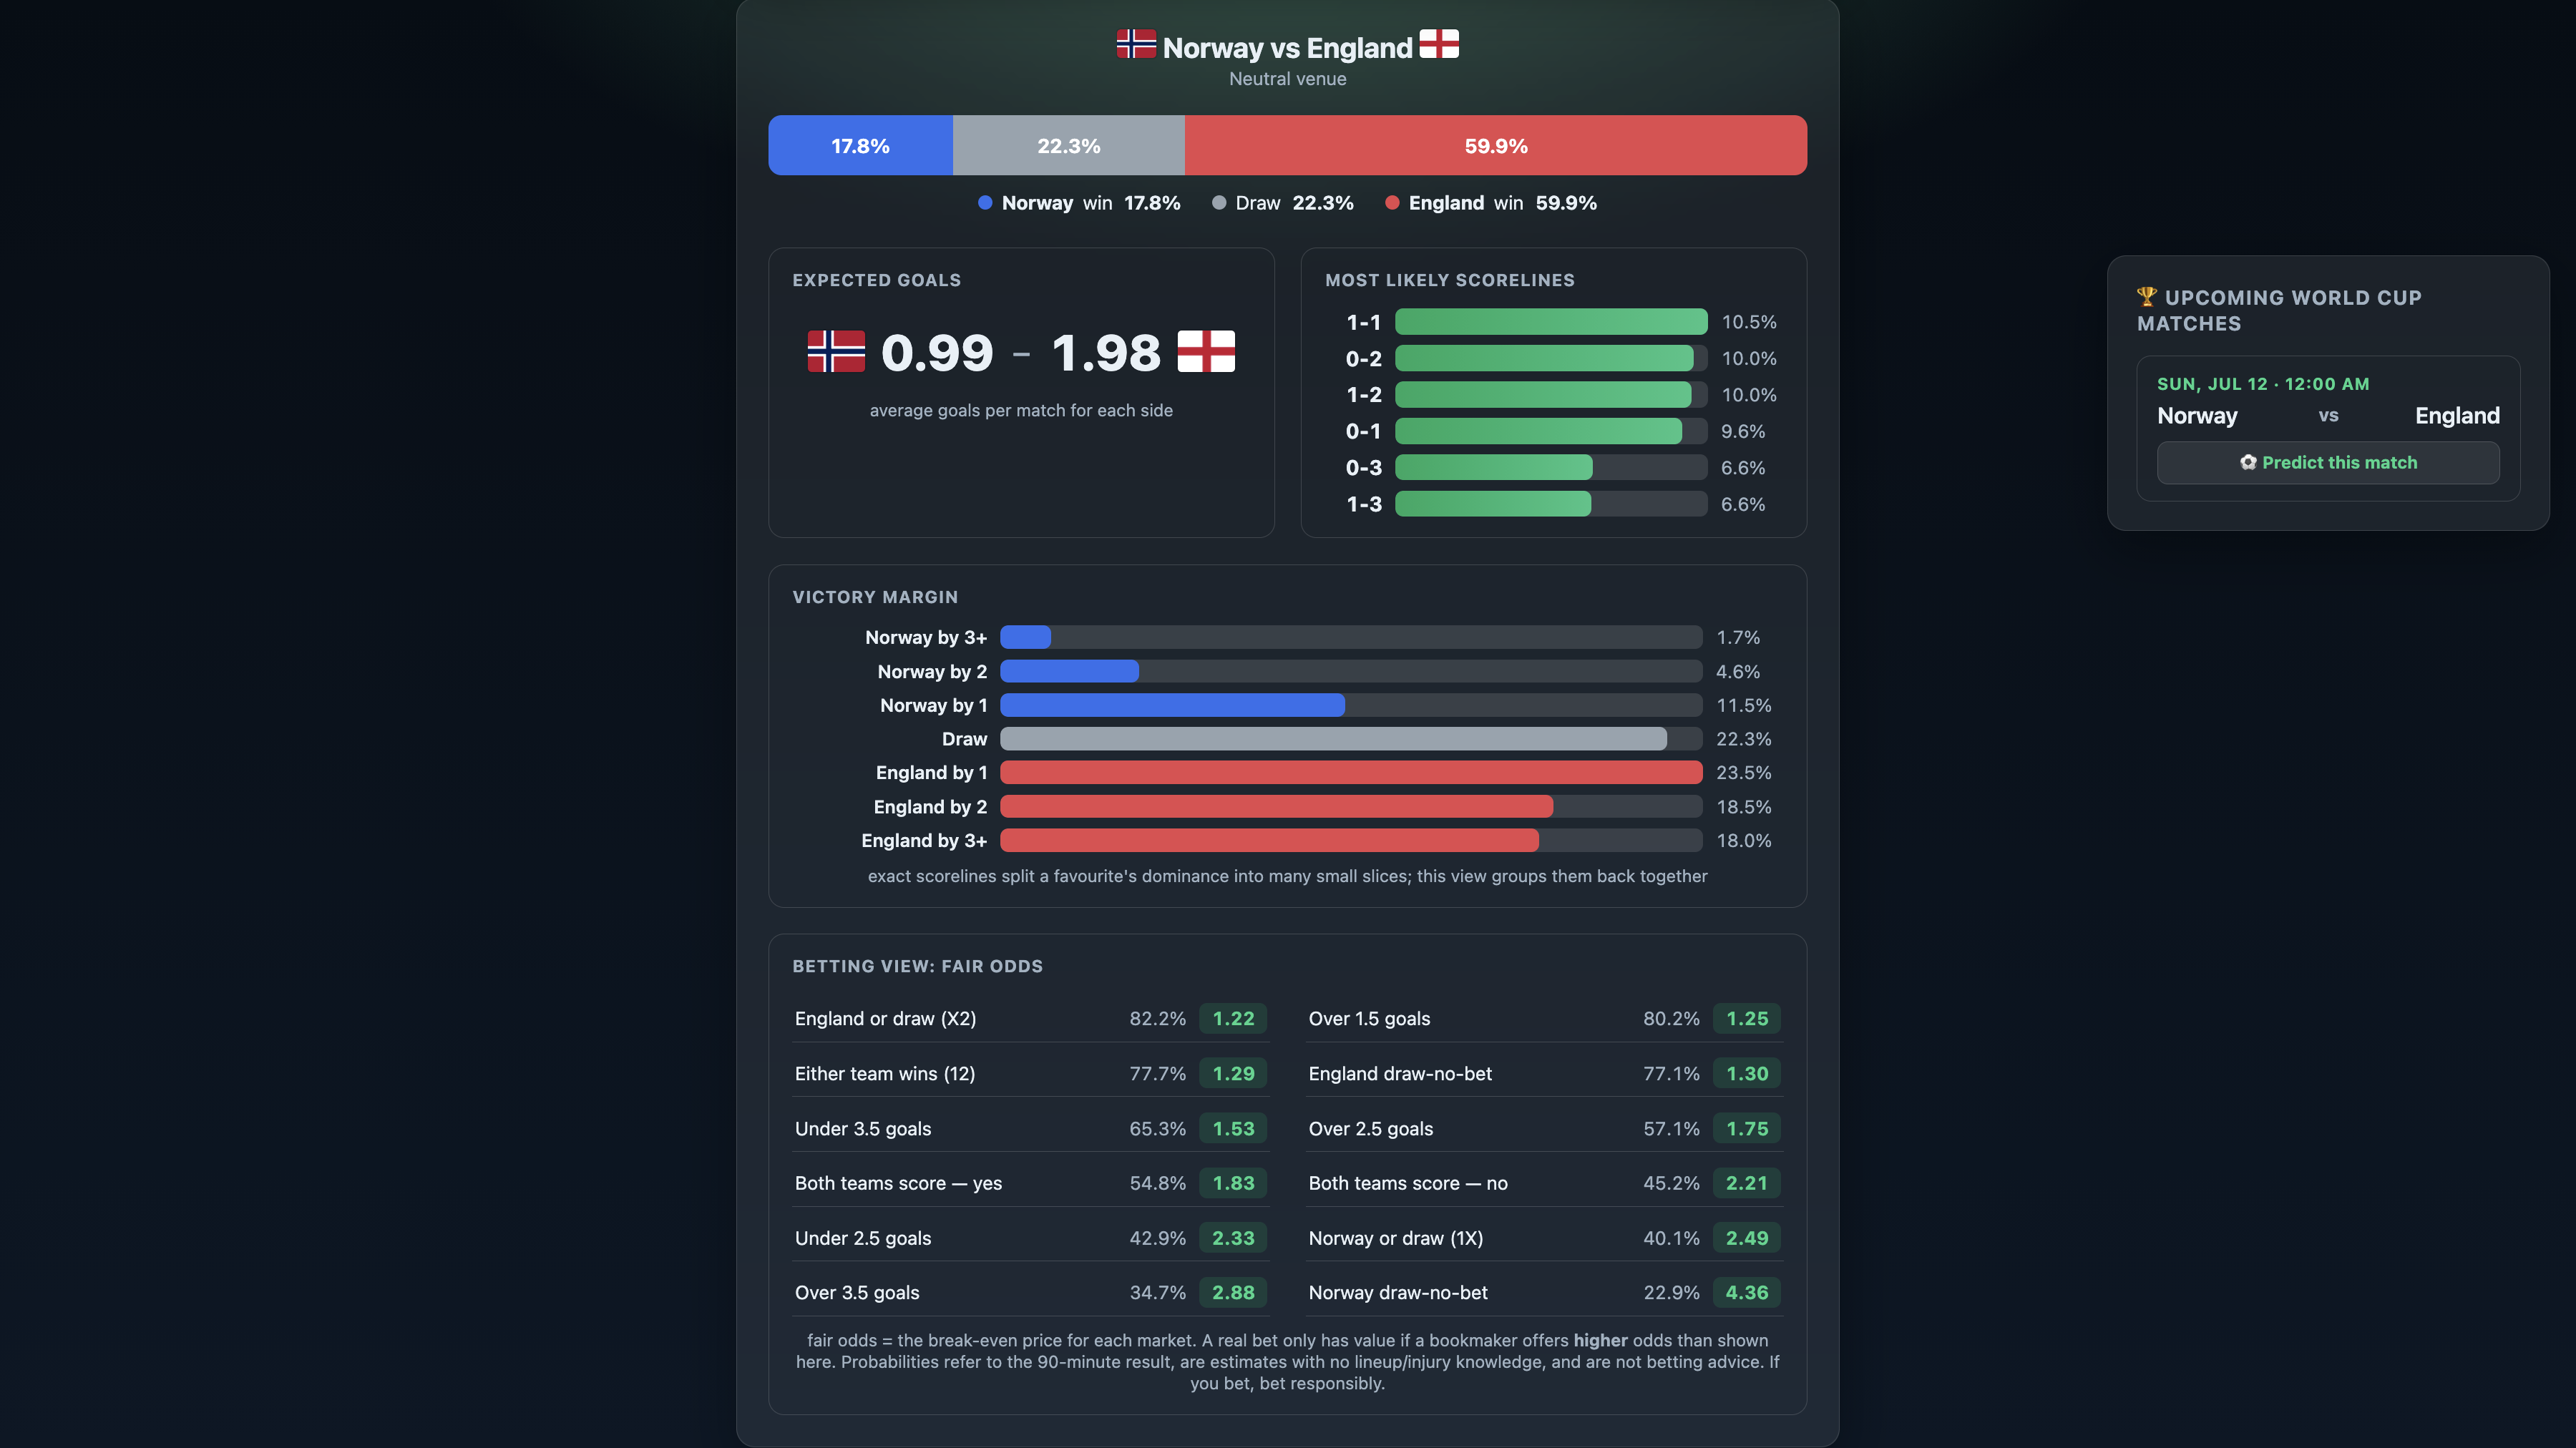
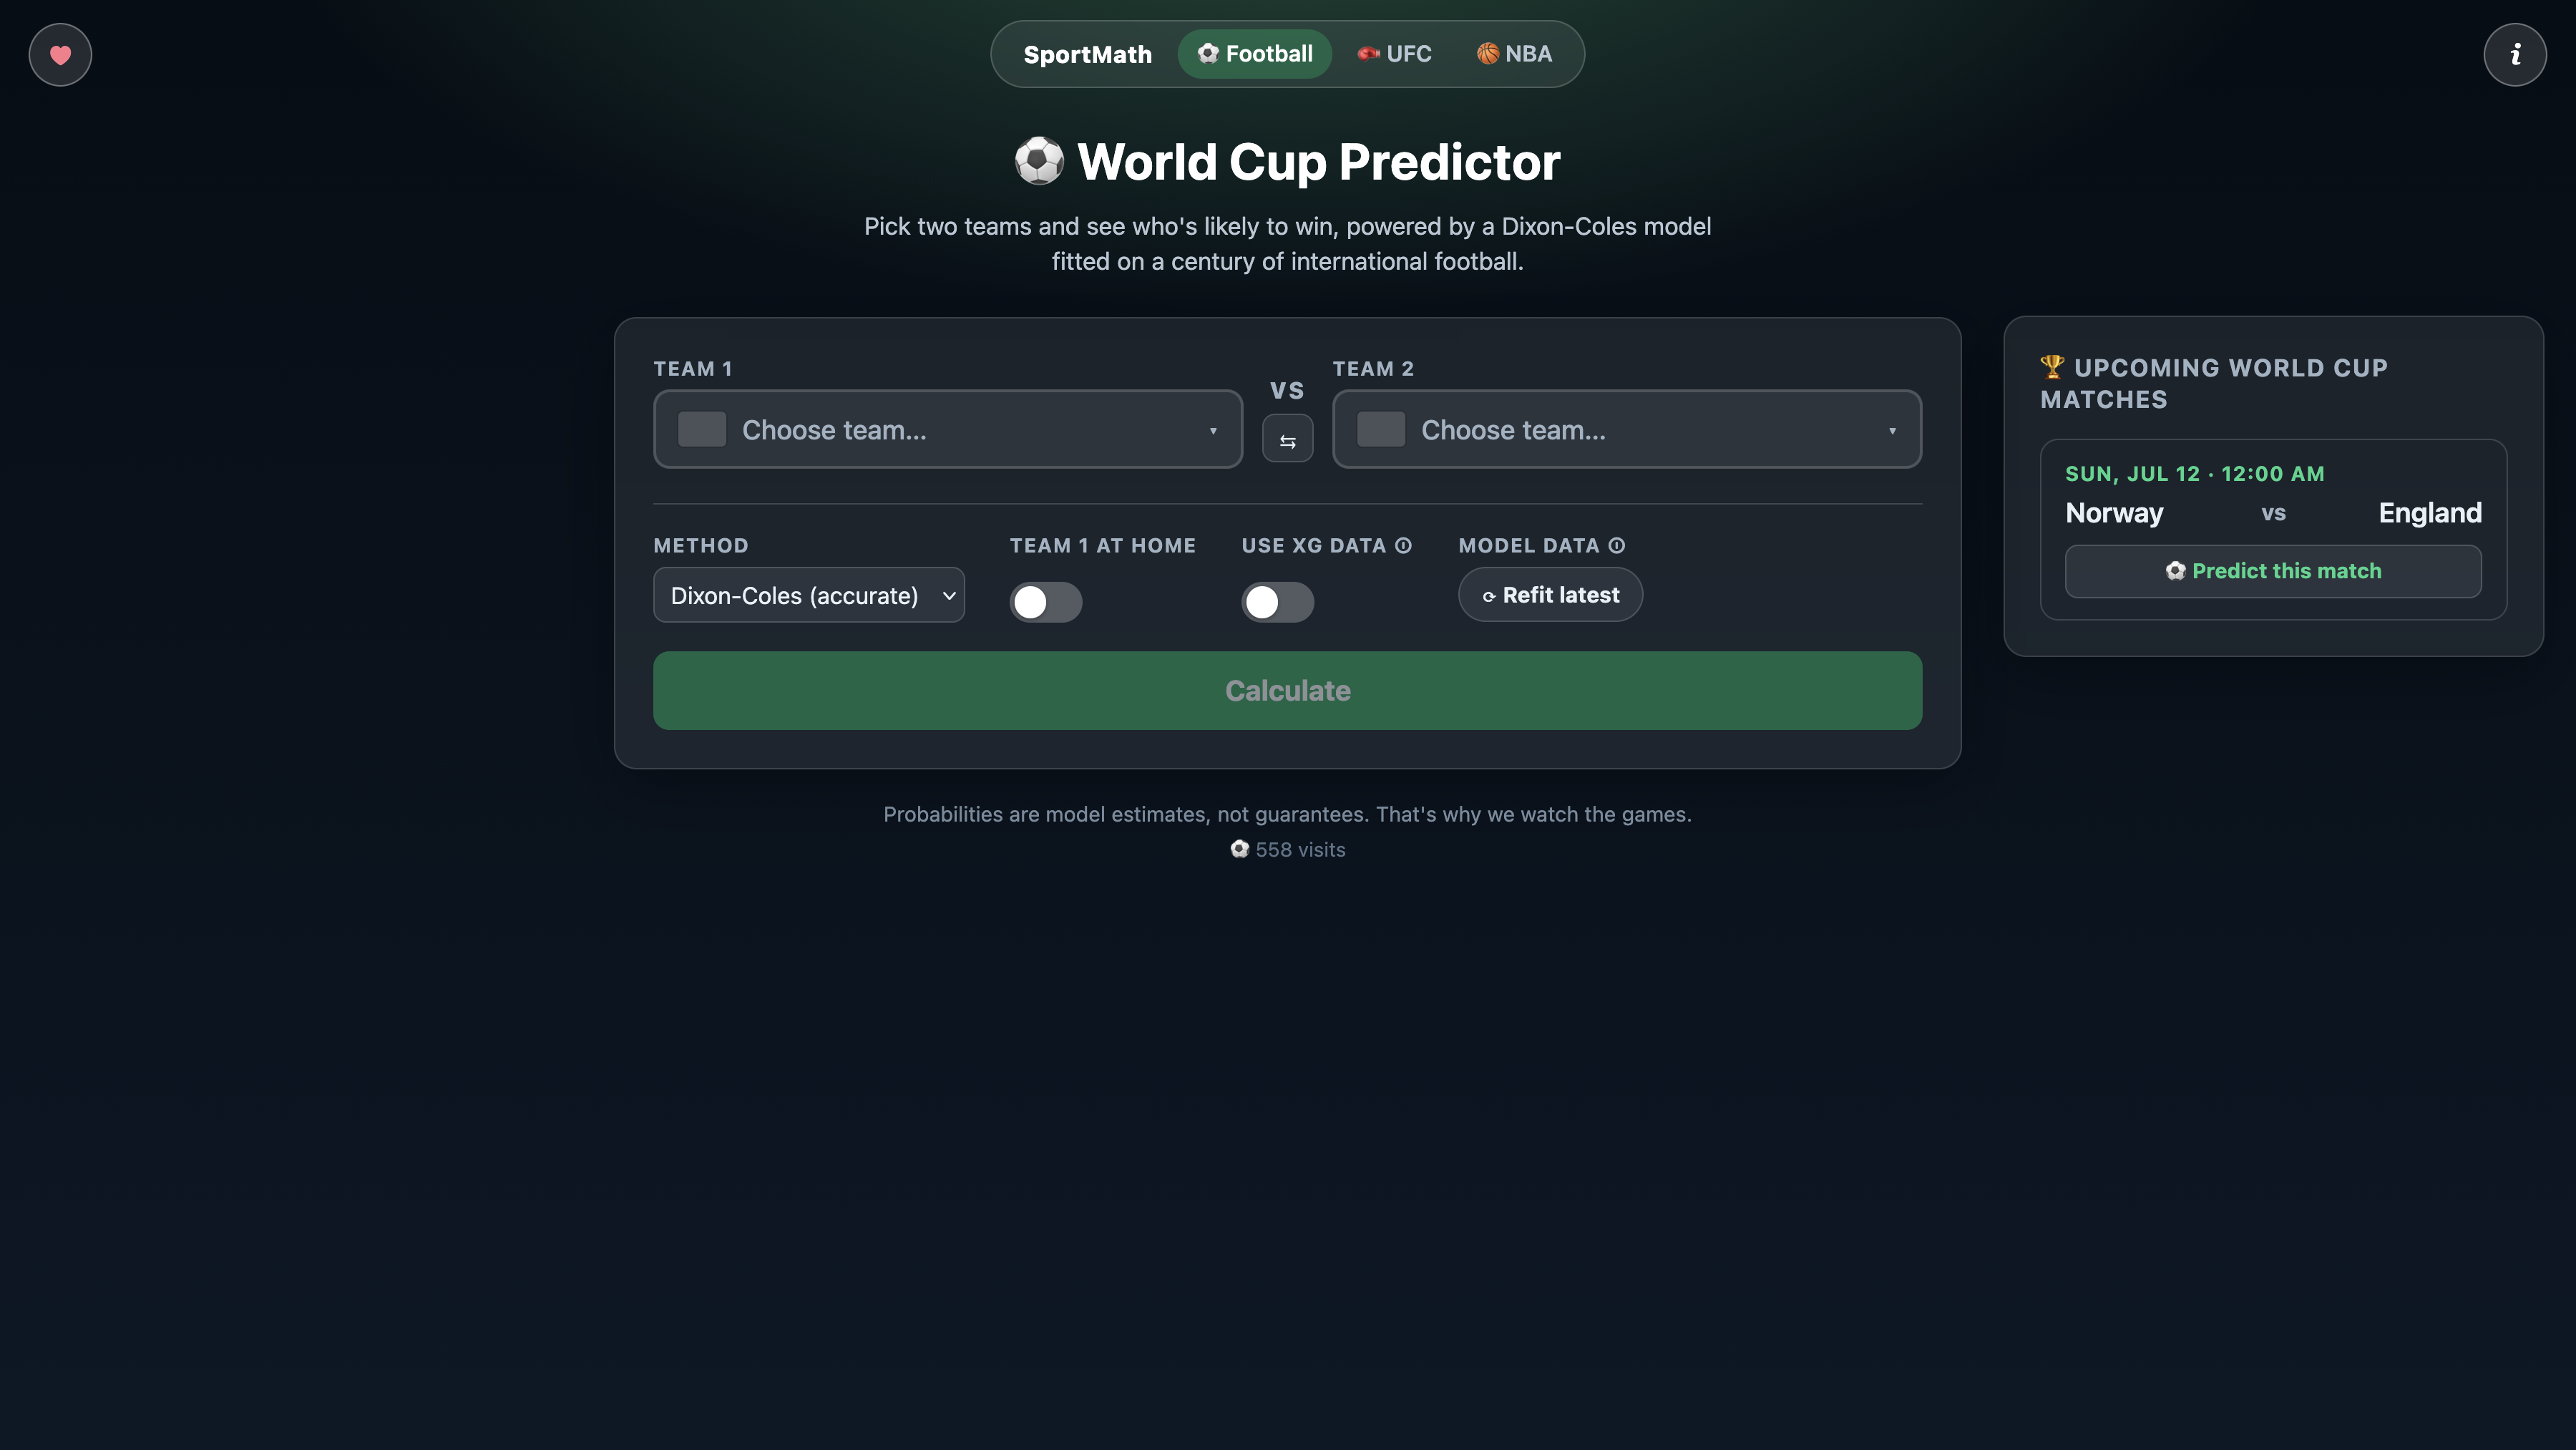
football calculation
-
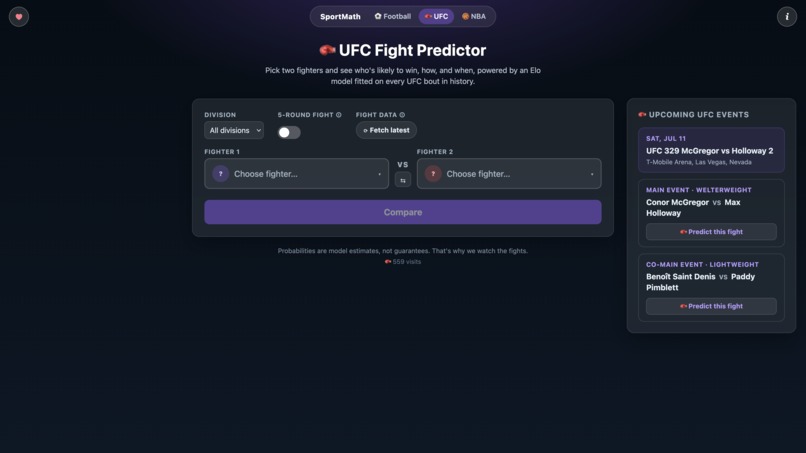
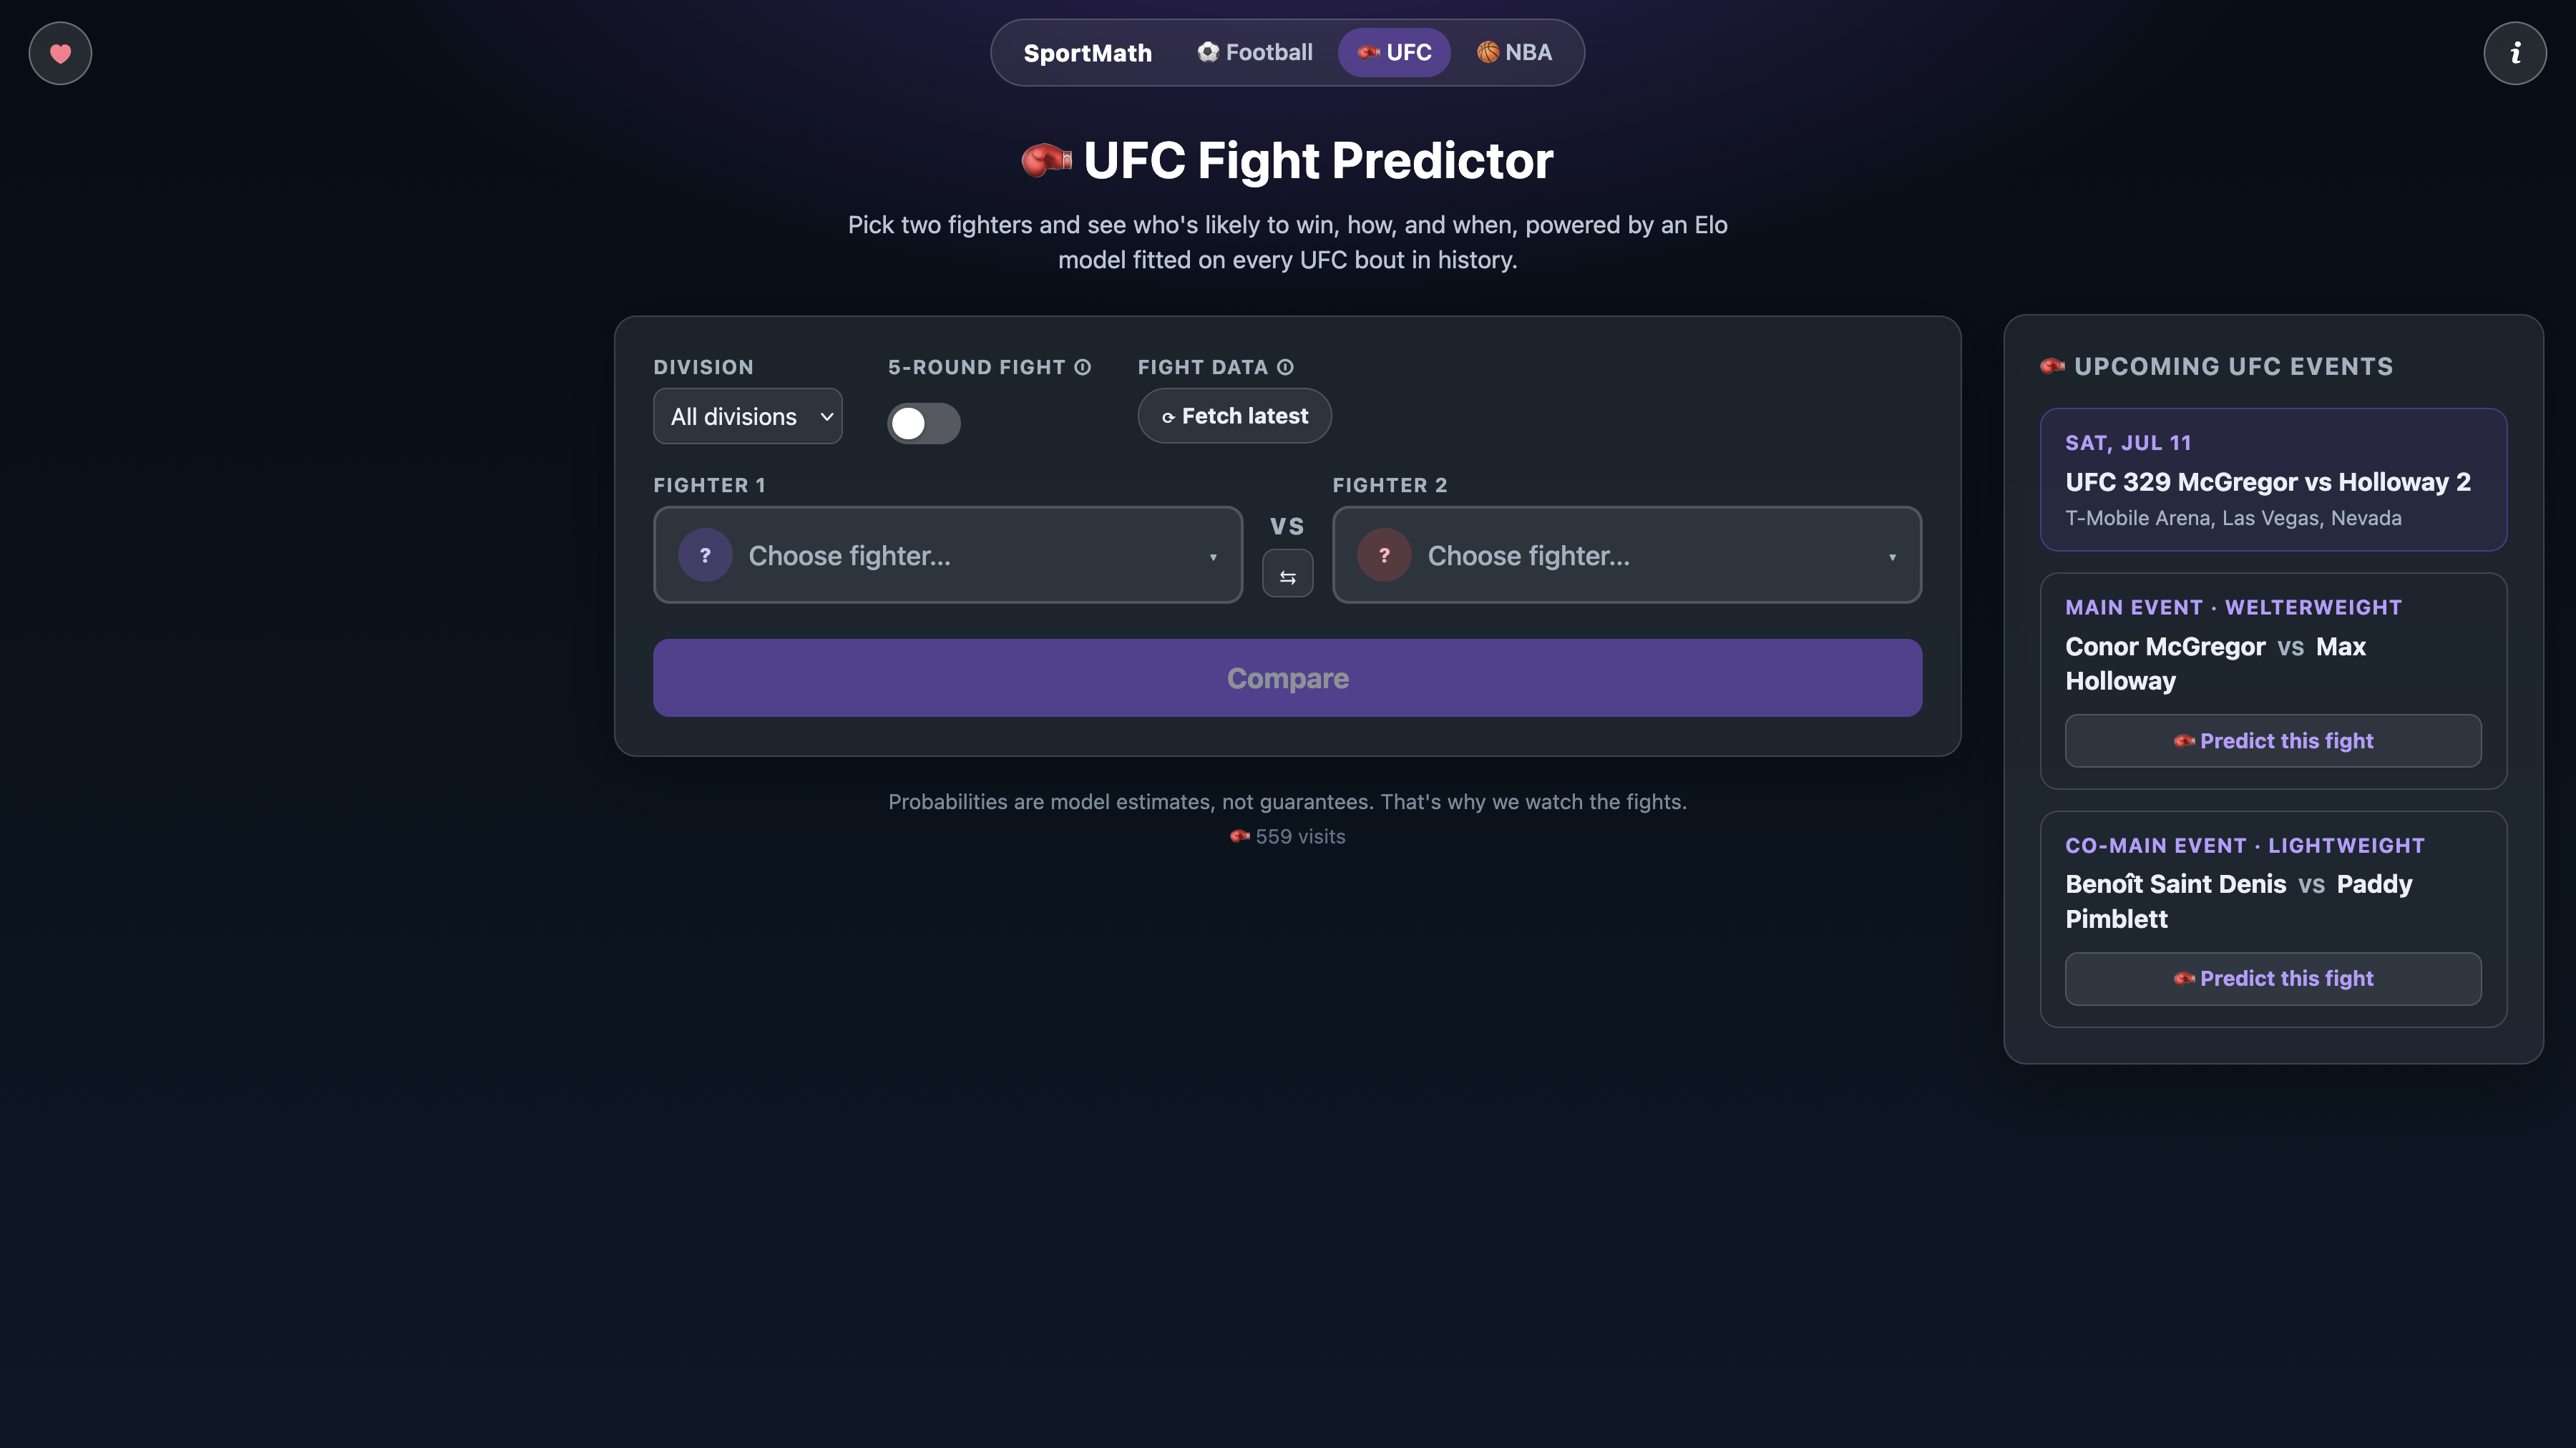
ufc page
-
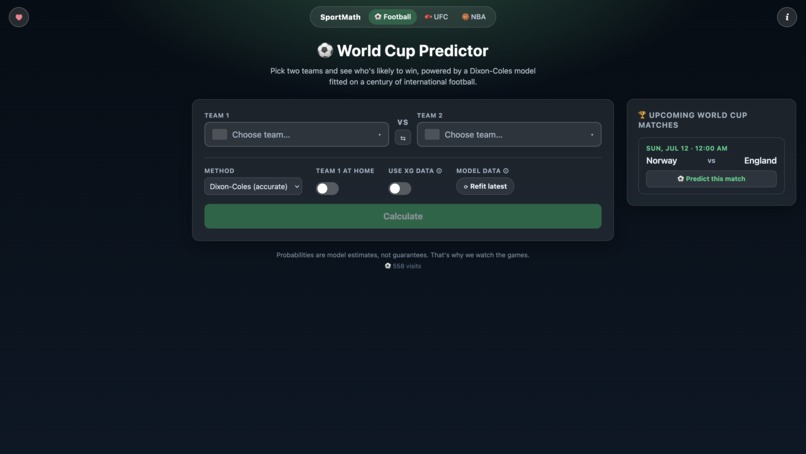
football page
-
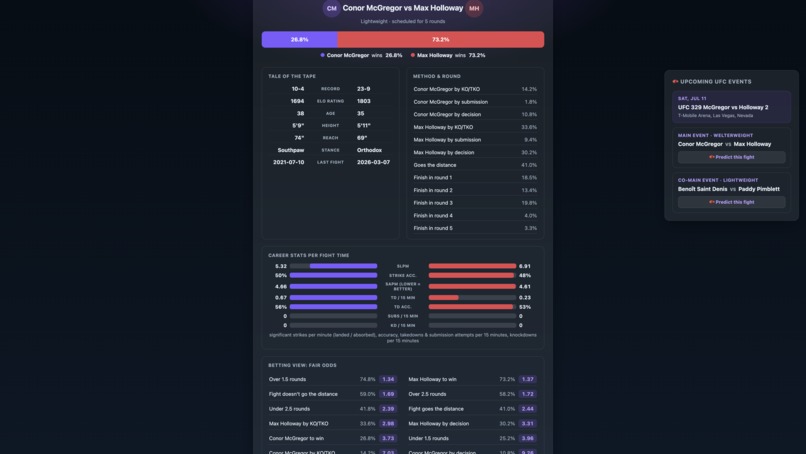
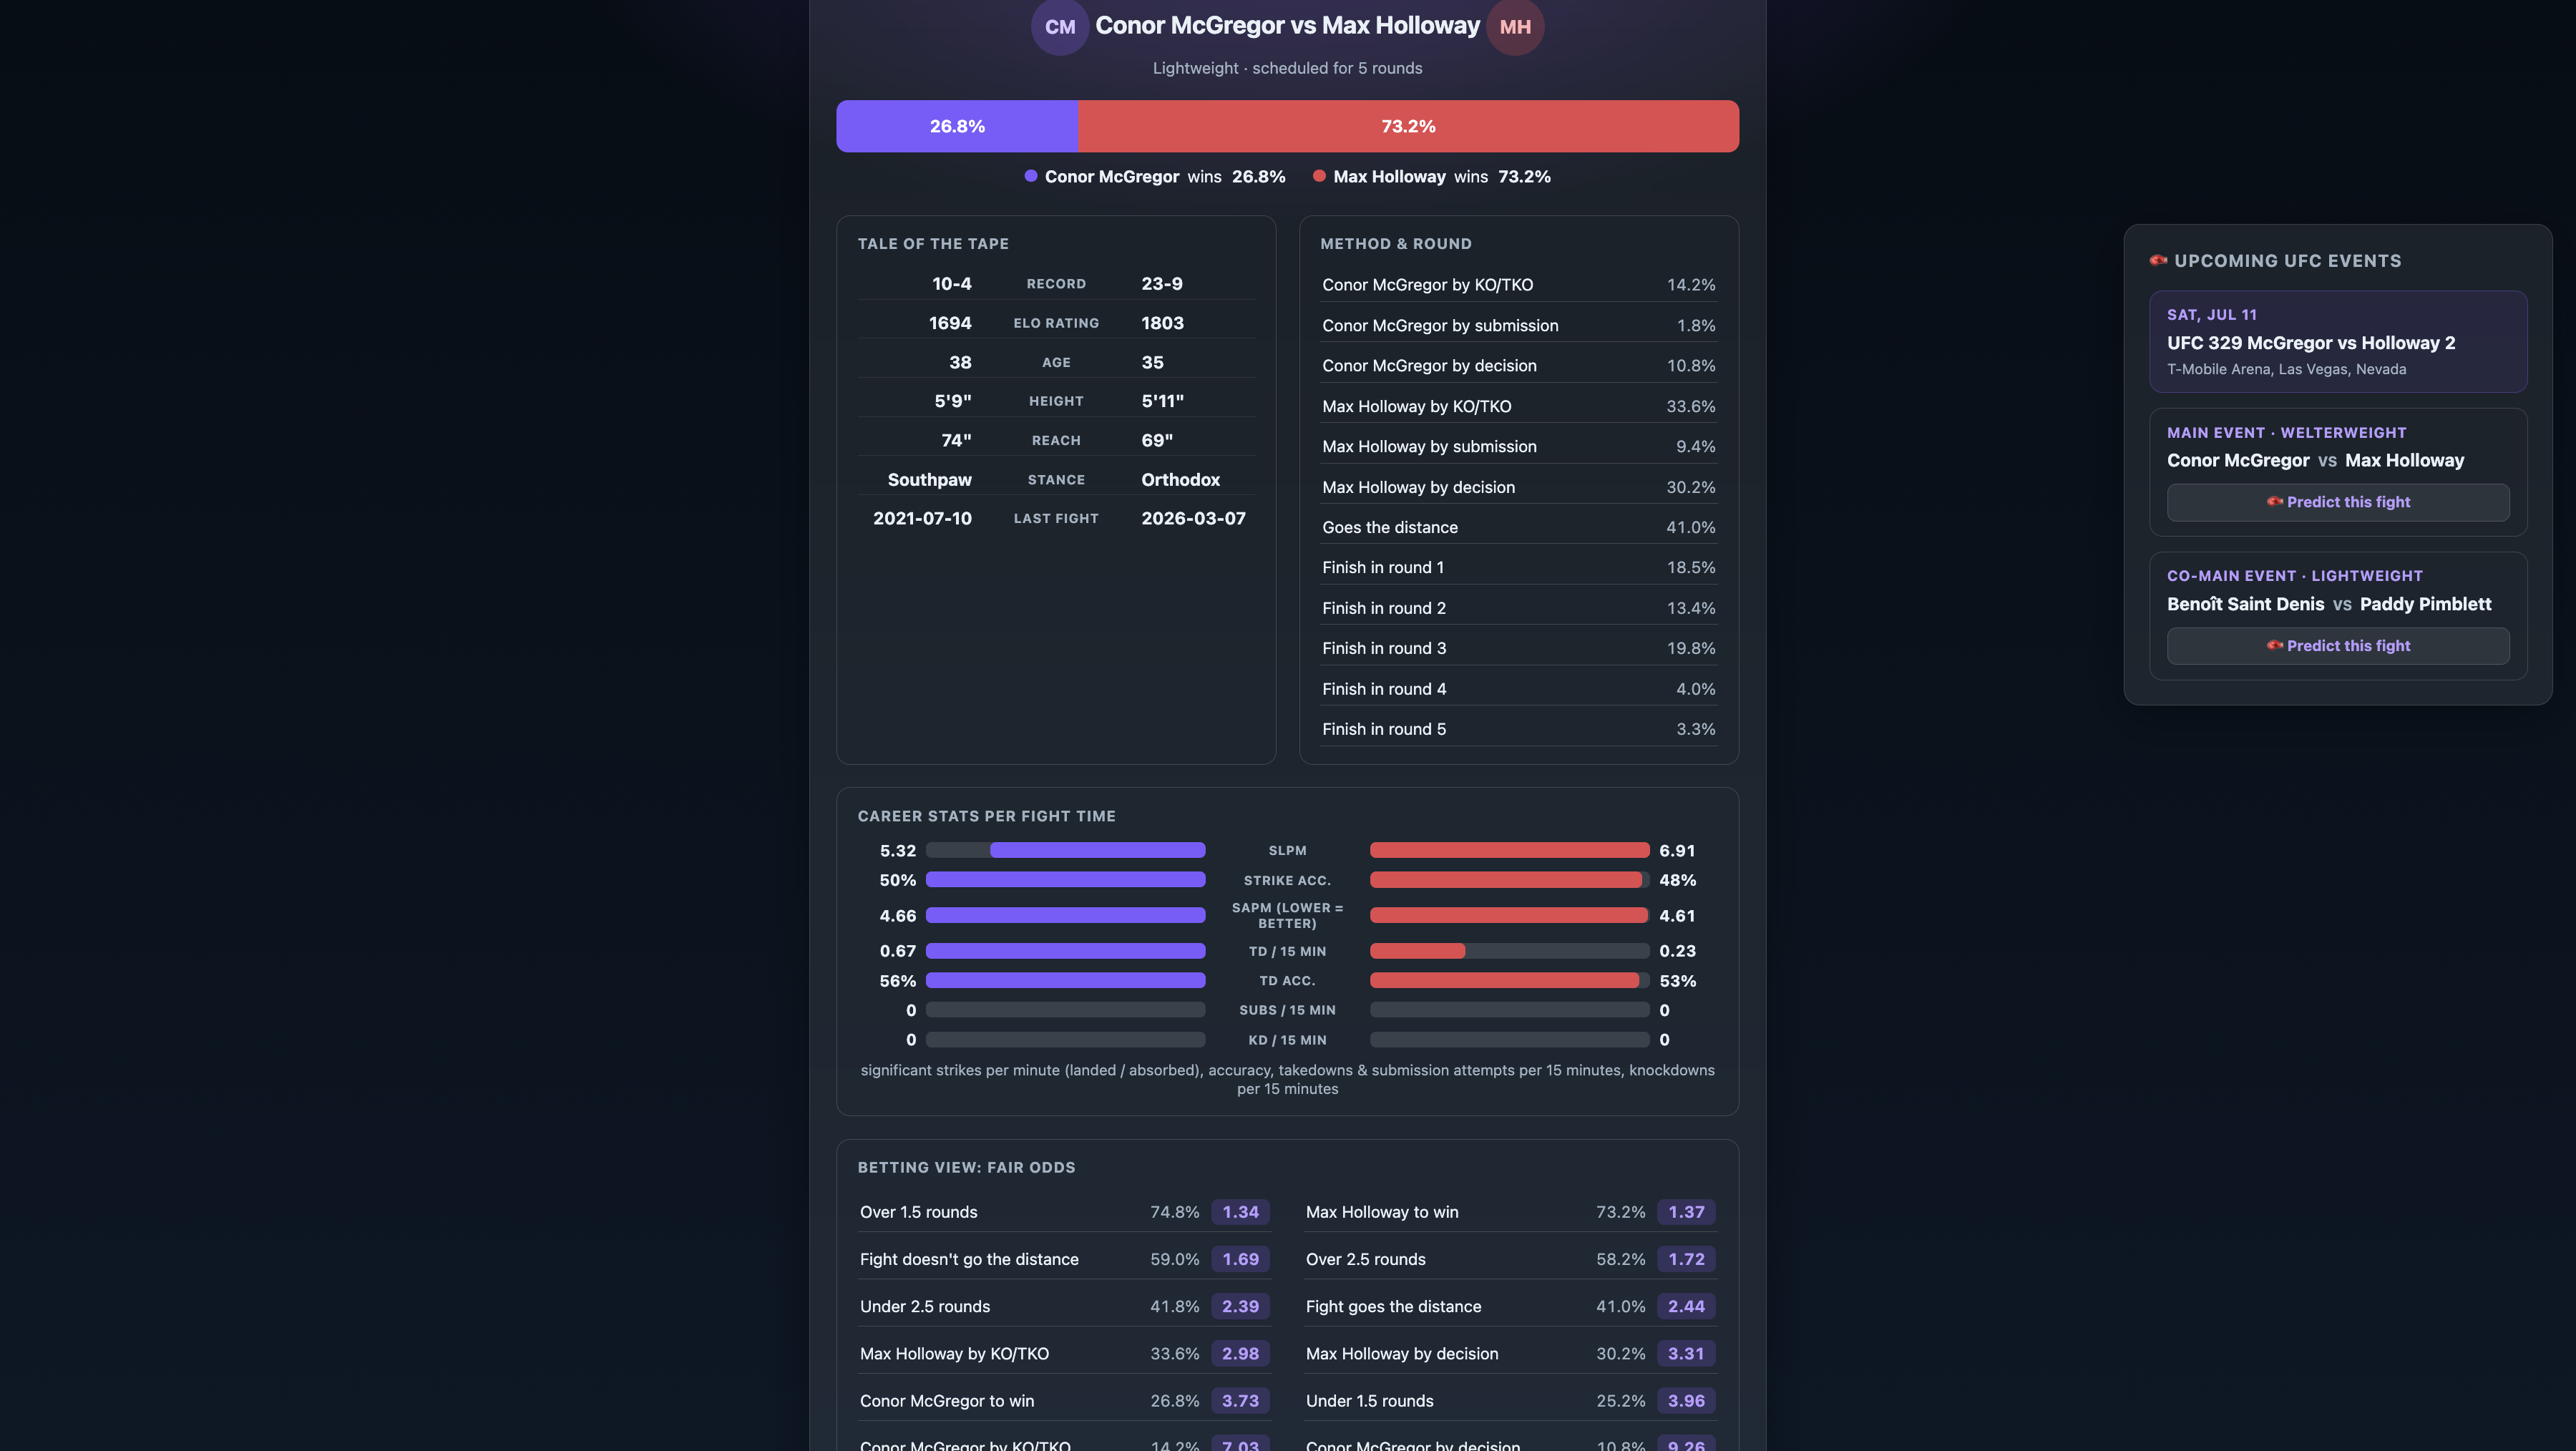
ufc calculation
SportMath - sports predictions from pure math
Probabilities, not opinions. SportMath turns decades of real results into honest win probabilities and fair odds for football, UFC and the NBA all computed live in your browser, with no server, no login and no bookmaker margin.
Inspiration
It started with a simple question: when a bookmaker offers odds, how much of that number is math and how much is margin? Sports arguments are usually opinions shouted louder, I wanted the version where a model, fitted on every result in history, quietly tells you what the numbers actually say. If a bookmaker offers 2.10 on a team the math prices at 2.30, you're on the wrong side of the price and you can only see that if someone shows you the fair price. That became the whole idea: strip the margin, show the math.
How I built it
The architecture is the same for all three sports: fit offline in Python, predict live in JavaScript. Each sport has a Python pipeline that downloads and caches historical results, fits the model, verifies it on games it has never seen, and exports the fitted parameters as a compact JS bundle. The site itself is plain HTML/CSS/JS on GitHub Pages, every prediction you see is computed in your own browser in milliseconds.
Football uses a Dixon-Coles Poisson model over 30,000+ international matches. Each team gets an attack and defence strength, and a match becomes two expected-goal rates:
$$\lambda_{home} = \mu \cdot att_{home} \cdot def_{away} \cdot \gamma_{home}$$
The joint scoreline distribution is Poisson with the Dixon-Coles low-score correction, which fixes the well-known problem that independent Poissons under-predict draws.
UFC runs a per-fighter Elo over 8,700+ bouts, where finishes move ratings more than decisions. The classic Elo expectation
$$E_A = \frac{1}{1 + 10^{(R_B - R_A)/400}}, \qquad R' = R + K(S - E_A)$$
is adjusted by fitted ring rust and age coefficients — but only because they survived a held-out backtest (more below). Method and round predictions blend each fighter's finish profile with how the opponent tends to lose, smoothed toward league base rates so a three-fight rookie doesn't show a 100% KO rate.
NBA fits an Elo with a margin-of-victory multiplier and home-court advantage over 30,666 games since 2002, with ratings pulled a quarter of the way back to average each summer (rosters change). The key design choice: the point margin is modelled as one normal curve,
$$M \sim \mathcal{N}(\beta \cdot \Delta Elo,\ \sigma), \qquad P(\text{win}) = \Phi!\left(\frac{\beta \cdot \Delta Elo}{\sigma}\right)$$
so the win probability, the fair spread and the victory-margin odds are all read off the same distribution and can never contradict each other. Everything converts to fair odds the same way: $odds = 1/p$, the break-even price before any margin is added.
What I learned
- Calibration beats cleverness. A model that says 70% should win about 70% of the time, log-loss, not accuracy, is the honest scoreboard.
- Backtest or it didn't happen. Every fitted constant (home-court advantage, Elo scale, ring-rust penalty) had to prove itself on held-out seasons. The NBA model picks the winner in 67% of 2,631 games it had never seen - against 55% for "just pick the home team" and roughly 68–70% for Vegas.
- Simple models go shockingly far. Elo plus one normal distribution gets within a few points of professional lines, if you fit it honestly.
- Shipping ML as static files is underrated. No server means no cost, no downtime and total privacy — the model is just data.
I used AI as a second pair of eyes to test that the math was correct - verifying that probabilities summed to one, the calibration held up and the backtest numbers were real.
Challenges I ran into
- Data sourcing is half the project. Official NBA endpoints blocked automated access entirely, and a promising free API silently truncated seasons to 15 games. I eventually found a public API with full history back to the 1990s and browser-friendly CORS so the same source powers both the offline fit and the live upcoming-games box.
- Overfitting temptation. Extra features (layoffs, age gaps) look great on training data. I only shipped the ones that improved log-loss on games the model had never seen — and threw away the ones that didn't.
- Small samples scream. A fighter with three wins, all by KO, is not a 100% KO machine. Pseudo-count smoothing toward league-wide base rates keeps the predictions sane.
- Internal consistency. Early versions could show a team as 60% to win while the margin table implied 55%. Deriving everything from a single fitted distribution eliminated that whole class of bug.
- The messy real world: franchise relocations, neutral-site games, draws existing in football but not basketball, seasons interrupted mid-fit — each needed explicit handling.
🚀 What's next
Formula 1 is the next candidate, pole and podium probabilities from a driver-plus-constructor rating, which means adapting the head-to-head machinery to a 20-car grid. The math is ready, the season never stops.
Built With
- html5
- javascript
- json
- logistic-regression
- machine-learning
- monte-carlo-simulation
- poisson-distribution
- probability
- python


Log in or sign up for Devpost to join the conversation.