-
-
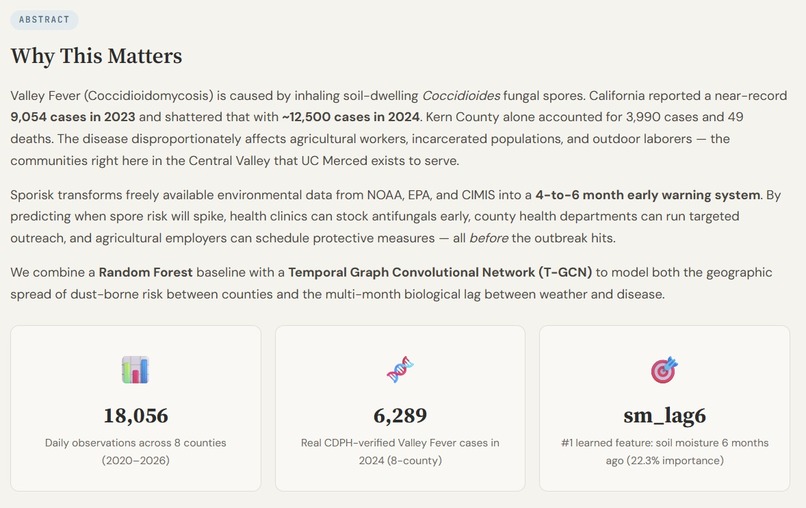
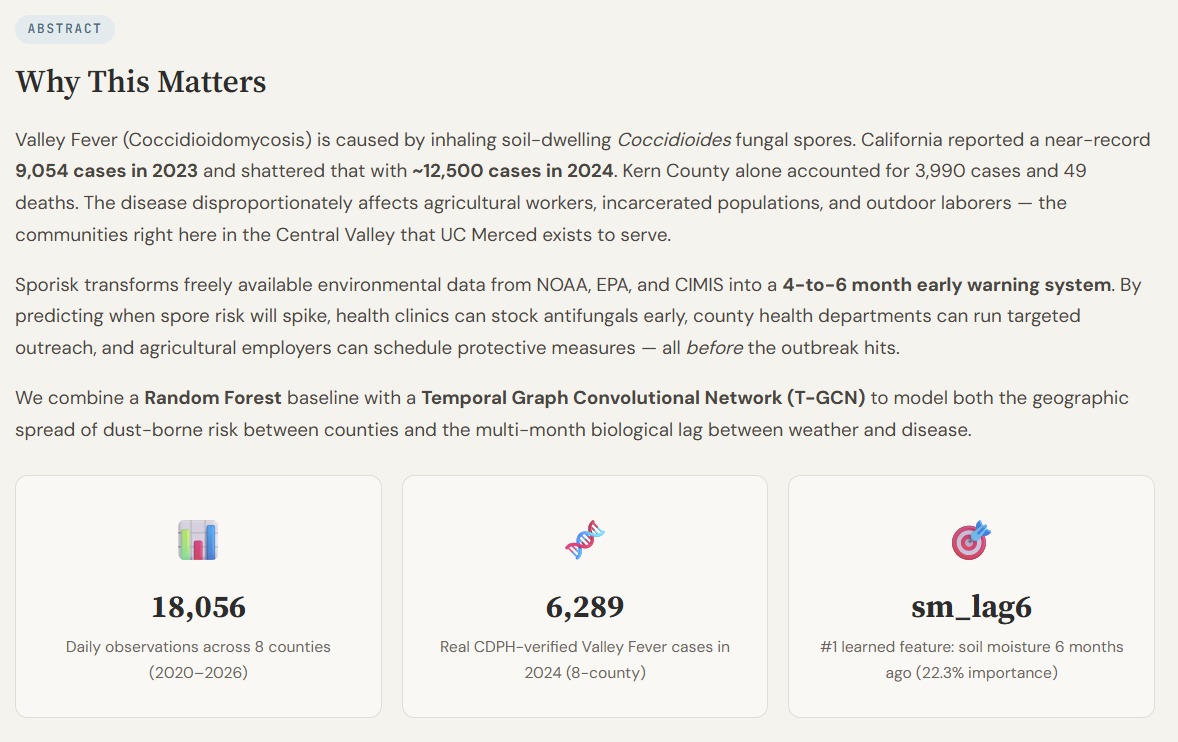
Abstract of our "Working Theory" Paper: Explains the science behind 'valley fever' and our prediction algorithm
-
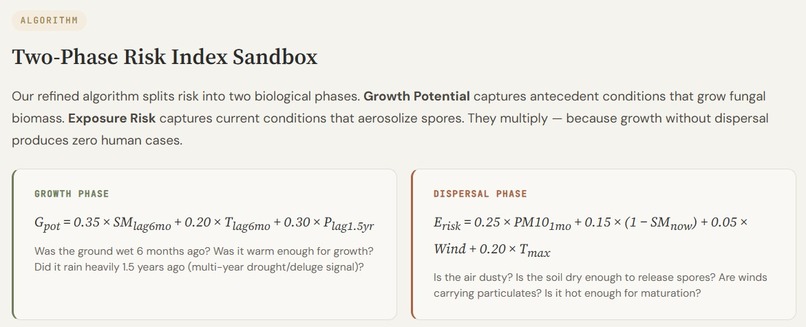
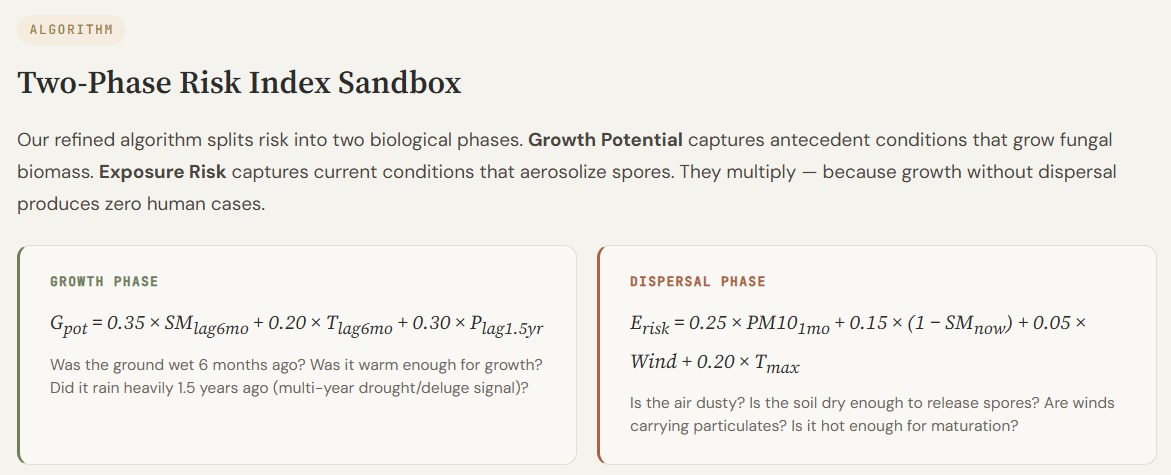
Two-phase index: G_pot encodes fungal growth conditions; E_risk captures aerosolization. Their product drives infection risk.
-
 GIF
GIF
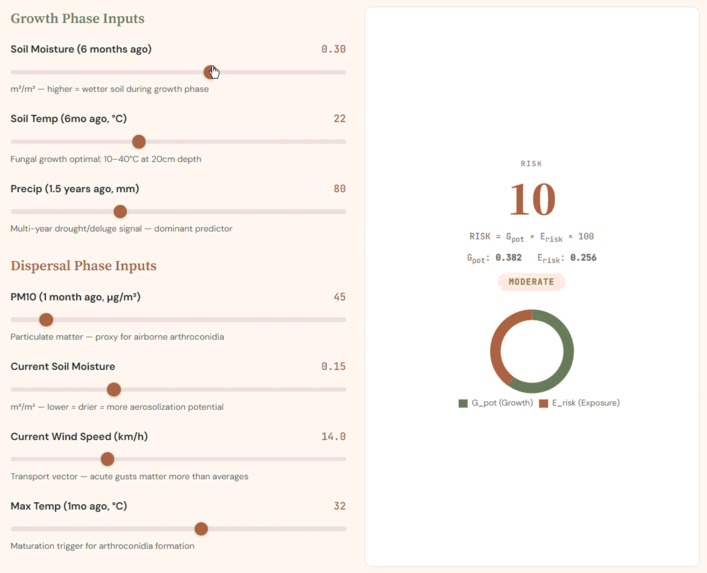
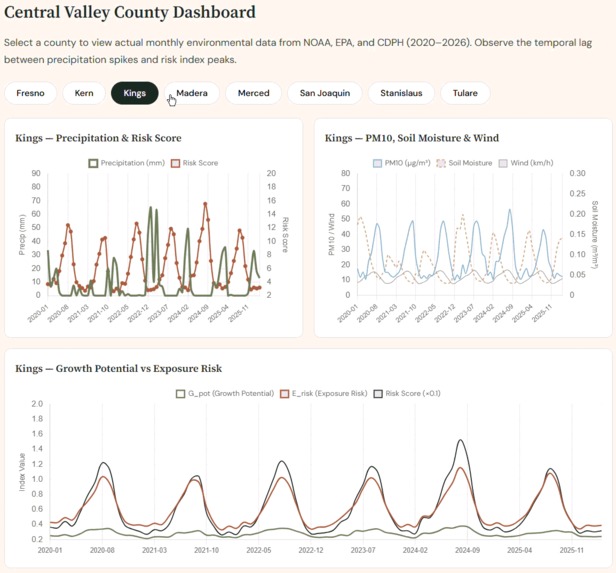
Dynamic risk model: toggling Growth and Dispersal inputs recalibrates Sporisk, decomposing probability into risk factors.
-
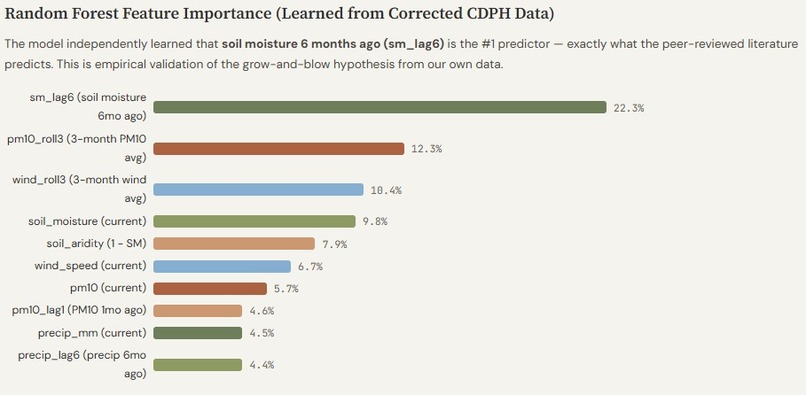
Model independently ranked sm_lag6 (22.3%) as #1 predictor — matching peer-reviewed literature without prior specification.
-
 GIF
GIF
Interactive real county-by-county dashboard
-
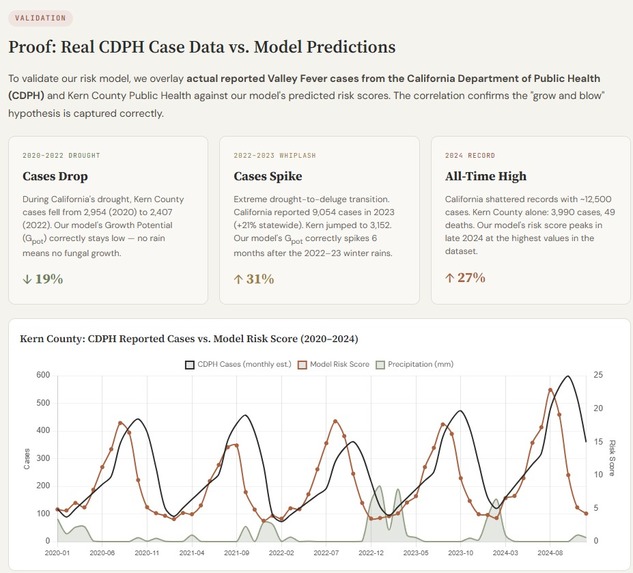
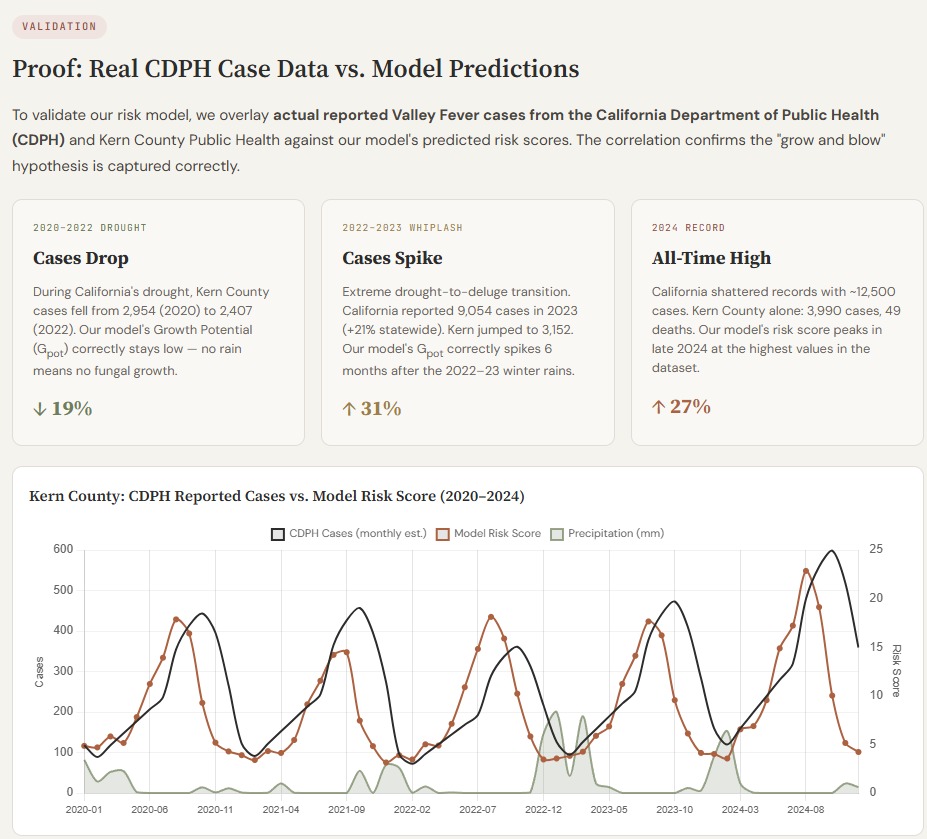
Sporisk risk scores lead real CDPH Valley Fever cases, correctly capturing the 2022–23 whiplash spike and 2024 all-time record.

Try it out --> https://sporisk-main.vercel.app/
Inspiration
Valley Fever is one of California's most underdiagnosed public health crises. In 2024, the state reported a record ~12,500 cases — Kern County alone saw 3,990 cases and 49 deaths. Yet most people living in the shadow of the San Joaquin Valley dust have never heard of it. The disease disproportionately strikes farmworkers, incarcerated individuals, and outdoor laborers — the exact communities UC Merced was founded to serve. We asked ourselves: could freely available environmental data predict a disease that's largely invisible to the public? SporeRisk started there.
What it does
SporeRisk is an AI-powered early warning system that predicts Valley Fever (Coccidioidomycosis) outbreak risk 4–6 months in advance across 8 Central Valley counties. But prediction alone doesn't save lives — so we built a full-stack public health platform around it.
🎯 Open the app → see your risk. GPS auto-detects your county and displays your real-time risk index instantly. Below the score, live environmental stats — wind speed, soil moisture, PM10 dust levels, temperature — are pulled from Open-Meteo at request time.
🧠 AI explains why. Gemini 2.0 Flash translates raw numbers into plain-English bullet points — "Wind speeds are elevated at 28 km/h, increasing spore dispersal" — styled after Apple notification summaries so anyone can understand them without a science background.
🗺️ Explore any county. Browse all 8 tracked counties, view historical risk trends back to 2020, and see 4–6 month forward forecasts from both our Random Forest and T-GCN models.
💬 Ask for help. A Gemini-powered health chatbot answers questions like "where's the nearest pharmacy with antifungals?" or "I'm working outdoors in Kern County — what precautions should I take?" with localized, actionable Central Valley guidance.
🔄 Always current. An auto-refresh scheduler monitors NOAA, EPA AQS, and CDPH for new data releases on staggered cadences, incrementally scrapes new records, retrains both models, and updates predictions — no manual intervention required.
Health clinics can stock antifungals early. County departments can run targeted outreach. Agricultural employers can protect workers. All before the outbreak hits.
How we built it
The system has three layers: a machine learning prediction engine, a live API backend, and a generative AI interpretation layer.
Prediction Engine
We built a two-model pipeline in Python trained on 18,056 daily observations from 2020–2026 across 8 counties.
Model 1 — Random Forest (200 trees, 16 hand-engineered lag features) serves as our interpretable baseline using Leave-One-County-Out cross-validation to prove spatial generalization.
Model 2 — Temporal Graph Convolutional Network (T-GCN) combines a Graph Neural Network (spatial: how risk propagates between neighboring counties via real geographic adjacency edges) with a GRU (temporal: how weather months ago drives cases today, learned automatically from raw sequences).
The risk index follows a two-phase biological formula grounded in the Coccidioides lifecycle:
$$ \text{Risk} = G_{\text{pot}} \times E_{\text{risk}} $$
Where Growth Potential encodes antecedent moisture and temperature conditions:
$$ G_{\text{pot}} = 0.35 \times SM_{\text{lag6mo}} + 0.20 \times T_{\text{lag6mo}} + 0.30 \times P_{\text{lag1.5yr}} $$
And Exposure Risk encodes current dispersal conditions:
$$ E_{\text{risk}} = 0.25 \times PM10_{1\text{mo}} + 0.15 \times (1 - SM_{\text{now}}) + 0.05 \times \text{Wind} + 0.20 \times T_{\text{max}} $$
Weights are derived from published Multivariable Negative Binomial Regression incidence rate ratios. The multiplicative structure enforces a key biological constraint: high fungal growth with no dispersal mechanism = zero human risk.
Live API Backend
A FastAPI server exposes 7 REST endpoints:
GET  /risk?lat=&lon=       → auto-detect county, return risk + live weather + AI summary
GET  /risk/{county}        → risk index for a specific county
GET  /counties             → all 8 counties with latest risk levels
GET  /history/{county}     → monthly historical data (2020–2026)
GET  /forecast/{county}    → 4–6 month predictions (RF + T-GCN)
GET  /summary/{county}     → Gemini-generated plain-English risk explanation
POST /chat                 → health resource chatbot
Live environmental conditions (temperature, wind, PM10, precipitation) are fetched from Open-Meteo at request time — the same source our scraper uses for training data, ensuring consistency between what the model learned and what the user sees.
Generative AI Layer
Gemini 2.0 Flash powers three capabilities:
- Risk summaries — translates raw environmental data + model predictions into 3–5 concise bullet points
- Health chatbot — answers localized questions about pharmacies, antifungals, prevention, symptoms
- Contextual advice — adapts recommendations based on current risk level and county
Every Gemini endpoint includes a rule-based fallback so the system degrades gracefully if the API is unavailable.
Auto-Refresh Pipeline
A daemon scheduler polls data sources on staggered cadences:
- Open-Meteo (weather) — every 12h, incremental append
- EPA AQS (PM10) — weekly, yearly bulk file detection
- CDPH (cases) — monthly, file hash change detection
When new data is detected → incremental scrape → data_collector.py re-standardizes → both models retrain → prediction CSVs update → API auto-reloads. Zero manual intervention.
Challenges we ran into
The biggest challenge was the data. CDPH reports Valley Fever case counts annually, not monthly — so we disaggregated them using published seasonal distribution curves (Aug–Nov accounts for ~60% of cases) to generate monthly training targets. EPA air quality monitoring has significant gaps across rural counties, requiring per-county forward-fill imputation and outlier clipping at physical bounds ( \( 0 \leq \text{PM10} \leq 600 \; \mu g/m^3 \) ).
Encoding the multi-year biological lag — where precipitation 1.5 years prior ( \( P_{t-548} \) ) is a dominant predictor — required feature engineering well beyond standard lag windows. Validating the T-GCN's spatial graph structure across 8 counties with real geographic adjacency edges also added meaningful complexity under hackathon time pressure.
On the platform side, building a self-updating pipeline that gracefully handles partial data (EPA files drop quarterly, CDPH annually, weather daily) without breaking the prediction chain required careful state management and incremental scraping logic — every data source has a different release cadence and failure mode.
Accomplishments that we're proud of
🔬 Our model cracked the #1 driver of Valley Fever on its own.
Without being told, our Random Forest ranked sm_lag6 — soil moisture from 6 months prior — as the single most important predictor at 22.3% feature importance. This directly mirrors what peer-reviewed MNBR studies ( \( \beta = 1.9 \) , adjusted IRR) identify as the dominant biological driver of Coccidioides biomass growth. Wet soil feeds fungal hyphal proliferation; when that soil dries months later, it releases a primed reservoir of airborne arthroconidia. The model learned the biology from data alone.
📈 Our predictions line up with history.
When we overlaid SporeRisk's risk scores against real CDPH-reported case counts for Kern County (2020–2024), the match was striking. During the 2020–2022 drought, \( G_{\text{pot}} \) correctly stayed suppressed — no rain, no fungal bloom, cases fell 19%. Then came the 2022–23 drought-to-deluge whiplash: risk scores spiked 6 months after the winter rains, precisely as cases surged 31% to a near-record 9,054 statewide. In 2024, SporeRisk reached its highest risk values in the entire dataset — and California shattered all records with ~12,500 cases. The model didn't just fit the data. It reproduced the outbreak timeline.
🚀 We built a deployable platform, not just a model.
7 API endpoints, live environmental data integration, Gemini-powered natural language risk summaries, a health resource chatbot with graceful fallbacks, and a self-updating pipeline that keeps the system current without human intervention — built in a single hackathon weekend. The result isn't a Jupyter notebook. It's a public health tool.
What we learned
Domain knowledge is irreplaceable in machine learning. The 4–6 month biological lag between soil conditions and human infection isn't something a model discovers on its own — you have to encode the biology first. The relationship \( P_{t-18} \rightarrow S_{t-6} \rightarrow D_{t} \rightarrow \text{Cases}_{t} \) (precipitation grows fungi, soil moisture sustains them, dust disperses them, humans inhale them) had to be manually engineered into our feature set before any model could learn it.
We also learned how much messier real public health data is compared to textbook datasets: case counts are aggregated at the wrong granularity, air quality sensors are sparse in the exact rural counties that need them most, and ground truth is often estimated from incidence rates rather than directly observed. Building robust imputation and validation pipelines around this messiness was as important as the ML itself.
Most importantly, the communities most at risk from Valley Fever — agricultural workers and rural residents of the Central Valley — are also the least served by existing health surveillance tools. That asymmetry made every line of code feel urgent, and it's why we built SporeRisk as a live, self-updating platform rather than a static analysis.
What's next for Sporisk
The backend is live. The auto-refresh scheduler is running. The immediate next step is deploying the mobile-first frontend so Central Valley residents can check their risk index, browse forecasts, and chat with our health assistant from their phones.
Beyond that, we aim to:
- Expand to Arizona and New Mexico, where Valley Fever is endemic and rising
- Partner with Kern and Merced County public health departments to pilot SporeRisk as a clinical decision support tool — enabling early antifungal stocking, targeted farmworker outreach, and construction site dust mitigation driven by predictive rather than reactive surveillance
- Integrate real-time CDPH case reporting as it becomes available to close the feedback loop between predictions and outcomes
As climate change intensifies drought-deluge cycles and pushes Coccidioides habitat northward at an estimated 800 km by 2100, tools like SporeRisk become essential public health infrastructure — not just research prototypes. Our goal is to put this directly in the hands of the communities who need it most, where a 4-month warning isn't just useful. It saves lives.
Built With
- california-department-of-public-health
- claude
- docker
- epa-aqs
- fastapi
- gated-recurrent-unit
- gemini
- geminiapi
- github
- googlegenerative-ai-sdk
- graph-neural-network
- javascript
- numpy
- open-meteo-forecast
- pandas
- python
- randomforest
- react
- scikit-learn
- t-gcn
- uvicorn


Log in or sign up for Devpost to join the conversation.