-
-

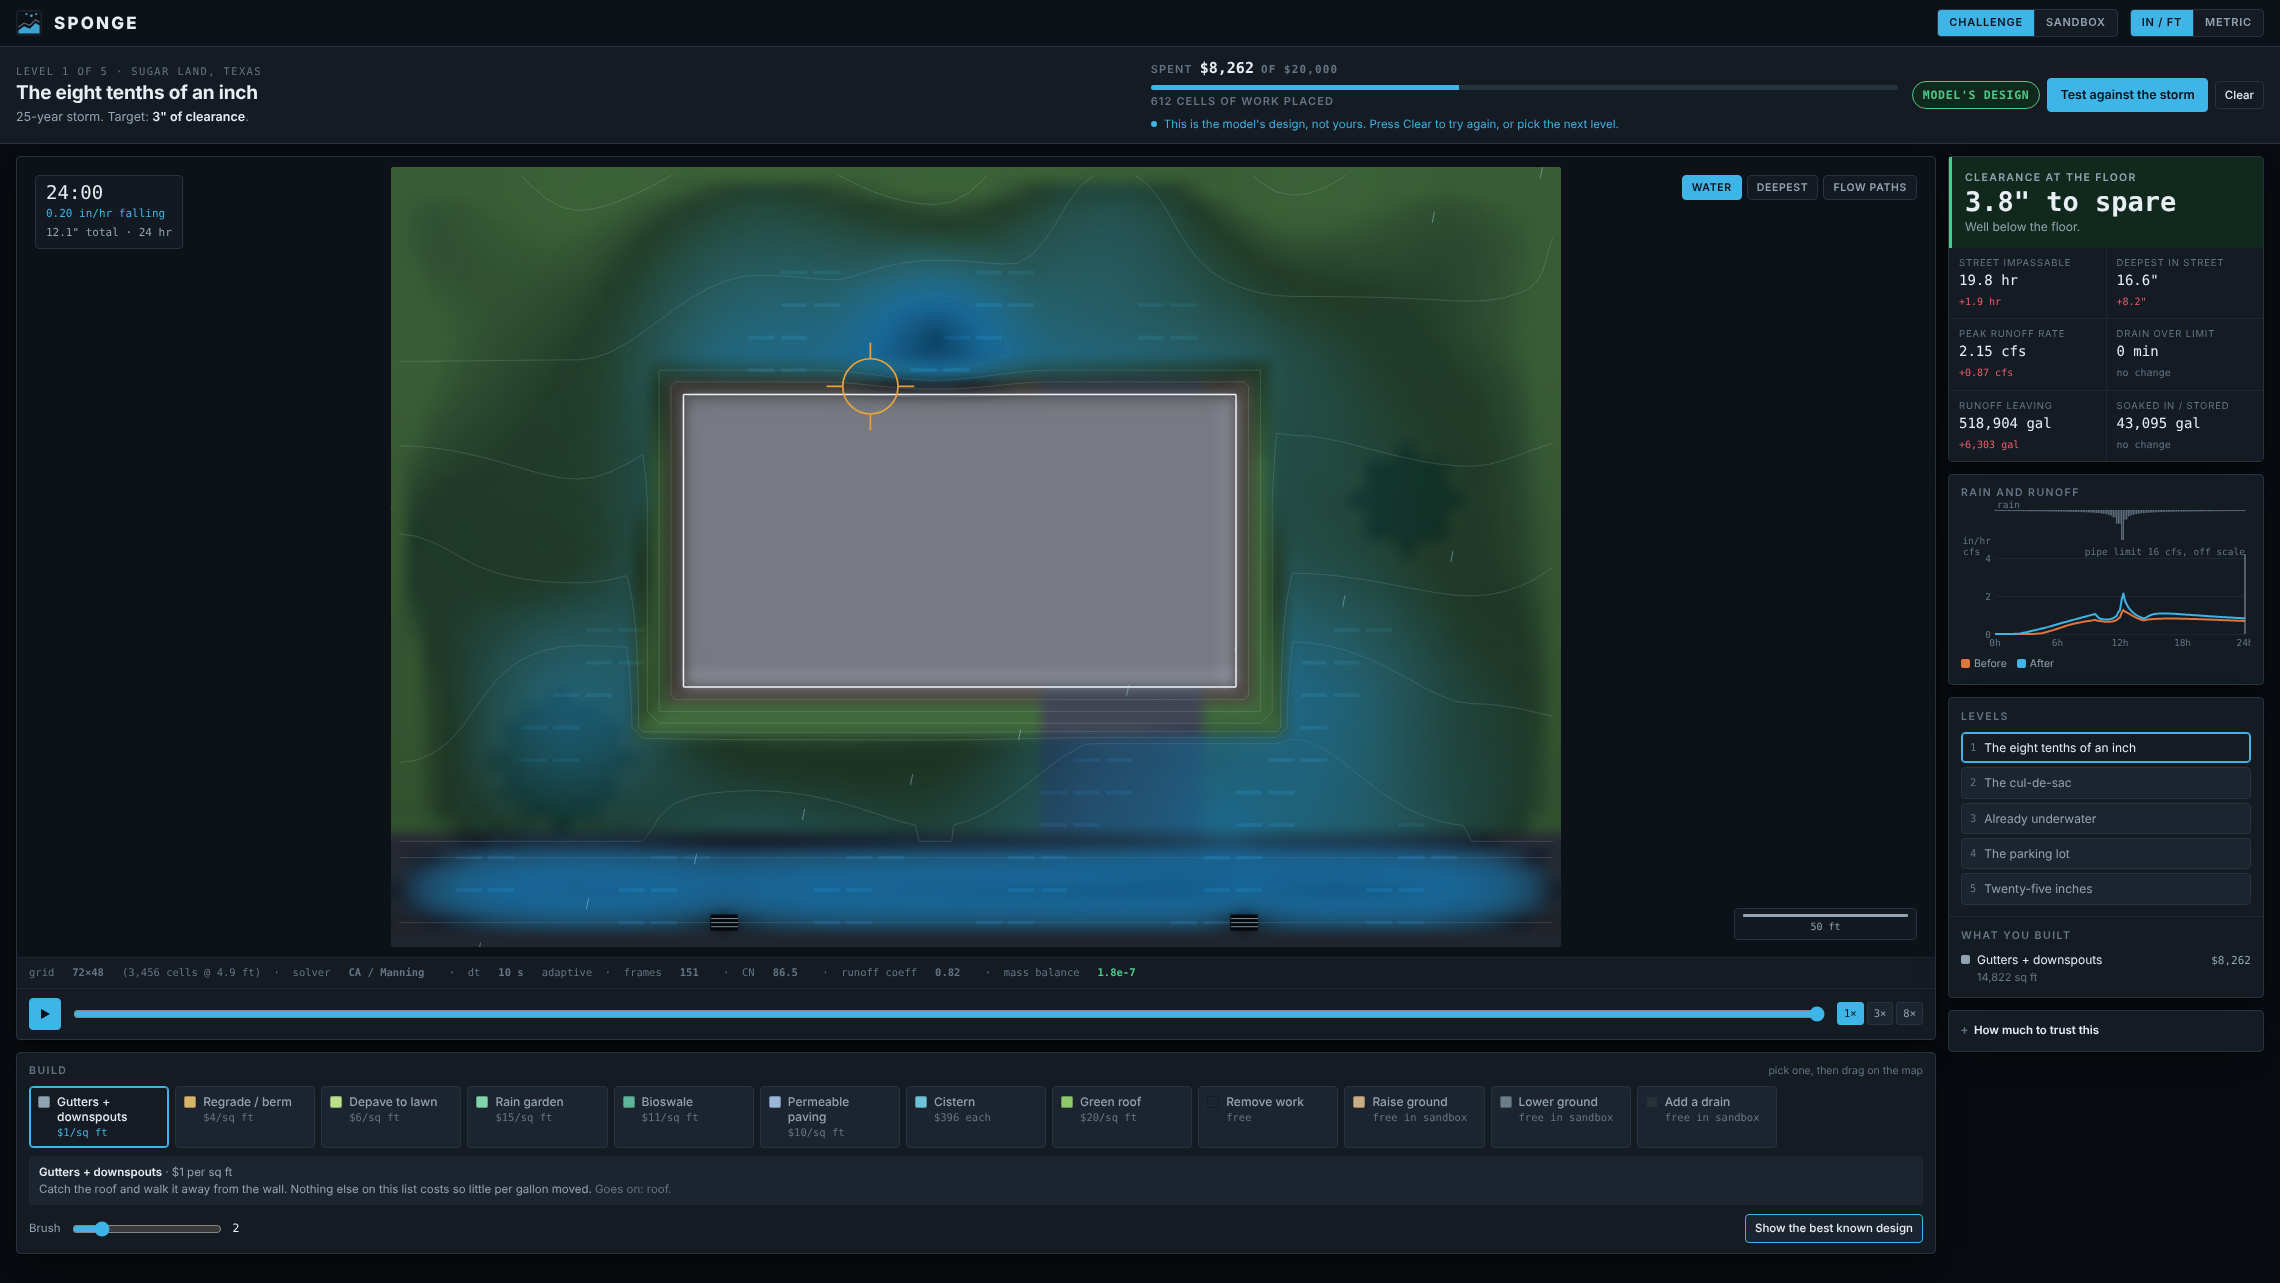
A one-storey slab house in Sugar Land. In a 25-year storm the water stops 0.80 inches below the finished floor.
-
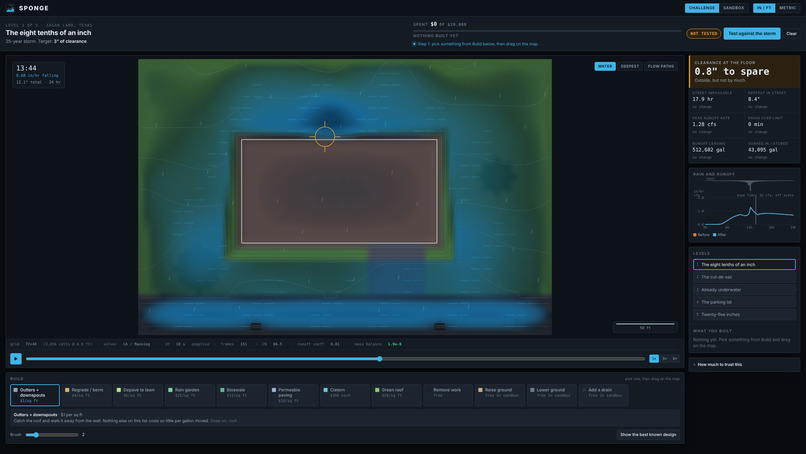
Mid-storm. Water collects along the uphill wall of the house and fills the street gutter until the pipe cannot keep up.
-
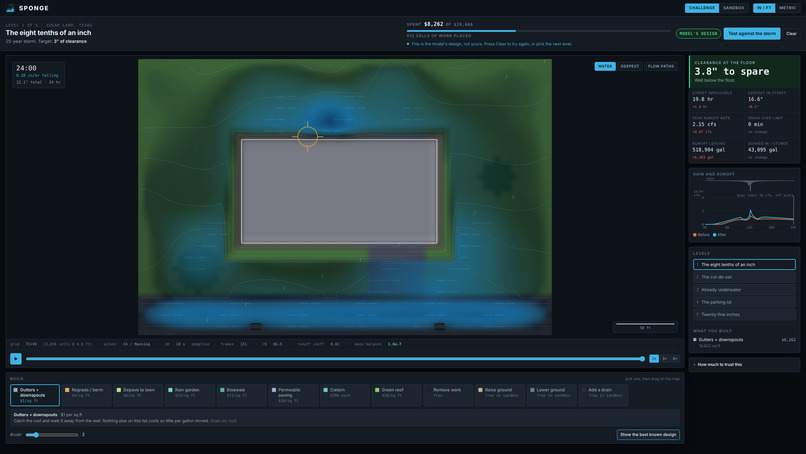
The model's answer: $8,262 of gutters takes the clearance from 0.80 inches to 3.8. Not the expensive landscaping.
-
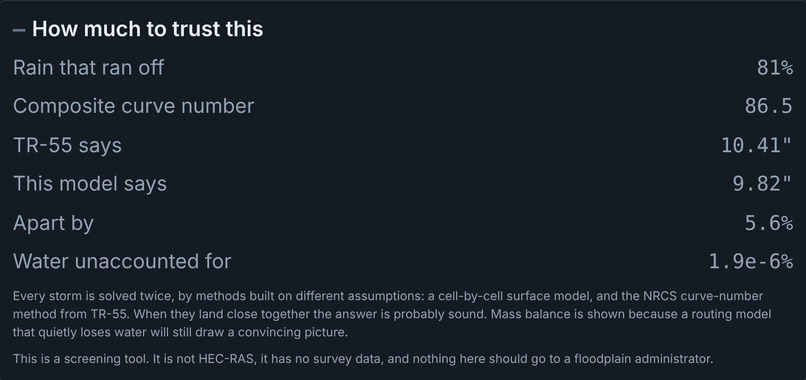
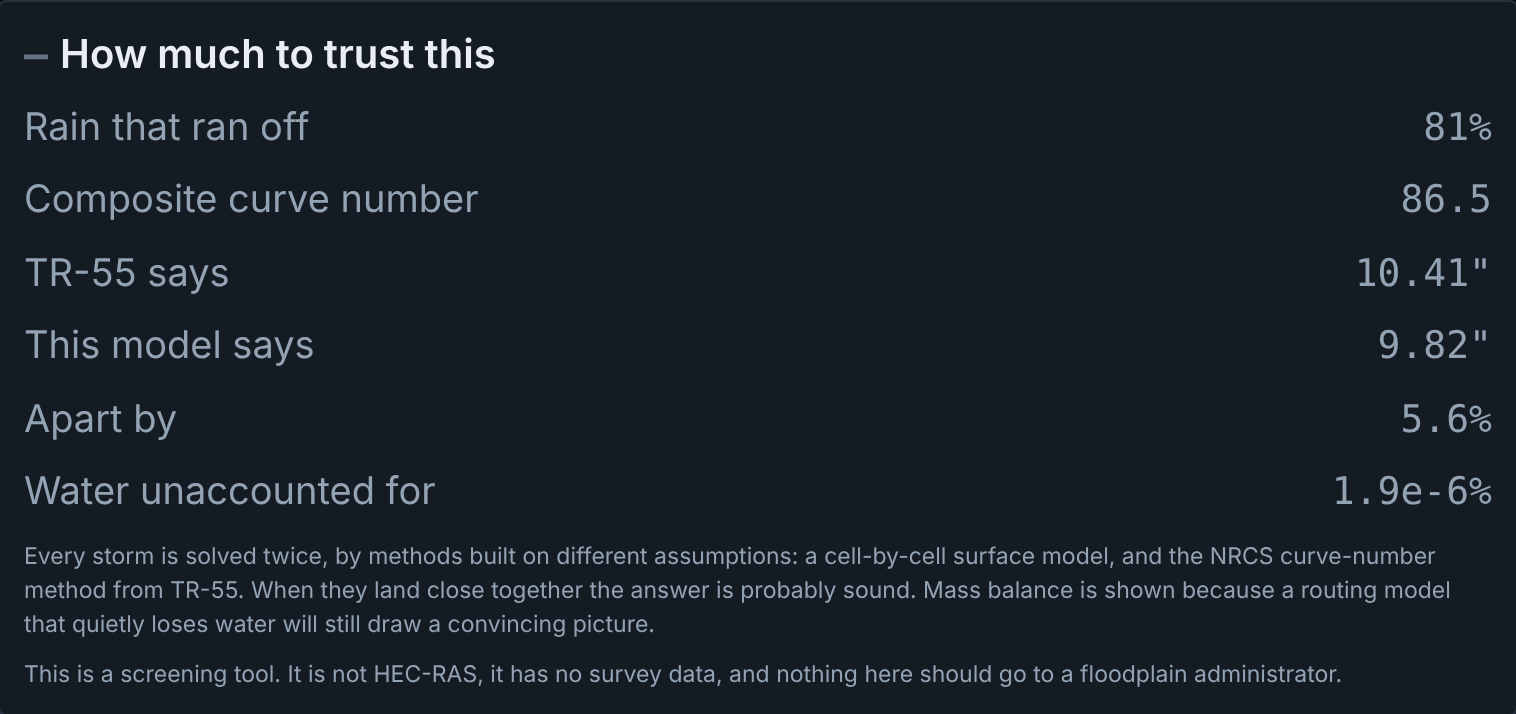
Two independent methods agree within 5.6%, and mass balance closes to 1.9e-6% of rainfall. Shown in the app.

Inspiration
In 2018, NOAA published Atlas 14, and the 100-year rainfall for Harris County went from about 13 inches in 24 hours to nearly 18. I live in Sugar Land. The drainage under my neighborhood was designed for the old number, which means the storm it was built to handle is now closer to a 25-year event.
That revision applied to every house on the Gulf Coast at once, and almost nothing happened. Not because nobody cares. Because there is no way for a person who owns a house to do anything with that information. The real models, HEC-RAS and EPA SWMM, want survey data, a trained operator, and days of setup. The other end of the market is a listicle about rain barrels. There is nothing in between that answers the only three questions a homeowner actually has: how bad is it here, what is causing it, and what is the cheapest thing I can do that measurably helps.
I wanted to build that missing middle.
What it does
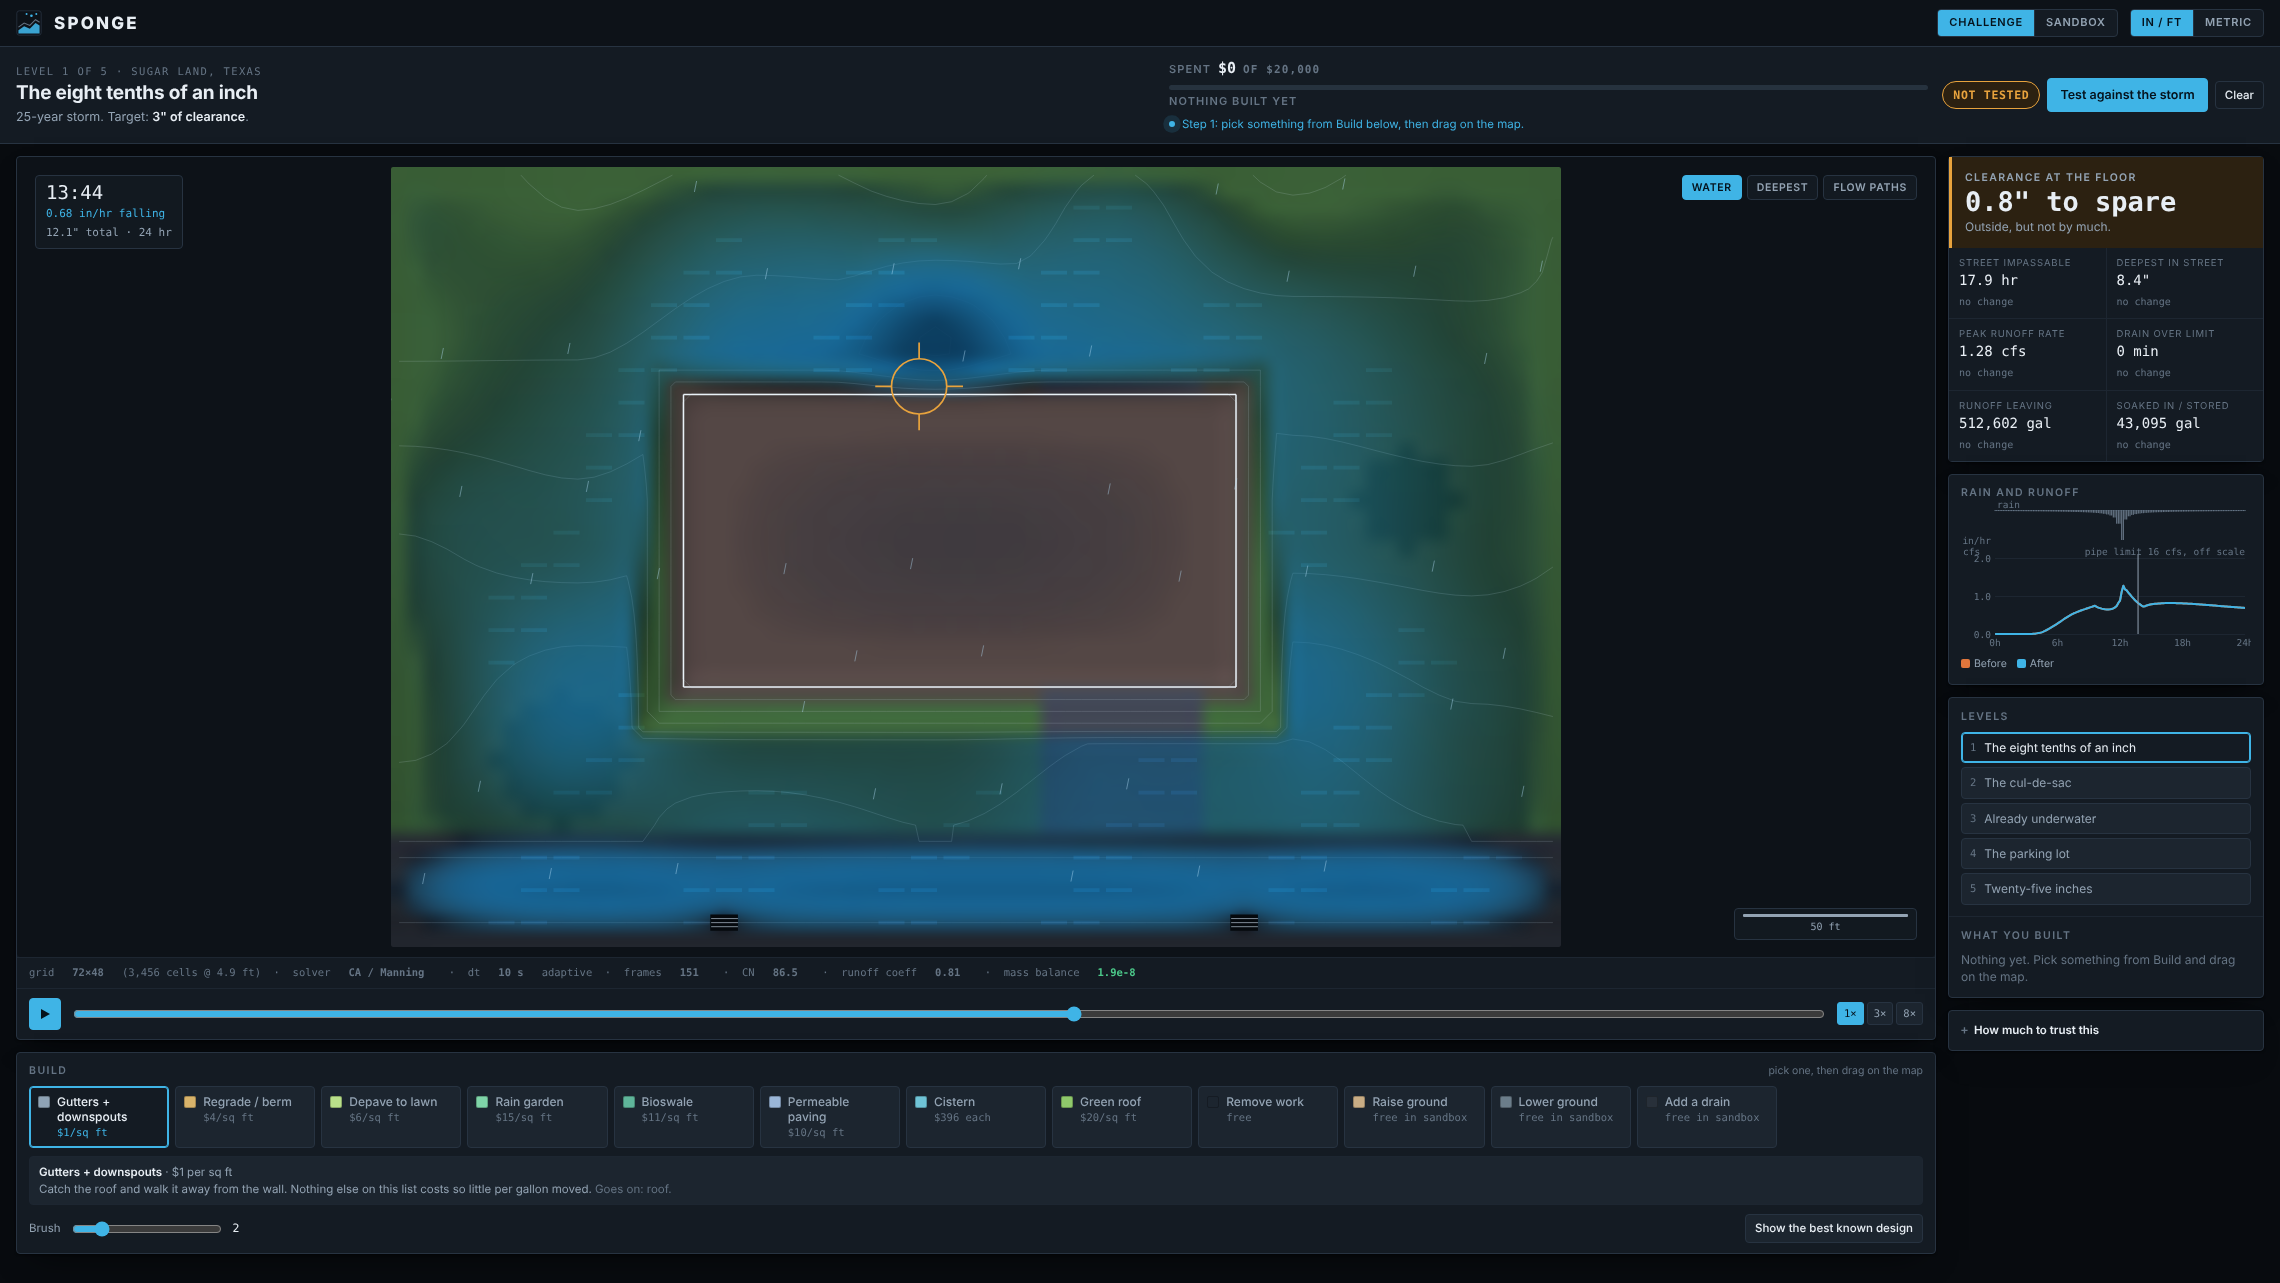
Sponge is a flood simulator for one block, and it is built as a game. You get a site, a storm, a budget and a target. You place gutters, rain gardens, permeable paving, berms or cisterns on the map, then run a NOAA Atlas 14 design storm and find out whether you were right.
What it reports is not a hazard color. It is the number of inches of clearance between the water surface and your finished floor, plus how long the street was too deep to drive and how long the storm pipe ran over capacity.
Level 1 is a one-storey slab house in Sugar Land in a 25-year storm, 12.1 inches of rain in a day on Houston clay. 631,338 gallons land on the lot. 81% of it runs off. The water stops 0.80 inches below the finished floor, on a house that has never flooded.
Then the model gets a turn. It evaluates about 1,900 possible placements, re-runs the full storm roughly 22 times to verify its own shortlist, and discards anything that does not measurably help.
It spent $8,262. On gutters. Clearance went from 0.80 inches to 3.77.
The most effective item on a list that includes green roofs, permeable paving, cisterns and bioretention is gutters. That is not a design choice I made. It falls out of the mass balance: 62% of the water reaching that house is roof runoff coming off the eaves, and no quantity of bioretention in the back yard touches it. Raising the budget to $120,000 changes nothing. The optimizer still recommends $8,262, because nothing else earns its cost.
There are five levels, each teaching something different. A cul-de-sac where doubling the pipe capacity changes nothing. A townhome row that starts 5.4 inches underwater and can only be partly fixed. A school lot run on the 2-year storm, because that is what EPA actually sizes green infrastructure for. And a 500-year storm, roughly Harvey, which turns out to be winnable for about $11,600.
How we built it
One self-contained HTML file. No framework, no backend, no build step for the user. The simulation runs in a Web Worker so that twenty-plus storms do not freeze the interface, and a full 24-hour storm solves in about half a second.
- Design storm : NOAA Atlas 14 Vol. 11 depths for Harris County, assembled into a hyetograph by the alternating-block method (Chow, Maidment & Mays) from a Houston IDF curve fitted to the 1-hour and 24-hour anchors, then rescaled so the total depth is exact.
- Infiltration : Horton's equation per cell,
f = fc + (f0 - fc) * e^(-kt), by hydrologic soil group. Houston's Beaumont clay is group D, final rate about 1.3 mm/hr, and that single number explains most of what the model shows. - Surface routing : a mass-conserving cellular automaton over water surface elevation. Manning flux between four-neighbours,
q = (1/n) * d^(5/3) * S^(1/2), with every transfer capped at a quarter of the head difference and at the water actually available, which makes the scheme stable at any timestep and conservative by construction. - Inlets : weir control when shallow,
Q = Cw * L * h^1.5, transitioning to orifice control when submerged,Q = Cd * A * sqrt(2gh), whichever is smaller, then throttled by downstream pipe capacity. On most Houston blocks the pipe is the bottleneck, not the grate. - Terrain : priority-flood depression filling (Barnes, Lehman & Mulla 2014), D8 flow directions and flow accumulation, which answer where water goes before a drop of rain is routed.
- The optimizer : a fast surrogate proposes and real simulated storms dispose.
Claude runs inside the published page through the artifact sampling capability and does three jobs: it turns a spoken description of a lot into a structured layout the page builds elevation, land cover and drains from; it explains the result in plain language from the computed figures; and it drafts a letter to the drainage district. Everything else runs locally with Claude unavailable.
Challenges we ran into
My optimizer was confidently wrong. Told to protect the house with $120,000, the first working version recommended 18 rain gardens and made the flooding worse. It was placing ponding basins on the graded collar around the slab, which is exactly what bioretention guidance tells you not to do, and the surrogate had no way to see it. I had to encode the ten-foot foundation setback as a hard rule and add a verification stage that re-runs real storms on candidate designs.
Then spending more money kept producing worse outcomes. The surrogate's score only ever increases when you add something, so given a large budget it spends all of it. A tool that recommends six figures of work to make flooding worse is not worth building. The optimizer now chooses by simulation and is allowed to hand money back, and on most sites it does.
Then nothing helped at all, which is what led to the actual finding. I went looking for why, and 62% of the water reaching the house was roof runoff sheeting off the eaves, because I had modeled a house with no gutters. Adding gutters as an intervention turned the cheapest line item on the list into the most effective one by a wide margin.
Turning it into a game exposed a fourth problem: four of my five levels were impossible. I had set the targets by intuition instead of measurement. I ran the optimizer against every level, found the real ceiling on each site, and set every target just underneath it, so each one is hard but actually winnable.
Performance mattered throughout, since the optimizer runs about twenty-two full storms per search. A 24-hour simulation started at 7.0 seconds. Preallocating every buffer, removing per-step allocation from the routing loop, and merging the quiet stretches of the storm into coarse timesteps brought it to 0.52 seconds without changing the volume of water carried.
Accomplishments that we're proud of
That the model checks itself, and shows you the check. Every storm is solved twice, by a cell-by-cell surface model and by the lumped NRCS curve-number method, which rest on different assumptions. They agree within about 5%. Mass balance closes to roughly one part in a million, and the app displays that number live, because a routing model that quietly loses water will still draw a convincing picture. There are 52 assertions in the test suite, including TR-55 checked against hand-worked examples.
And that the headline result is something I did not expect and did not want. I would have spent the money on a rain garden. The model told me I was wrong, I went and checked why, and the reason held up.
What we learned
That ordering candidates is not the same as choosing them. My optimizer ranked a small berm above gutters, so every shortlist containing gutters also contained the berm, the berm undid most of what the gutters achieved, and the combination that actually worked was never evaluated. Fixing that meant throwing away the surrogate's answer and re-running real storms.
I also learned that the metric you choose decides what the tool recommends. Depth on a cell is the wrong thing to measure: six inches standing on a collar that falls away from the slab is harmless, and three inches at floor level is not. Switching to water surface elevation against the finished floor changed which designs won.
What's next for Sponge
Pull the real terrain. USGS 3DEP lidar covers Harris and Fort Bend County at 1 meter, and dropping a parcel boundary onto measured ground instead of a drawn approximation is the single biggest accuracy upgrade available. After that, hydraulic routing of the pipe network rather than a capacity cap, continuous simulation across a rainfall record instead of one design storm, and a shared version where a whole street can see what their block does together, since drainage is the kind of problem where the lot next door is part of yours.
What this is not
A screening tool. It is not HEC-RAS, it has no survey data, it does not model the pipe network hydraulically, and nothing it produces should be submitted to a floodplain administrator. It finds the shape of a problem and the order of the fixes. I say that inside the app too.
Built With
- anthropic
- canvas
- claude
- css3
- gis
- html5
- hydrology
- javascript
- node.js
- optimization
- playwright
- simulation
- web-workers

Log in or sign up for Devpost to join the conversation.