Inspiration
splatGraph started from a problem I kept seeing in my own growing photo library and across the web.
I have accumulated a huge number of photos and image references from places, projects, research, travel, architecture, warehouses, streets, cathedrals, museums, signs, windows, columns, ceilings, and strange little details I wanted to remember. Sometimes I take multiple photos of the same subject from different angles or at different levels of detail. But later, those relationships disappear.
The same thing happens online. Search for a place, landmark, object, or architectural detail, and you get a grid of related images, but the spatial and semantic relationships between them are mostly missing.
Which photo shows the same wall from another angle? Which image is a close-up of that window? Which detail belongs to which building? Which path connects the outside, the entrance, the nave, the stained glass, and the ceiling?
The camera roll flattens everything. Search results flatten everything too.
Place, detail, angle, memory, history, and path all collapse into streams and grids.
I started wondering whether photos needed a new kind of platform, almost a new kind of visual science, where images are not just stored or searched, but spatially understood.
That led to a simple observation:
A single image can contain worlds inside worlds.
A stained glass window can open into a detail view. A stone column can connect to a wiki entry. A ceiling vault can link to another visitor’s angle. A path through those images can become a replayable journey.
That became splatGraph:
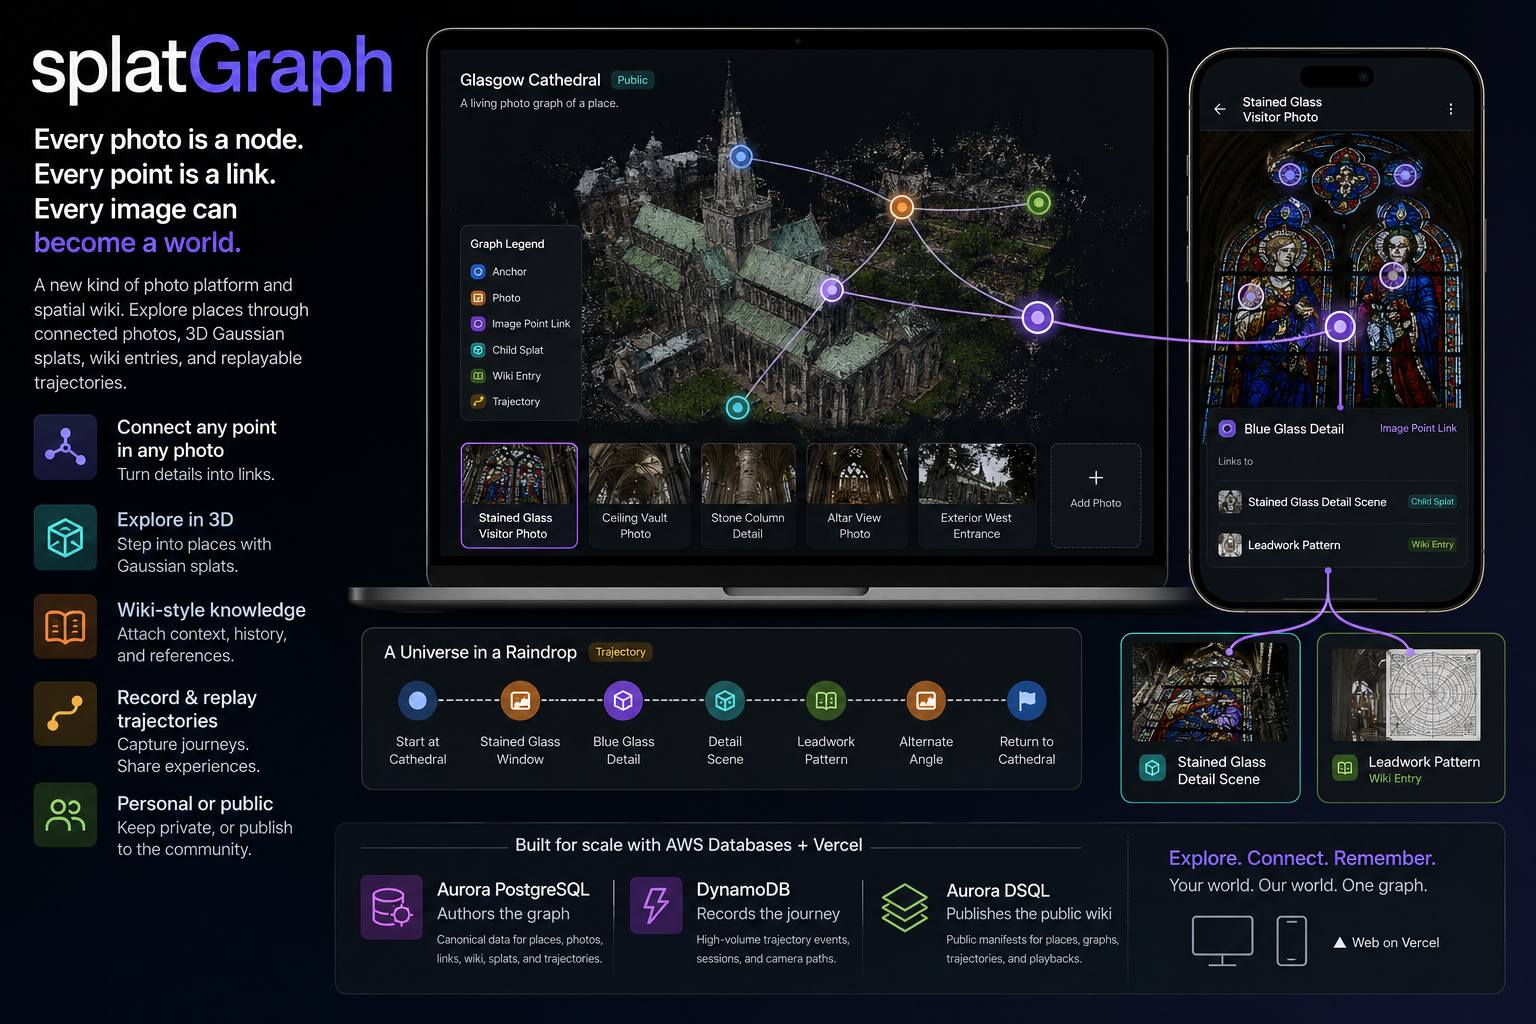
Every photo is a node. Every point is a link. Every image can become a world.
The poetic version is:
A universe in a raindrop.
Or, as Hamlet says:
“I could be bounded in a nutshell and count myself a king of infinite space.”
splatGraph turns that into software: one small image can hold an infinite explorable graph.
What it does
splatGraph is a new kind of photo platform: part personal photo library, part public spatial wiki, part 3D graph.
It lets you browse your own photos and explore community photos wiki-style when people choose to share publicly. Instead of treating photos as isolated files in a camera roll or disconnected thumbnails in a search grid, splatGraph treats each image as a node in an explorable spatial graph.
You can open a private photo, link a point inside it to another photo, generate a 3D splat from it, attach a wiki-style entry, record a path through it, or publish selected pieces into a shared public graph.
When photos are shared publicly, they can become part of a larger community photo wiki: connected to places, 3D splats, image points, wiki entries, generated child scenes, and replayable trajectories.
The general pattern is:
Photo → Point → Link → World
The full graph model is:
Place → Splat → Anchor → Photo → Image Point → Child Splat → Wiki Entry → Trajectory
A photo is not just media. It is a graph node.
A point inside a photo is not just a marker. It is a graph edge.
A path through photos, anchors, wiki entries, and 3D scenes is not just browsing. It is a replayable 3D trajectory.
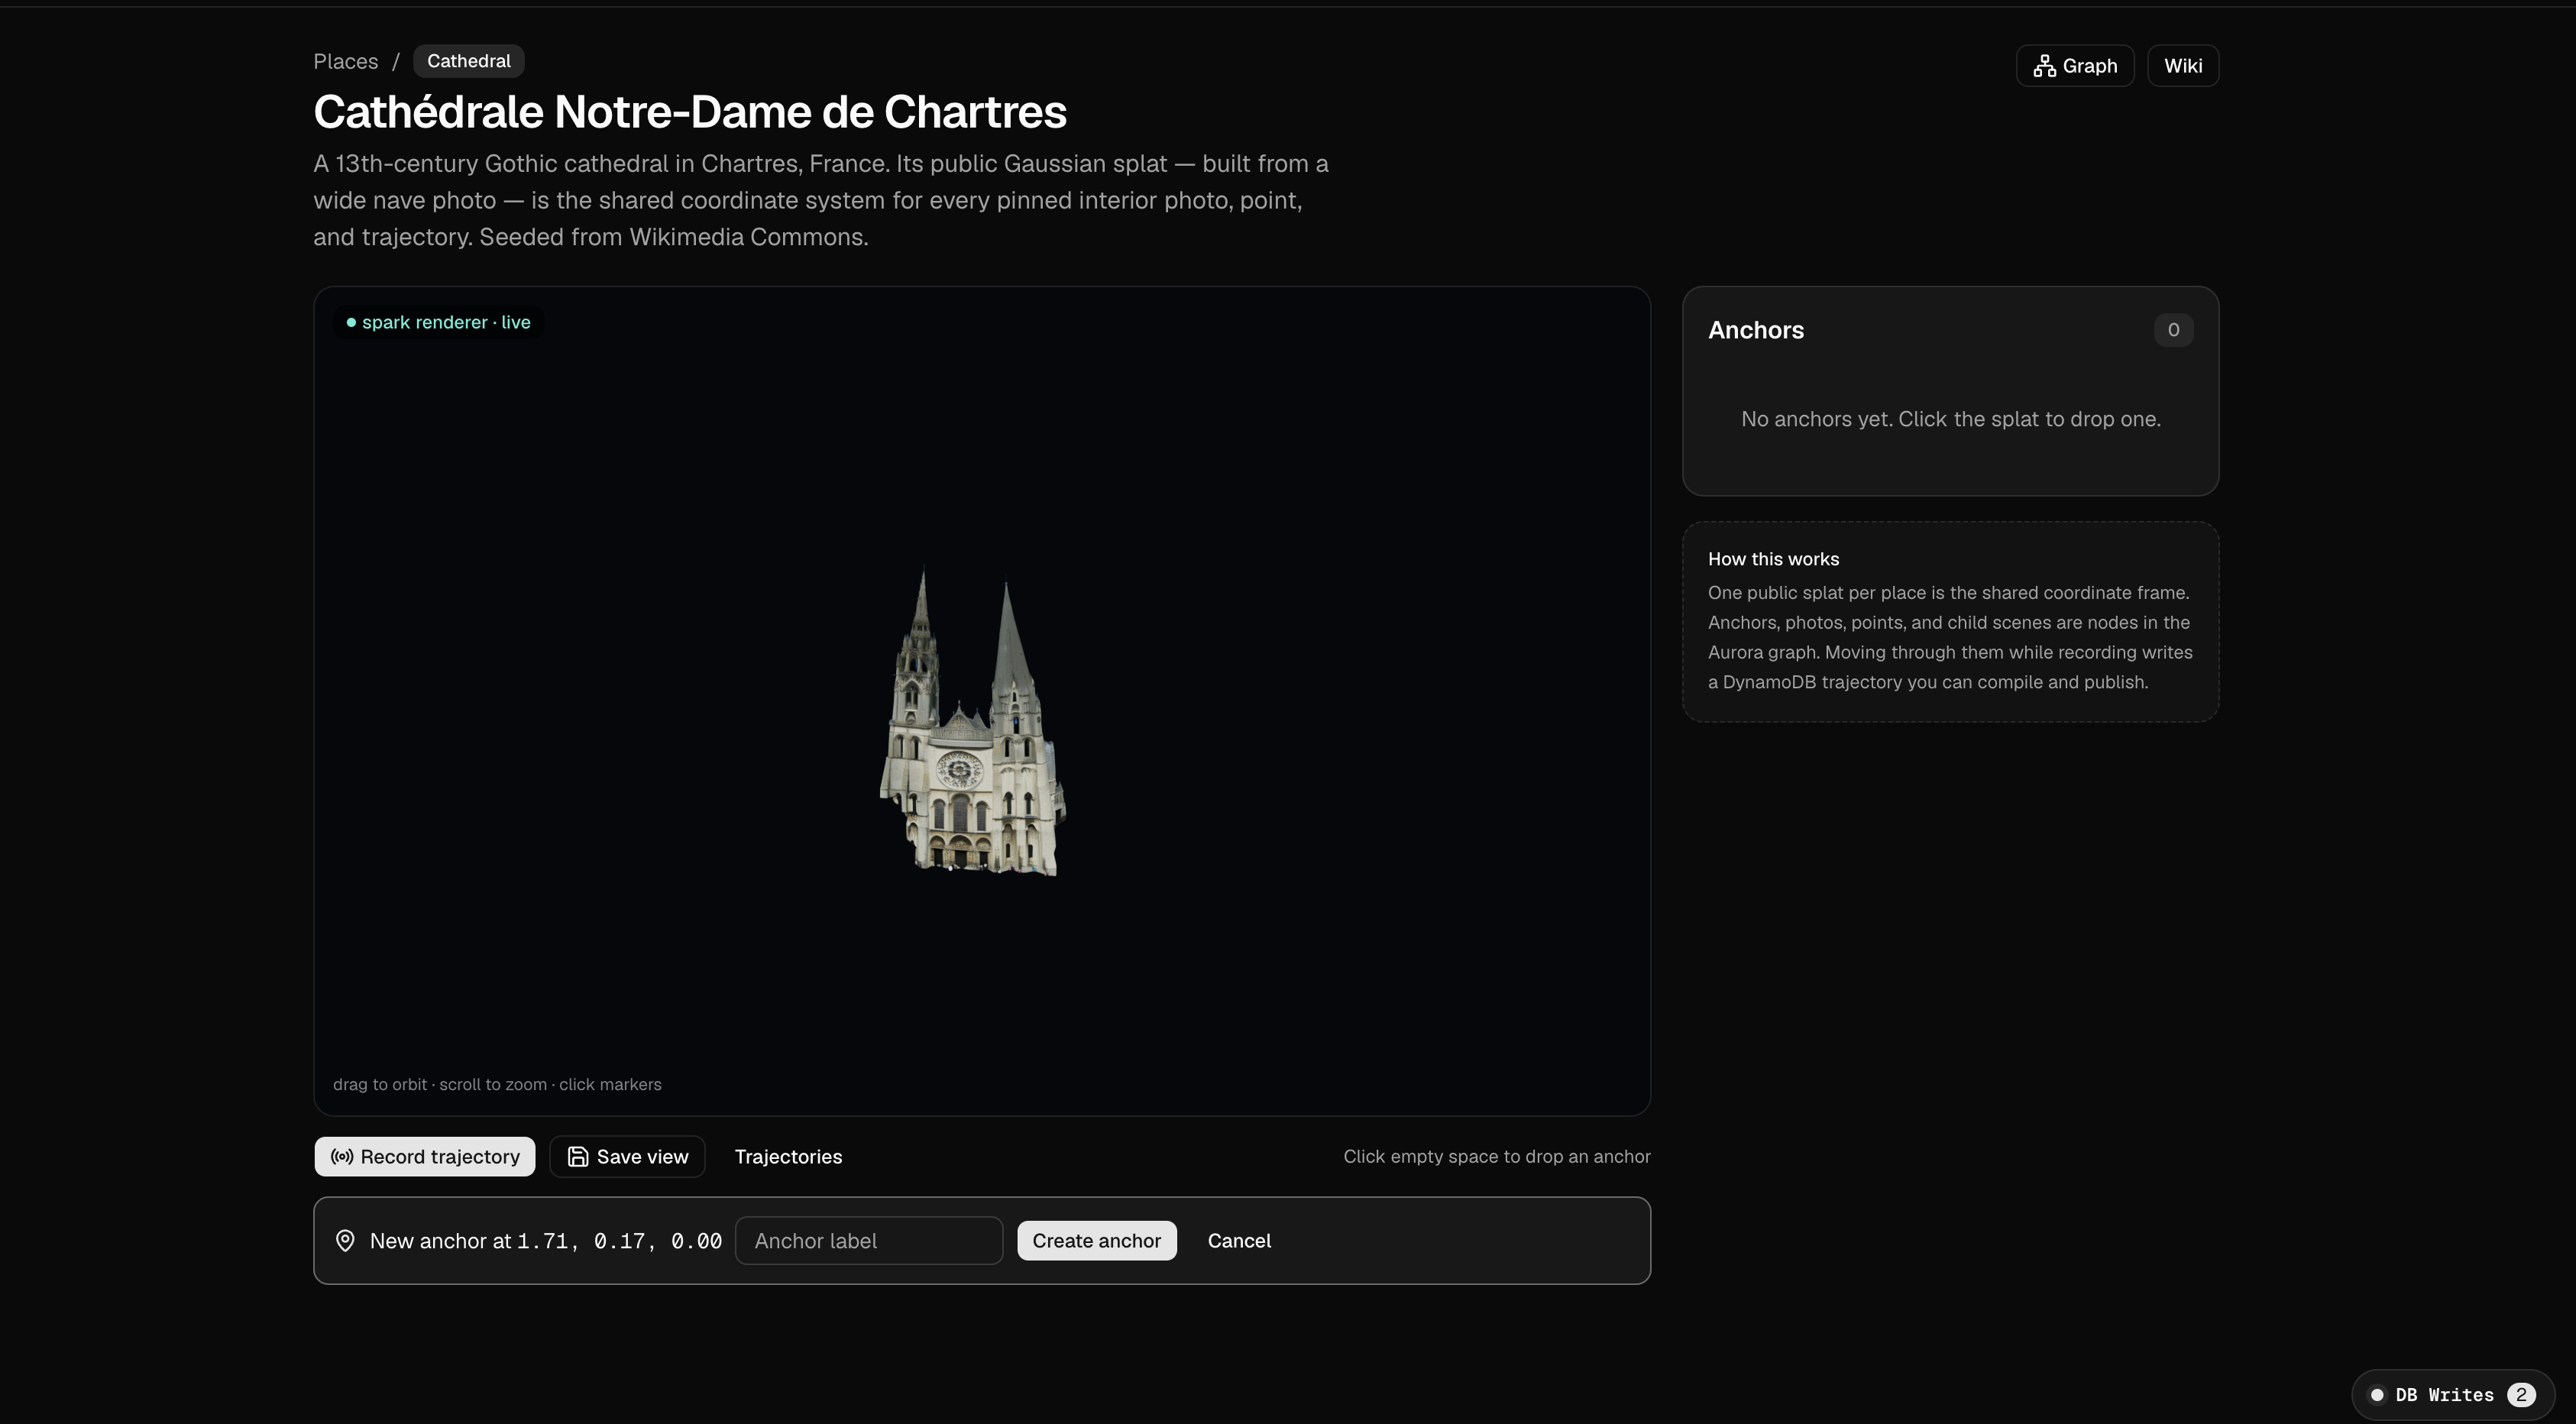
In the current demo, this becomes Glasgow Cathedral.
Users can open a shared cathedral splat, click spatial anchors, open pinned visitor photos, follow point-level links inside images, generate child splat scenes from photos, read linked wiki entries, record a path through the graph, replay that trajectory, and publish a public manifest.
The demo flow is:
- Open Glasgow Cathedral.
- Click the Stained Glass Anchor.
- Open a visitor photo.
- Click the Blue Glass Detail point.
- Follow a wiki link.
- Generate a child splat.
- Enter the child scene.
- Record a trajectory.
- Save the trajectory.
- Replay the trajectory.
- Publish the public manifest.
- View the graph and database write lifecycle.
How it works
splatGraph turns photos into a spatial graph.
You can start with your own photo library, a public place, or a community collection. Each photo becomes a node. Any point inside a photo can become a link. That link can open another photo, a wiki-style entry, a generated 3D splat, or a replayable trajectory.
When photos are private, splatGraph works like a personal spatial memory system. When photos are shared publicly, they can become part of a community photo wiki: many people contributing angles, details, annotations, and paths through the same place or subject.
The basic flow is:
- Open a photo, place, or collection.
- Add or follow spatial links between images.
- Click points inside photos to open related details.
- Generate a 3D splat from a photo when a view deserves to become a scene.
- Attach wiki-style knowledge to photos, anchors, and details.
- Record a path through the graph.
- Save that path as a replayable trajectory.
- Publish selected photos, links, wiki entries, and trajectories into the public graph.
In the demo, Glasgow Cathedral acts as the first public place graph. A shared cathedral splat contains anchors like stained glass, ceiling vaults, stone columns, and altar views. A visitor photo pinned to the stained glass anchor becomes a graph node. A blue glass detail inside that photo becomes a link. That link can open a child splat, a wiki entry, another visitor’s angle, or a trajectory through the cathedral.
How we built it
We built splatGraph as a production-shaped Next.js App Router application using TypeScript, Tailwind, v0.app, Vercel, and a domain-driven architecture designed to scale from a single demo place to millions of photos, links, trajectory events, and published public manifests.
The app is organized around bounded contexts:
- Places Context manages places, shared splats, splat versions, and spatial anchors.
- Photo Graph Context manages uploaded photos, photo contributions, image point links, and graph edges.
- Splat Generation Context manages generation jobs, generated splats, and child scenes.
- Wiki Context manages wiki entries, edit history, moderation status, and citation-like links.
- Trajectory Context manages saved trajectories, trajectory steps, branches, and playback.
- Runtime Context manages live trajectory sessions, camera segments, viewer state, and raw movement events.
- Publishing Context manages public manifests for published places, anchors, photos, point links, child scenes, wiki entries, and trajectories.
The AWS database architecture is intentionally split by responsibility:
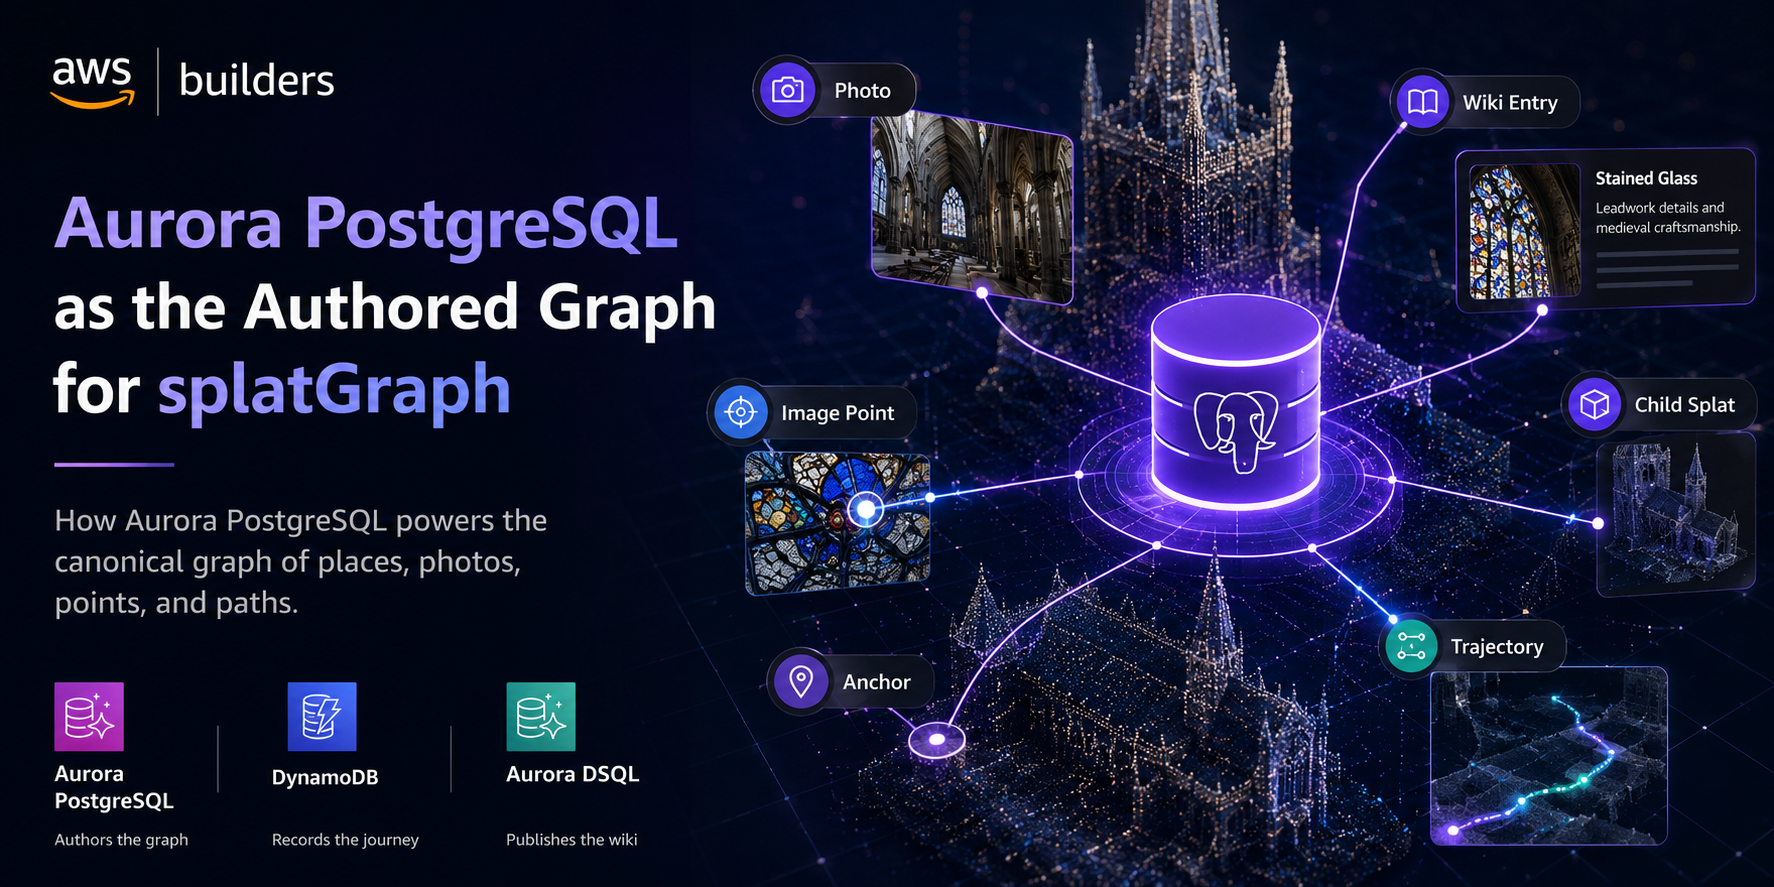
Aurora PostgreSQL authors the graph.
It stores canonical edited domain data: places, anchors, photos, point links, graph edges, generated splats, wiki entries, child scenes, and compiled trajectories.
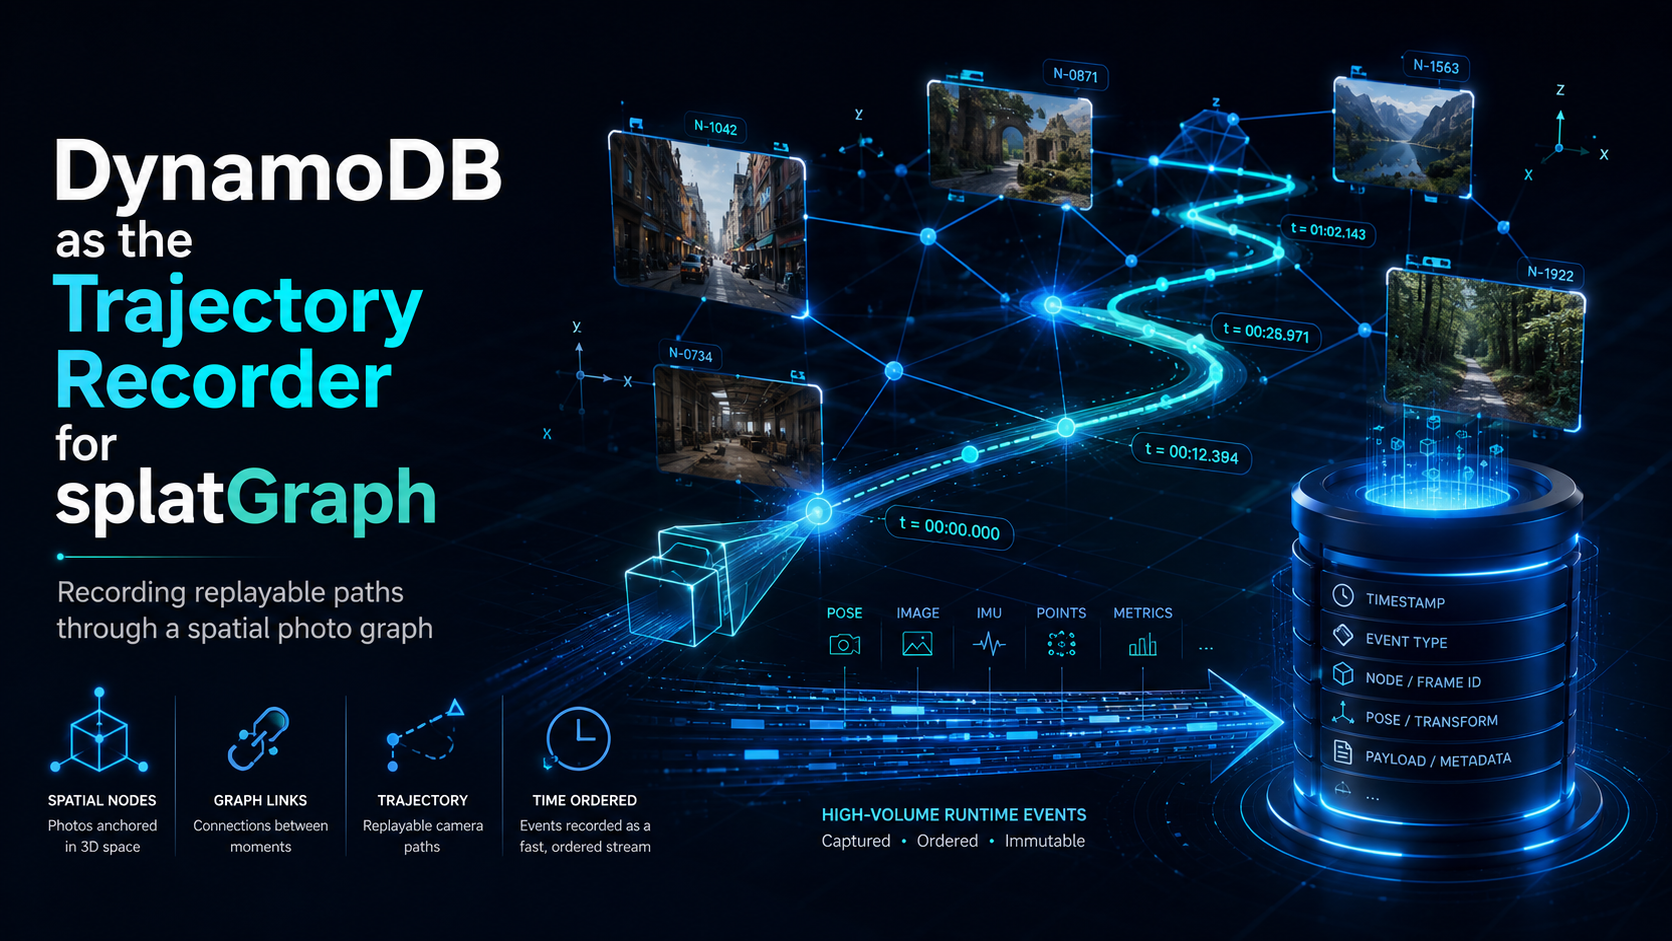
DynamoDB records the journey.
It stores raw runtime trajectory events, camera segments, viewer sessions, and playback state. It is not generic logging. It is the live trajectory recorder.
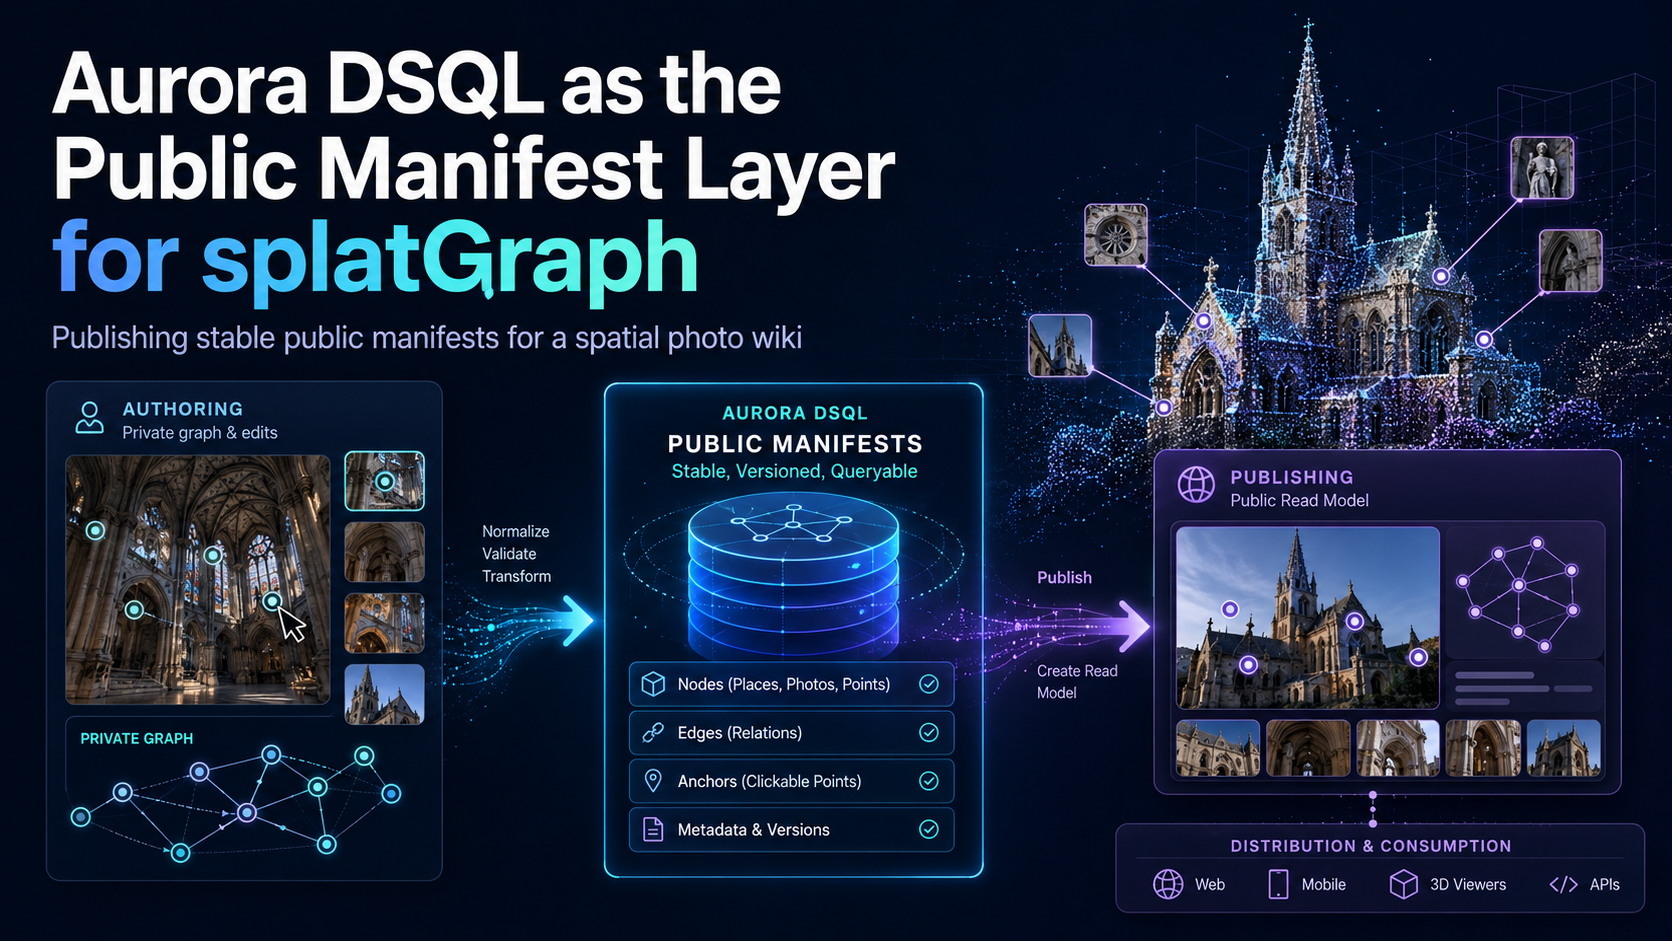
Aurora DSQL publishes the public wiki.
It stores published public manifests that can be globally distributed and read as stable public versions.
The lifecycle is:
User moves through graph → DynamoDB records raw path → Aurora compiles authored trajectory → Aurora DSQL publishes public playback.
This split keeps high-volume runtime activity from polluting the authored graph, and keeps public read traffic from competing with editing workflows.
We also built a visible Database Writes Inspector so the architecture is legible inside the product:
- Graph edits save to Aurora PostgreSQL.
- Runtime movement records to DynamoDB.
- Public manifests publish to Aurora DSQL.
For 3D generation, splatGraph integrates TripoSplat through FAL behind a production provider boundary. Generation jobs are represented as durable domain objects, so the app can queue requests, track status, persist generated splats, link child scenes into the graph, and scale or swap inference providers without rewriting the core product.
Challenges we ran into
The hardest challenge was making the app feel like a real product instead of a visual demo.
A spatial photo graph can easily become too abstract. Photos, splats, anchors, points, wiki entries, generated scenes, and trajectories all overlap. We had to turn that into a clear user flow where each action has a concrete meaning.
The second challenge was database boundaries. It would have been easier to put everything in one database, but that would make the architecture less meaningful. splatGraph needed each database to do a different job:
- Aurora PostgreSQL stores the durable authored graph.
- DynamoDB records the raw live path.
- Aurora DSQL stores the published public manifests.
The third challenge was communicating the idea quickly. “Photo platform” is too vague. “3D splat wiki graph” is too technical. The final framing became:
Images become nodes. Points become links. Paths become 3D trajectories.
Accomplishments that we're proud of
We are proud that splatGraph has a simple interaction model with a serious architecture underneath it.
A user can understand the app visually: open a photo, click a point, follow a link, enter another scene, read a wiki entry, save a path, and replay it later.
Underneath that flow is a full graph lifecycle:
- authored spatial data
- point-level image links
- generated child splat scenes
- recorded runtime events
- compiled trajectories
- published public manifests
- visible database write boundaries
We are also proud of the idea that a photograph can become a place, not just an object. splatGraph makes images navigable, linkable, explorable, and replayable.
The core accomplishment is that splatGraph is not just a photo app with 3D features. It is a spatial graph authoring system where photos, points, splats, wiki entries, and trajectories are all connected graph objects.
What we learned
We learned that spatial media needs a graph model.
A 3D place is not just geometry. It is made of anchors, viewpoints, details, memories, references, edits, and paths. A photo is not just a file. It can become an addressable surface with internal links. A user journey is not just analytics. It can become an authored trajectory that others can replay.
We also learned that AWS Databases are strongest when each one has a precise job.
Aurora PostgreSQL works well as the canonical authored graph.
DynamoDB works well as the raw trajectory recorder.
Aurora DSQL works well as the published public distribution layer.
That separation made the product clearer, not just the architecture.
What's next for splatGraph
Next, we want to expand splatGraph from a single demo place into a public spatial photo discovery wiki and personal spatial photo platform.
The near-term roadmap is:
- support private personal photo graphs
- import public-domain and Creative Commons image collections
- support more landmarks, museums, cathedrals, campuses, warehouses, streets, and event spaces
- let contributors add photos, anchors, wiki entries, and point-level links
- generate child splat scenes from any contributed photo
- improve trajectory playback into guided tours
- add moderation and citation workflows for public wiki quality
- publish stable public manifests for each place
- make splatGraph usable as a new layer between photo libraries, image search, maps, spatial computing, and public knowledge
The long-term goal is to build the world’s spatial photo graph: a public wiki where photographs are not endpoints, but doors.
Built With
- amazon-web-services
- aurora
- dsql
- dynamodb
- vercel


Log in or sign up for Devpost to join the conversation.