-

-

-

-
-

-

-
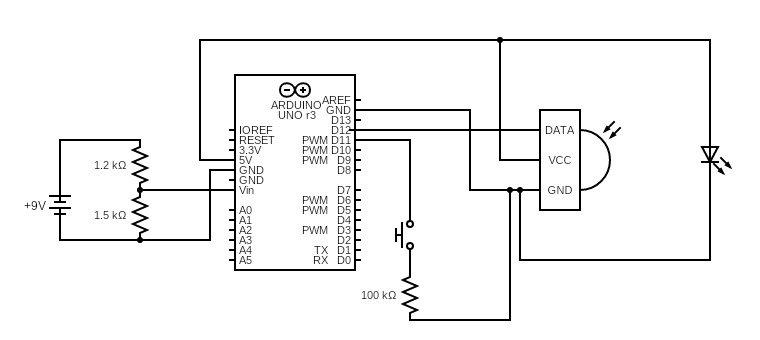
Circuit Diagram
-
-
-

-


Inspiration
Knowing what it is like to suffer from asthma, a few of our group members relate to the difficulties associated with having a pulmonary condition. At-home maintenance testing for such conditions is virtually non-existent, with the options being either non-informative or expensive.
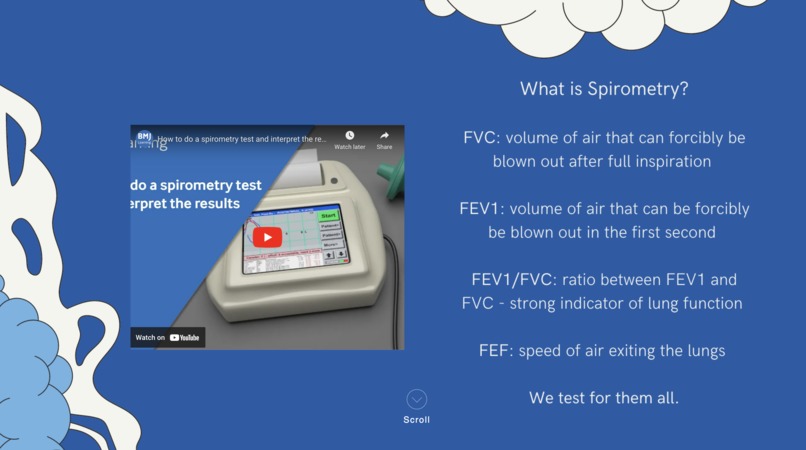
What it does
We have built a smart solution to allow users to monitor their pulmonary condition from the comfort of their own home. Our spirometer streams lung function data directly from the users' Spiro to their electronic device, allowing them to get an insight into the state of their condition at that given time. Nested within an elegant and informative website, we have built a product with the ability to transform at-home pulmonary disease maintenance.
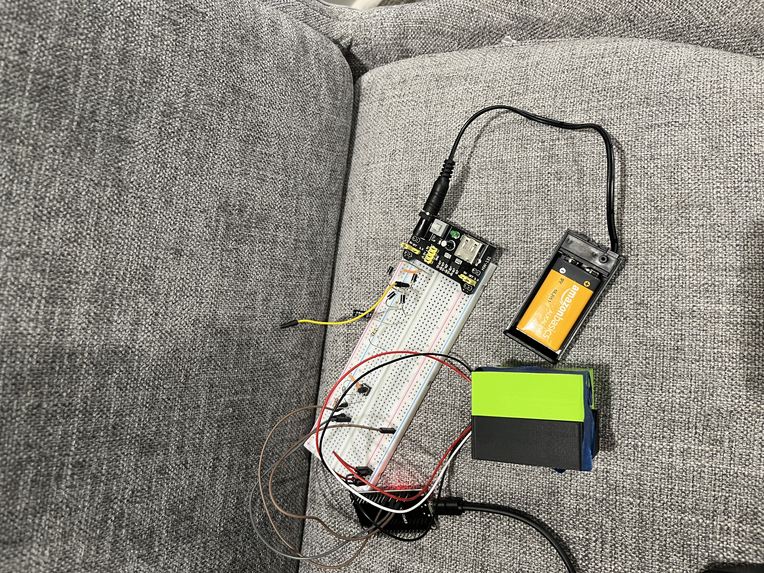
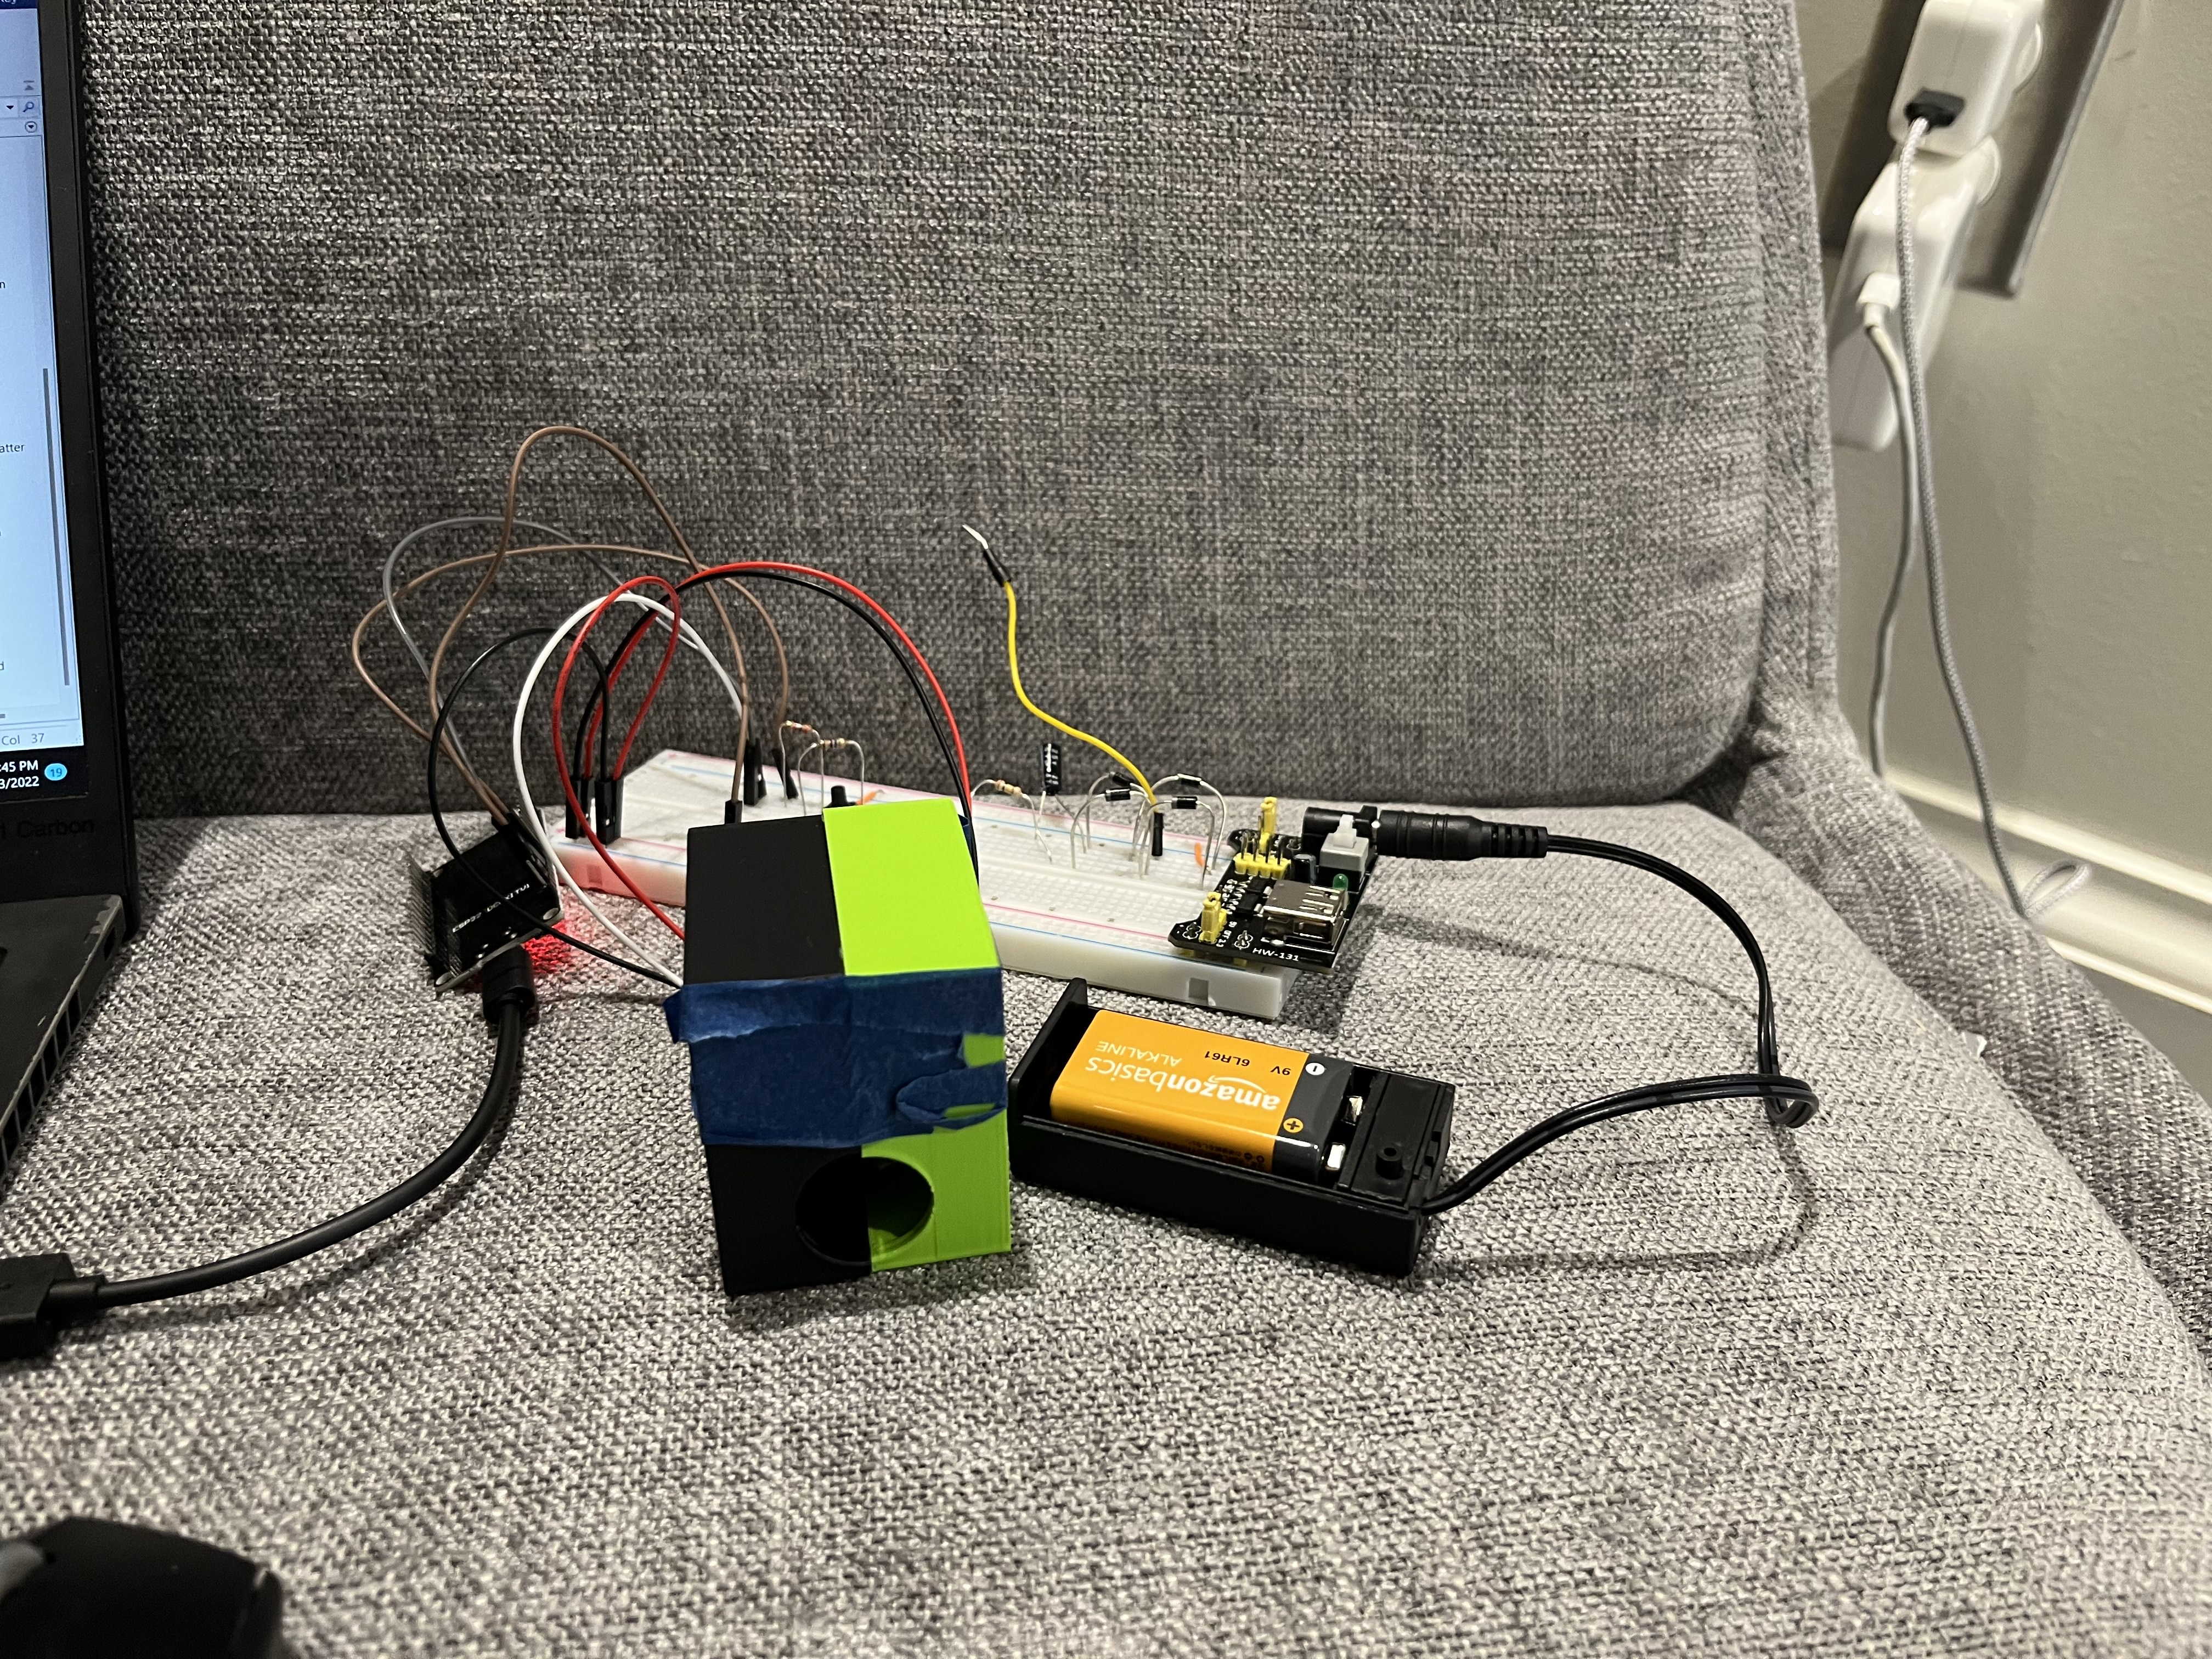
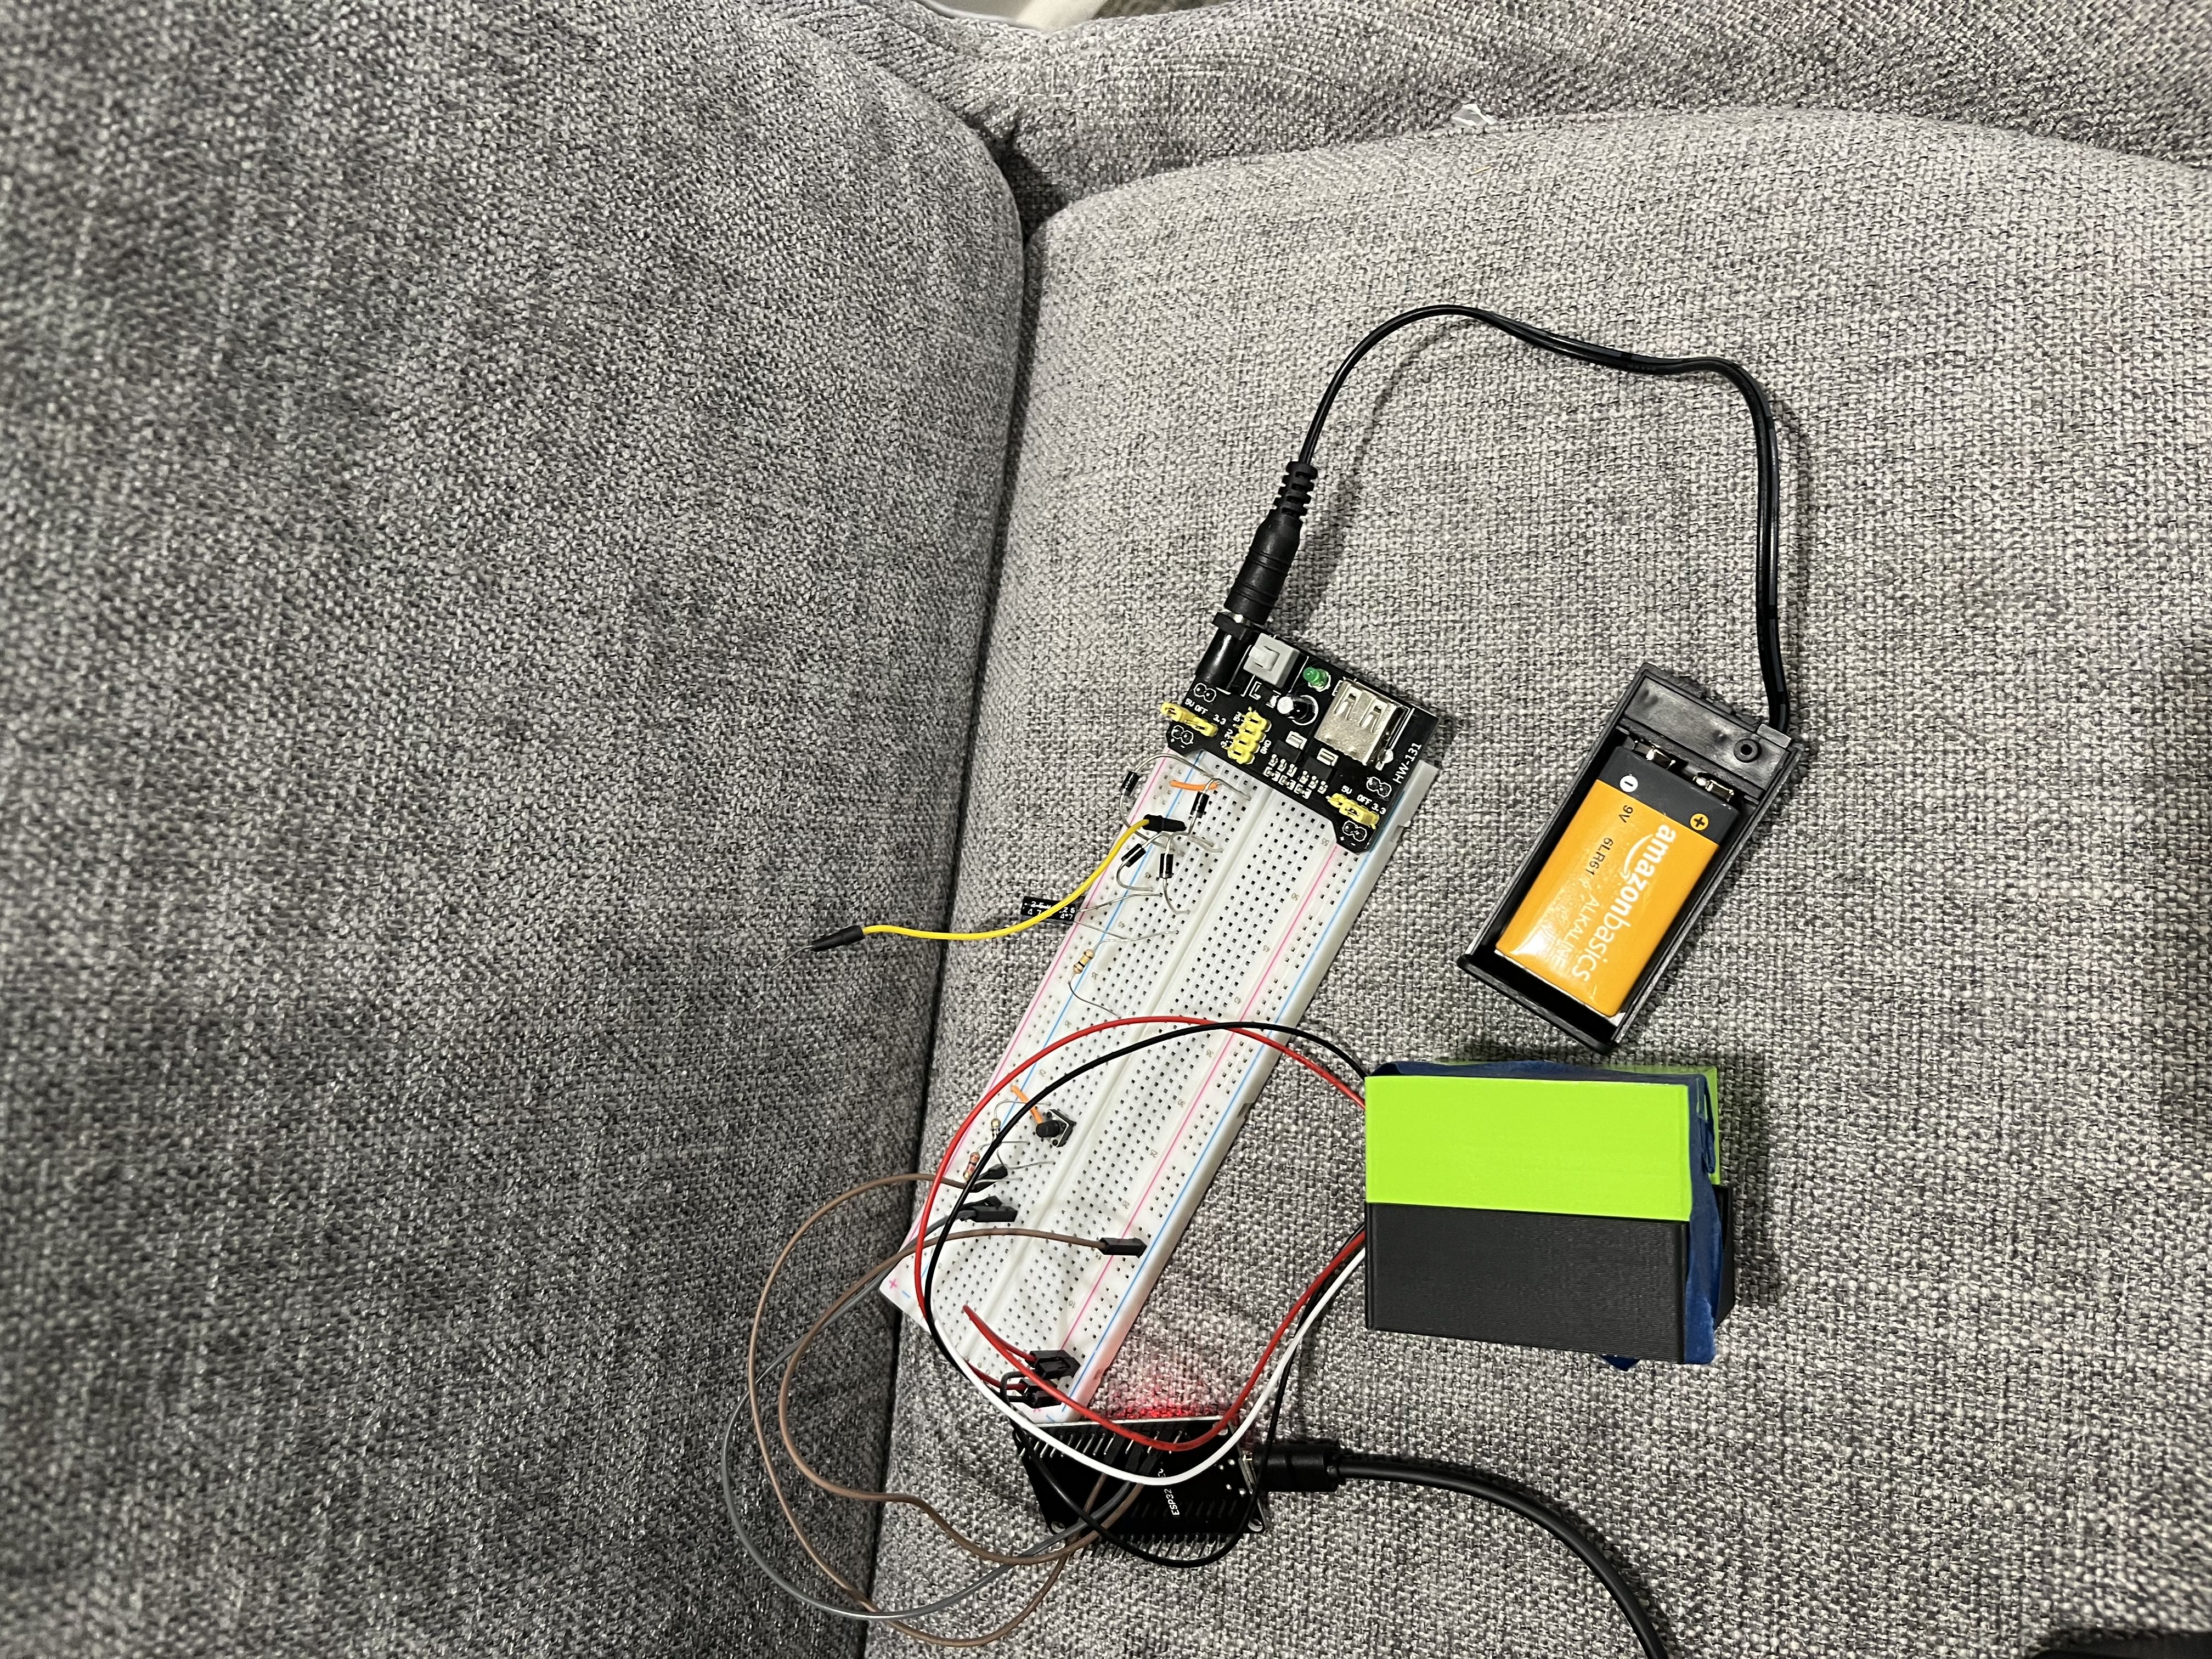
How we built it
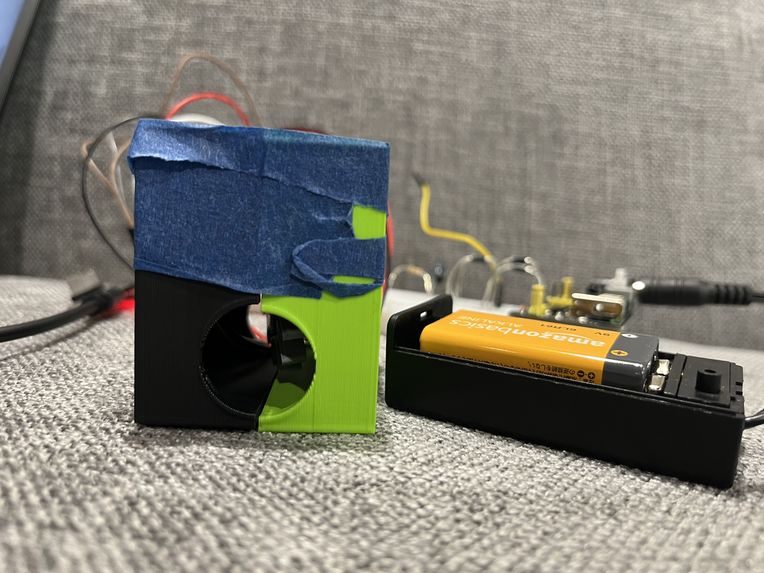
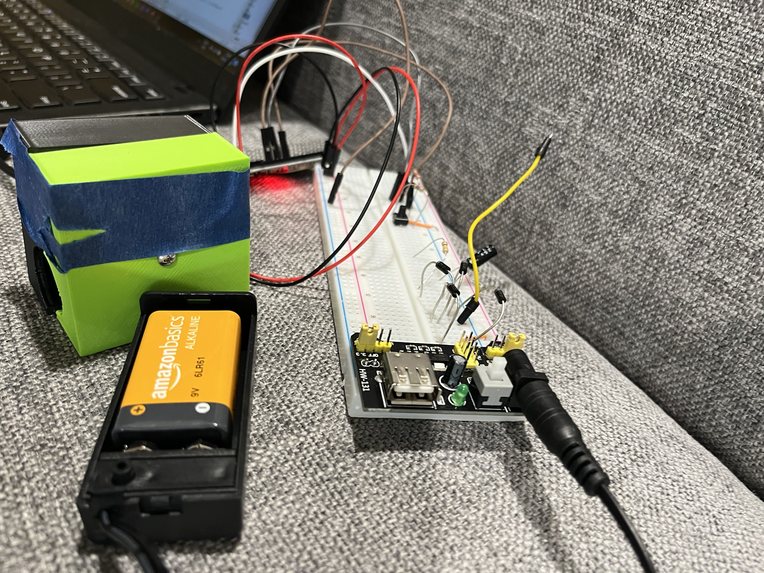
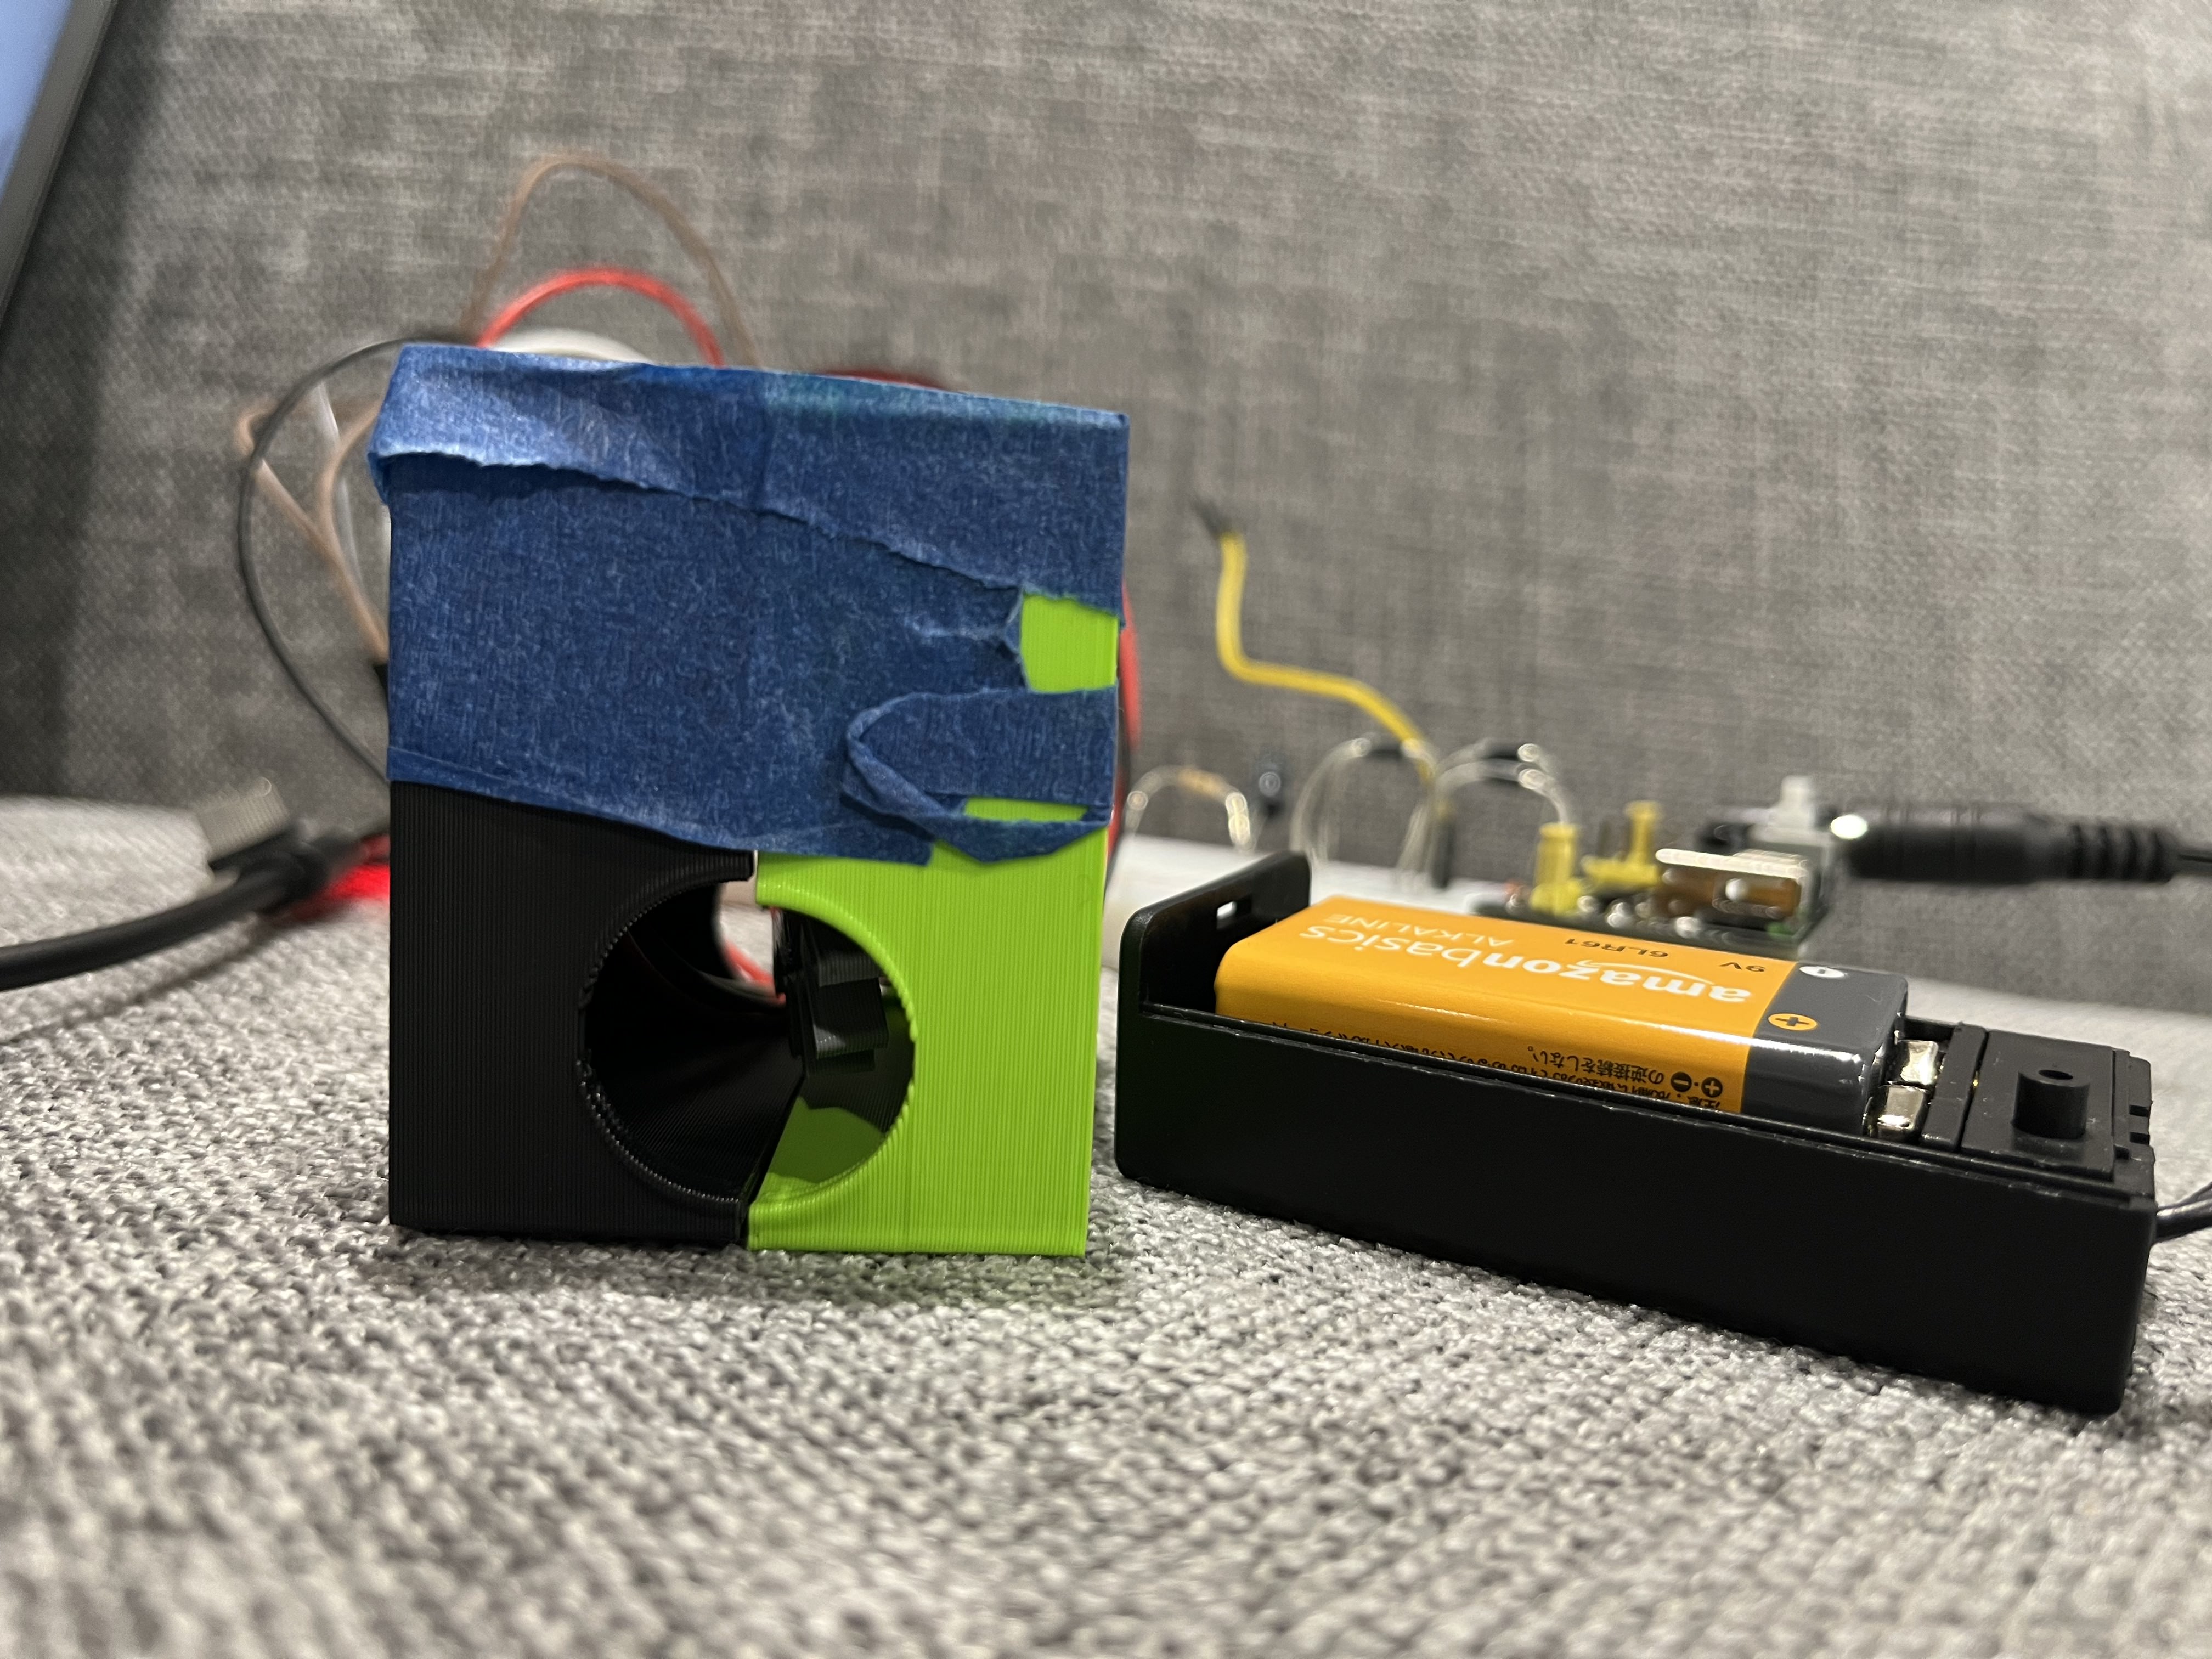
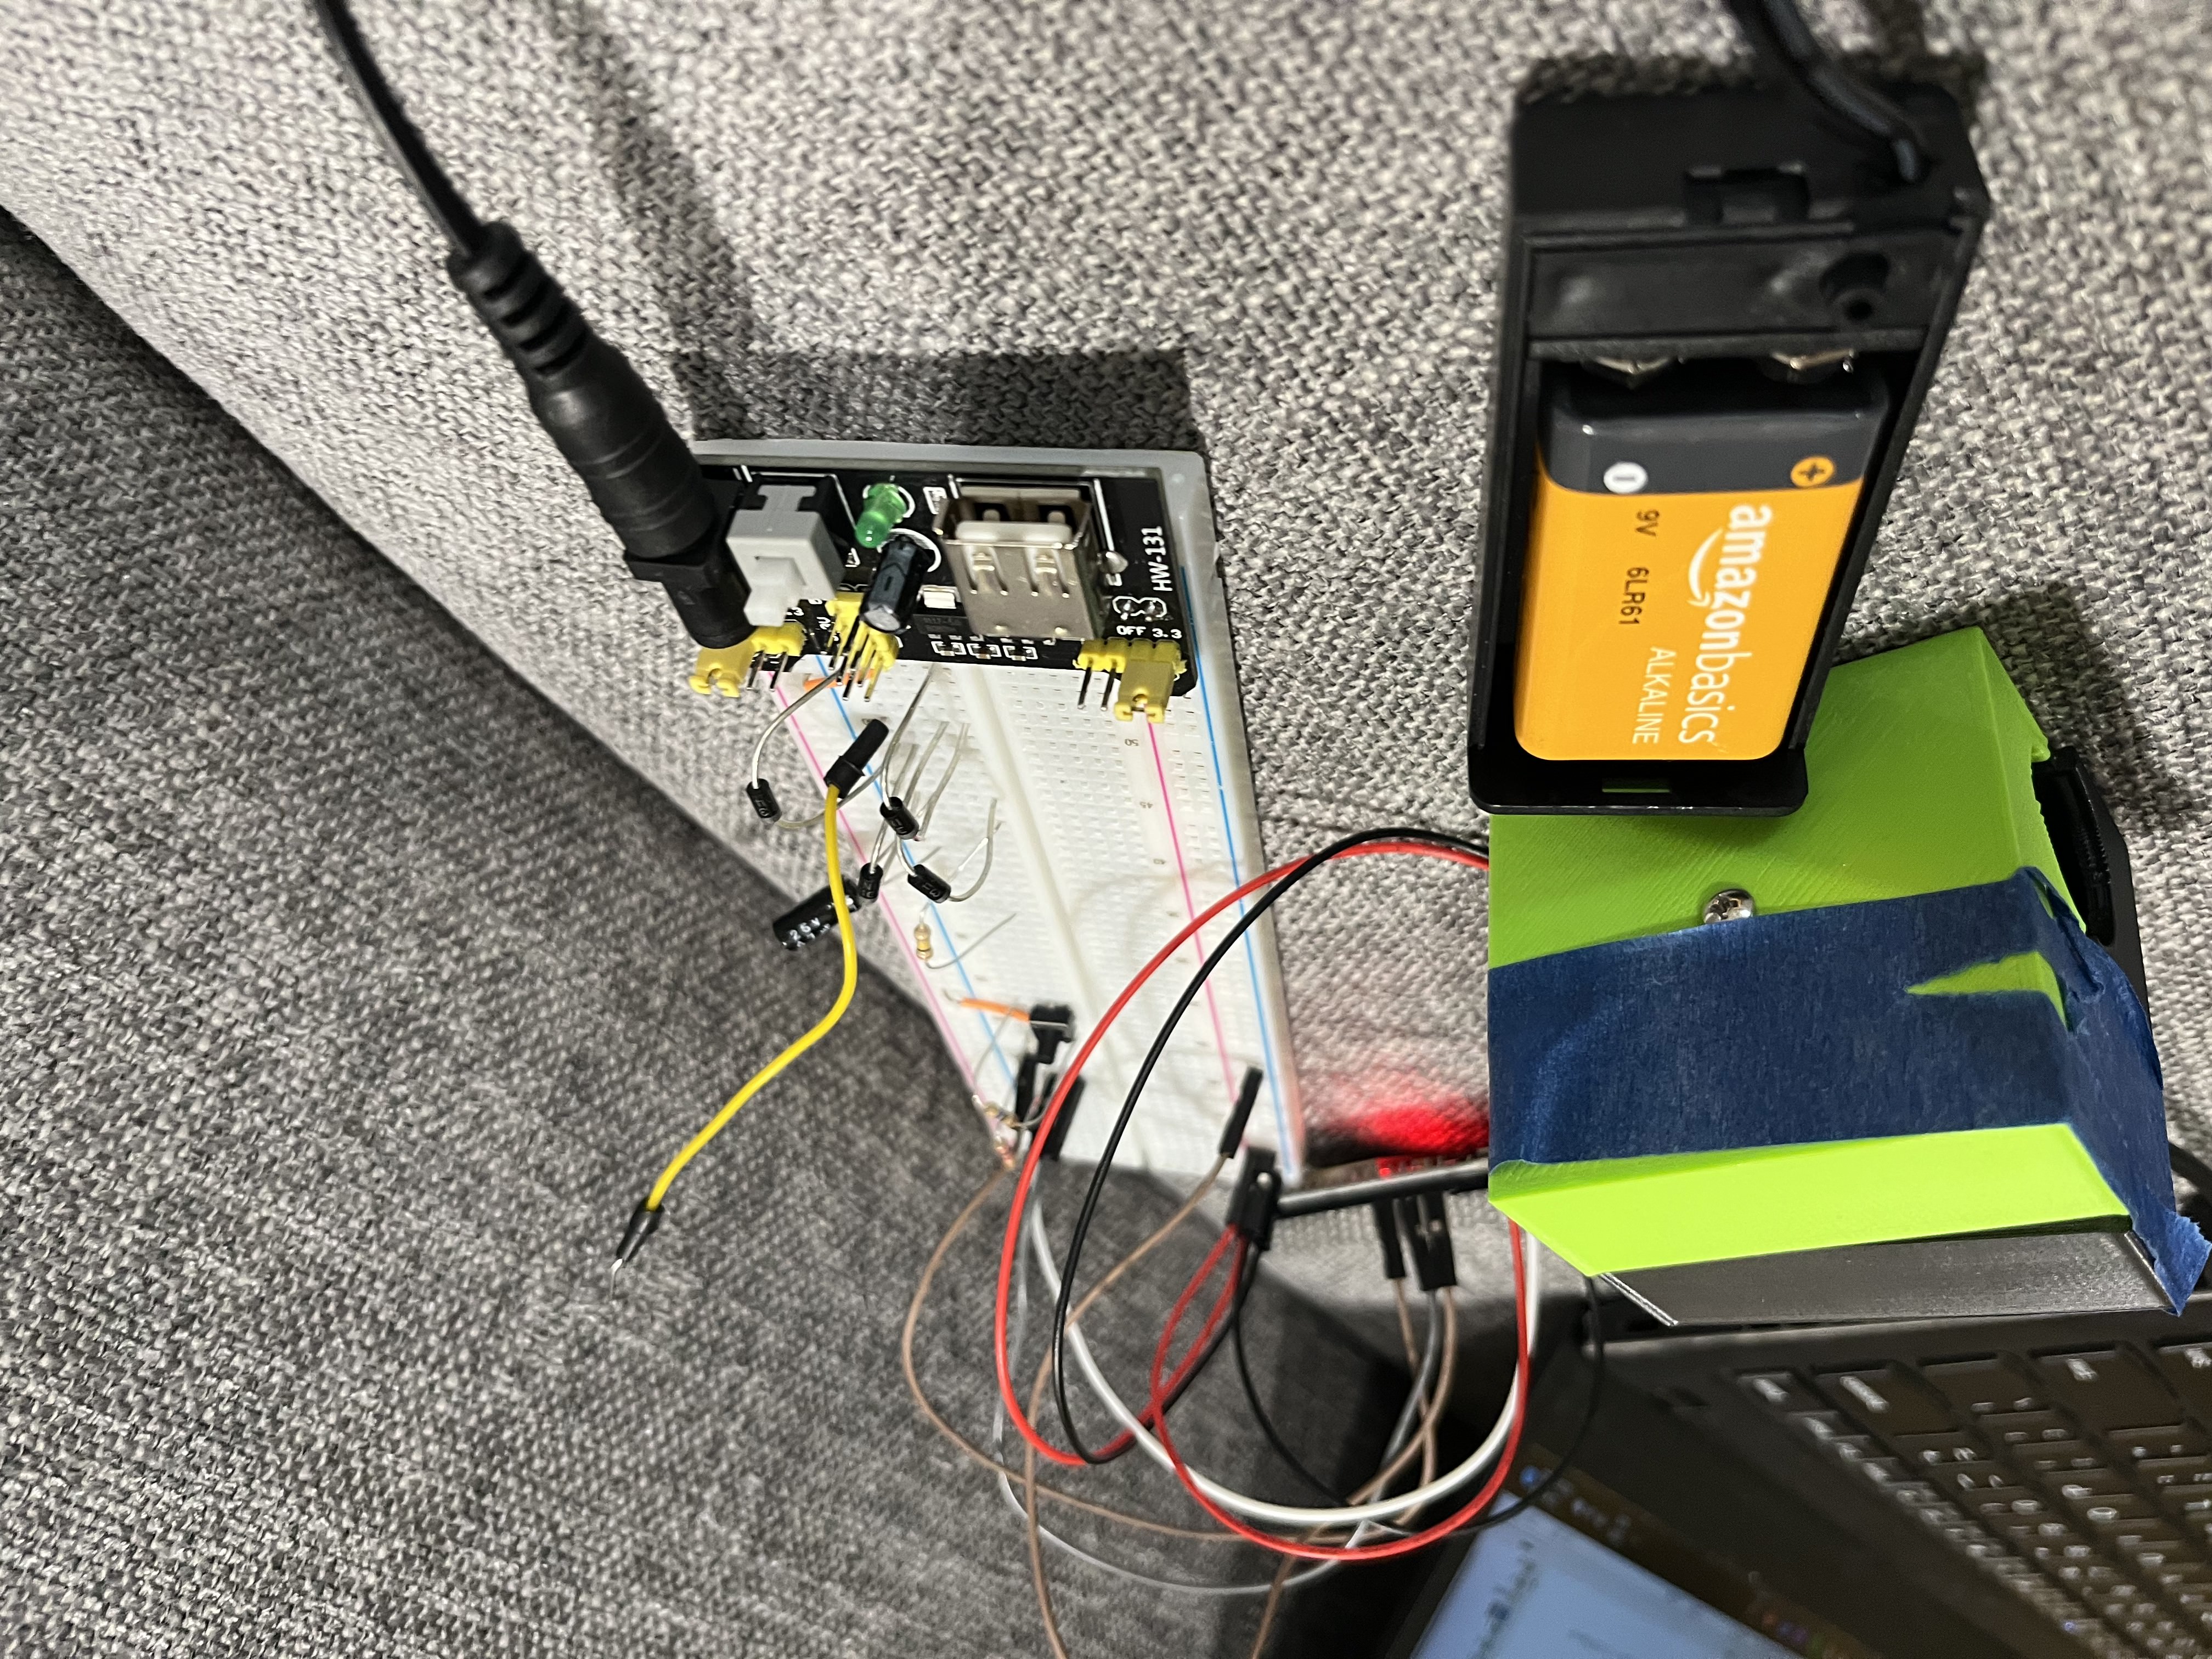
Sensor We needed to be able to sense the velocity of exhaled air. To do this, we 3d printed a wheel and utilized an IR transmitter and receiver. The IR transmitter and receiver form an IR line, which when broken by the wheel passing through it, sends a signal. The number of times that the line is broken and re-established over a given period of time indicates the speed at which the wheel is spinning, and therefore the velocity of exhaled air.
Data-Streaming We utilized HTTP protocol to send information directly to our web server. The requests library was also used extensively. In order to display the front-end information, we used get requests, and in order to stream information from the Arduino to the site, we used post requests. Finally, used chart.js to display the final data.
Data Analysis To analyze the data, we had to perform calculations based on the FEF (air velocity) that we acquired from our sensor. To calculate the FVC, the total volume of air that was blown out, we multiplied the FEF by the area that the air was passing through. The FEV1 , volume of air exhaled in the first second, was calculated by restricting the aforementioned calculation to only the first second of velocity data. the FEV1/FVC value was calculated by taking the ratio of the FEV1 and FVC.
Challenges we ran into
We had first hoped to use a flow sensor to simplify the calculations as well as our product itself, but this was not available. We then set out to develop our own sensor, which came with a lot of problems. We first tried using only a fan to estimate the velocity, but when the fan was not generating a sufficient voltage, we knew it was time to change tracks. Following this, it took a lot of prototyping and design to develop our IR-based approach. Additionally, when we began our board would not connect to the internet, making operating with requests impossible. Finally, we wanted to make our website aesthetically pleasing, which was difficult considering the time we had available. Therefore, we opted to integrate internet inspired designs within our functional website to create a product that was appealing to the eyes.
Accomplishments that we're proud of
- Real-world benefits of the product
- Innovative sensing method
- Low-cost materials
- Instant posting of data/statistics
- Aesthetically pleasing & functional website
What we learned
- Process of identifying a problem, brainstorming, prototyping, and developing a solution
- Full-stack web development
- HTTP Protocol/DNS Protocol
- Arduino Web Integration
- Visualizing data collected from hardware
What's next for Spiro
- Acquire a flow sensor for more accurate data reading
- Calibrate volume calculation based on known volumes of air
- Conduct market analysis to determine feasibility of business


Log in or sign up for Devpost to join the conversation.