Spin Finance Dashboard
Live Demo: https://spin-finance-dashboard.vercel.app/
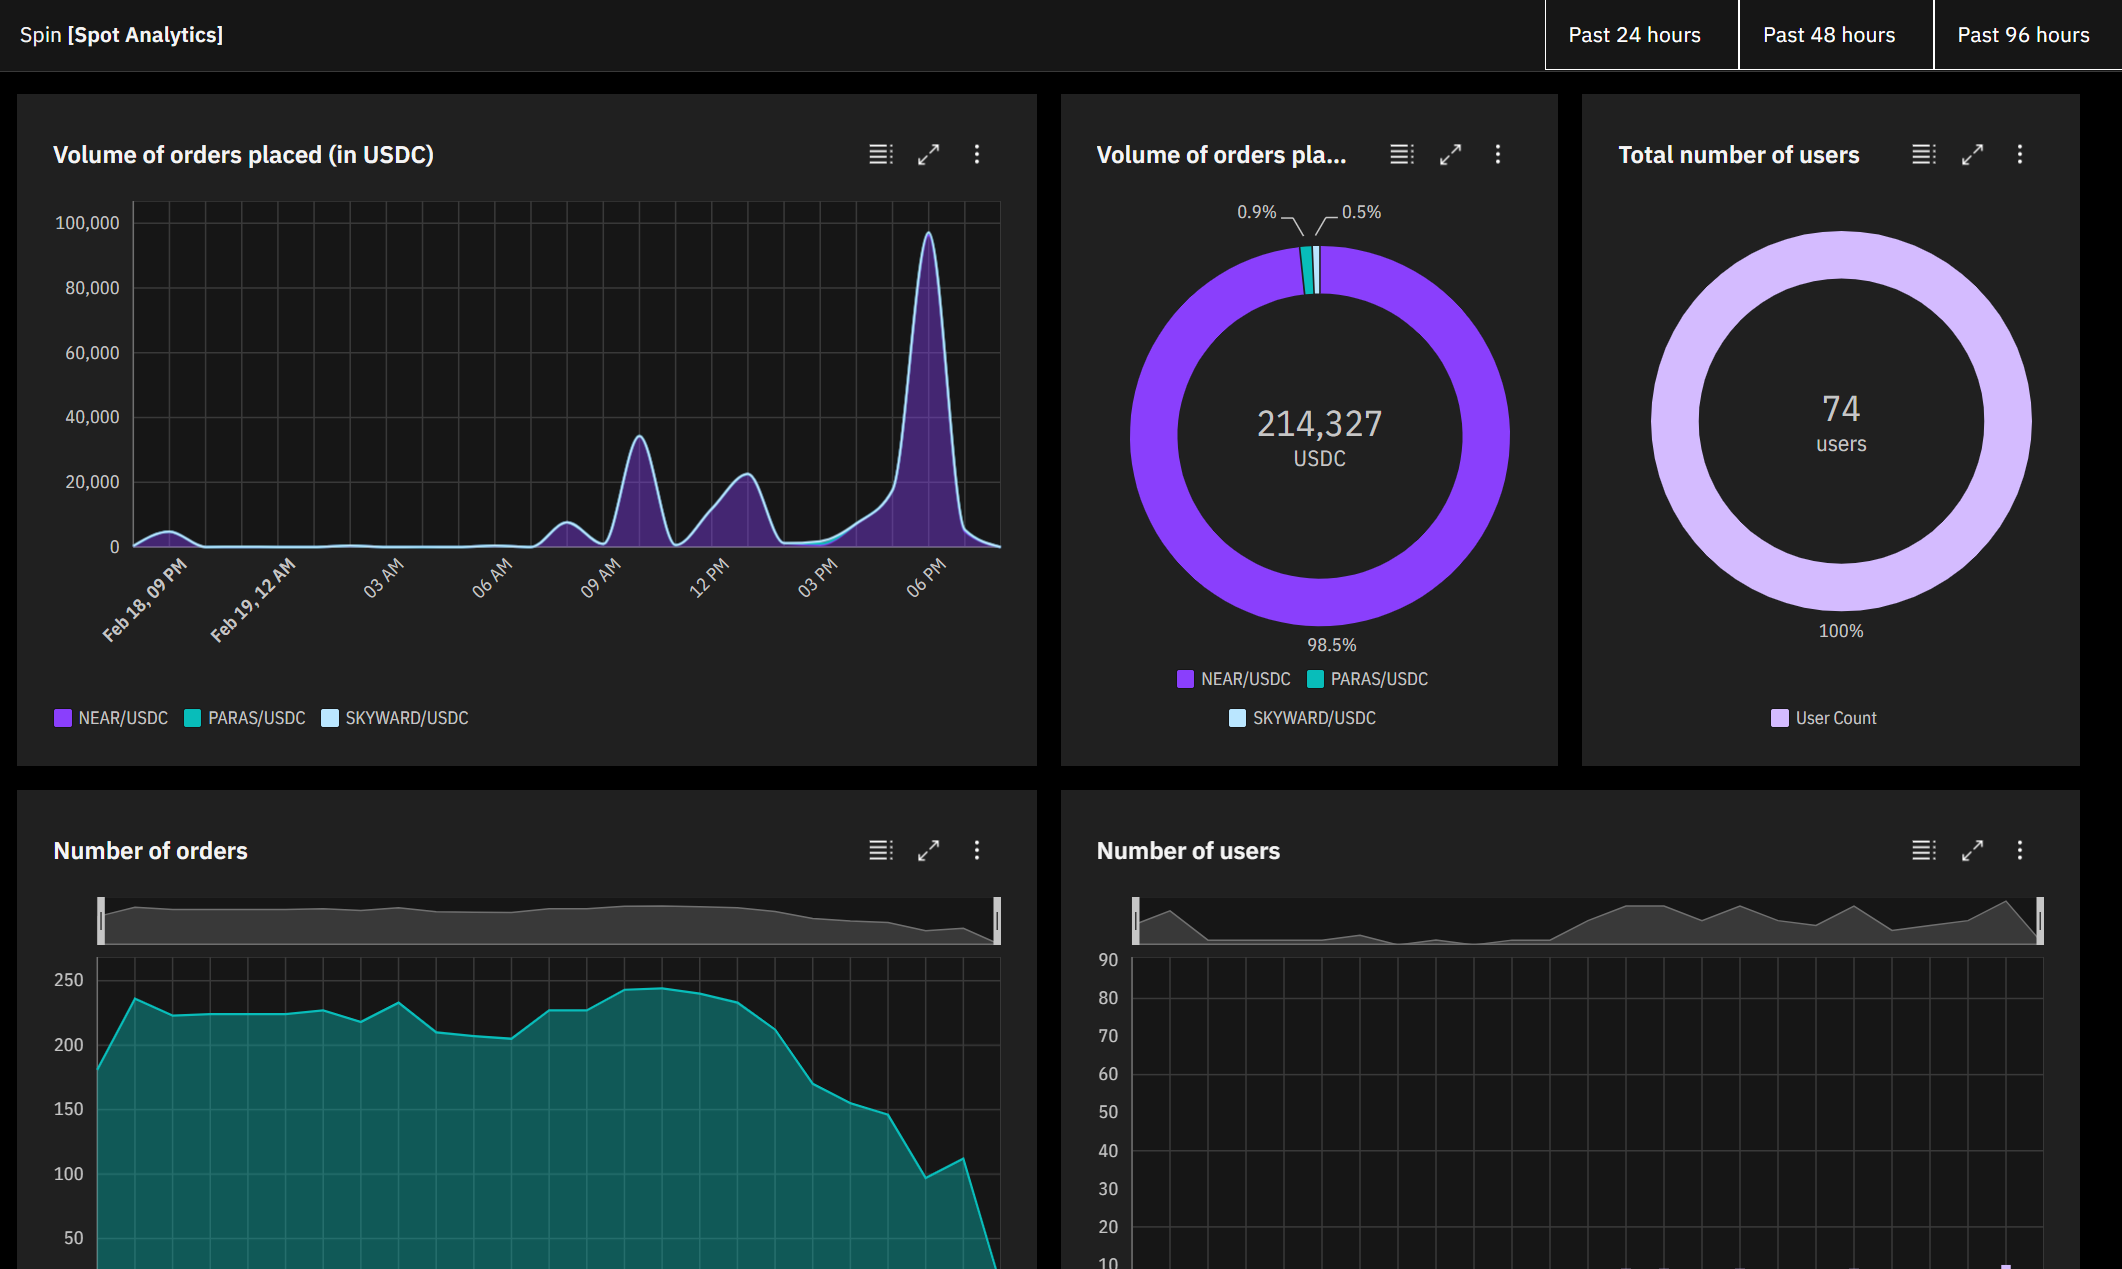
Explore Spin Finance spot metrics on NEAR
Spin Finance's spot markets are live on NEAR testnet, but there are no dedicated analytics to track its usage. Traders, investors and other stakeholders want to monitor Spin's performance using charts and metrics. Spin Finance Dashboard draws back the curtain and brings those metrics to the forefront.
Technologies
Spin Finance Dashboard uses:
- Instant server-rendered pages + incremental static regeneration using the lastest data via Next.js
- Latest blockchain data from the NEAR indexer
- Industry-standard charts and UI via IBM's Carbon Design Framework, by using the Carbon Components & Carbon Charts React packages
- A responsive, custom-built UI on both mobile and desktop
Metrics
- Volume of orders placed (in USDC)1
- Volume of orders placed per market (in USDC)1
- Number of users
- Number of orders
1 Note that volume of orders placed is the sum of all ask and bid orders (both market and limit orders) placed by users in a given time period. It does not take into account the removal of orders (drop_order).
Spin Finance Dashboard API
Spin Finance Dashboard exposes API endpoints that anyone can use to obtain key metrics and data.
- All endpoints require the
?lastHoursurl parameter (e.g.lastHours=48) - Additionally, you may specify a
groupByparameter (e.g.groupBy=hourorgroupBy=day)
Endpoints:
- For
/volumeendpoint, you can specify an optionalmarketIdparameter which will filter for a specifc market (e.g.marketId=1filters for NEAR/USDC only) - For
/volumeendpoint, omittingmarketIdreturns data categorized for each market pair. Alternatively,marketId=allreturns data summed and aggregated over all markets
/api/orders is a data-heavy endpoint and is available for local development only
Adapting the project
As Spin Finance adds new markets and deploys to mainnet, Spin Finance Dashboard should be able to adapt with ease.
Adding new markets
- Append the market id and market pair name in
config.jsonin the root of the project
Changing the Spin spot contract
- Change the account id in
config.json
Switching to mainnet
- Change the account id to the mainnet spot contract in
config.json - Change the indexer_uri to the mainnet indexer in
config.json
Adding a new metric
- Create a new endpoint file in
/pages/apifor the metric. Fetch the data in this file. - Call the API function and process the data in
/dashboard/Data.js - Use the data in a graph in
dashboard/UI.js
Local development
Clone, run yarn install or npm install and then start the development server:
npm run dev
# or
yarn dev
Open http://localhost:3000 with your browser to see the result.
Deploy
The easiest way to deploy Spin Finance Dashboard is via Vercel:
Explore other projects:
Previous hackathon wins:
Built With
- near
- next.js
- postgresql
- react
- spin

Log in or sign up for Devpost to join the conversation.