-
-
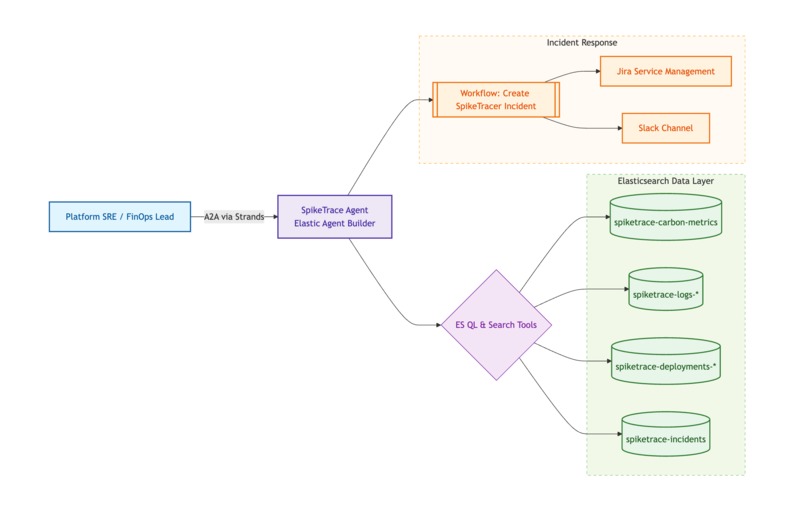
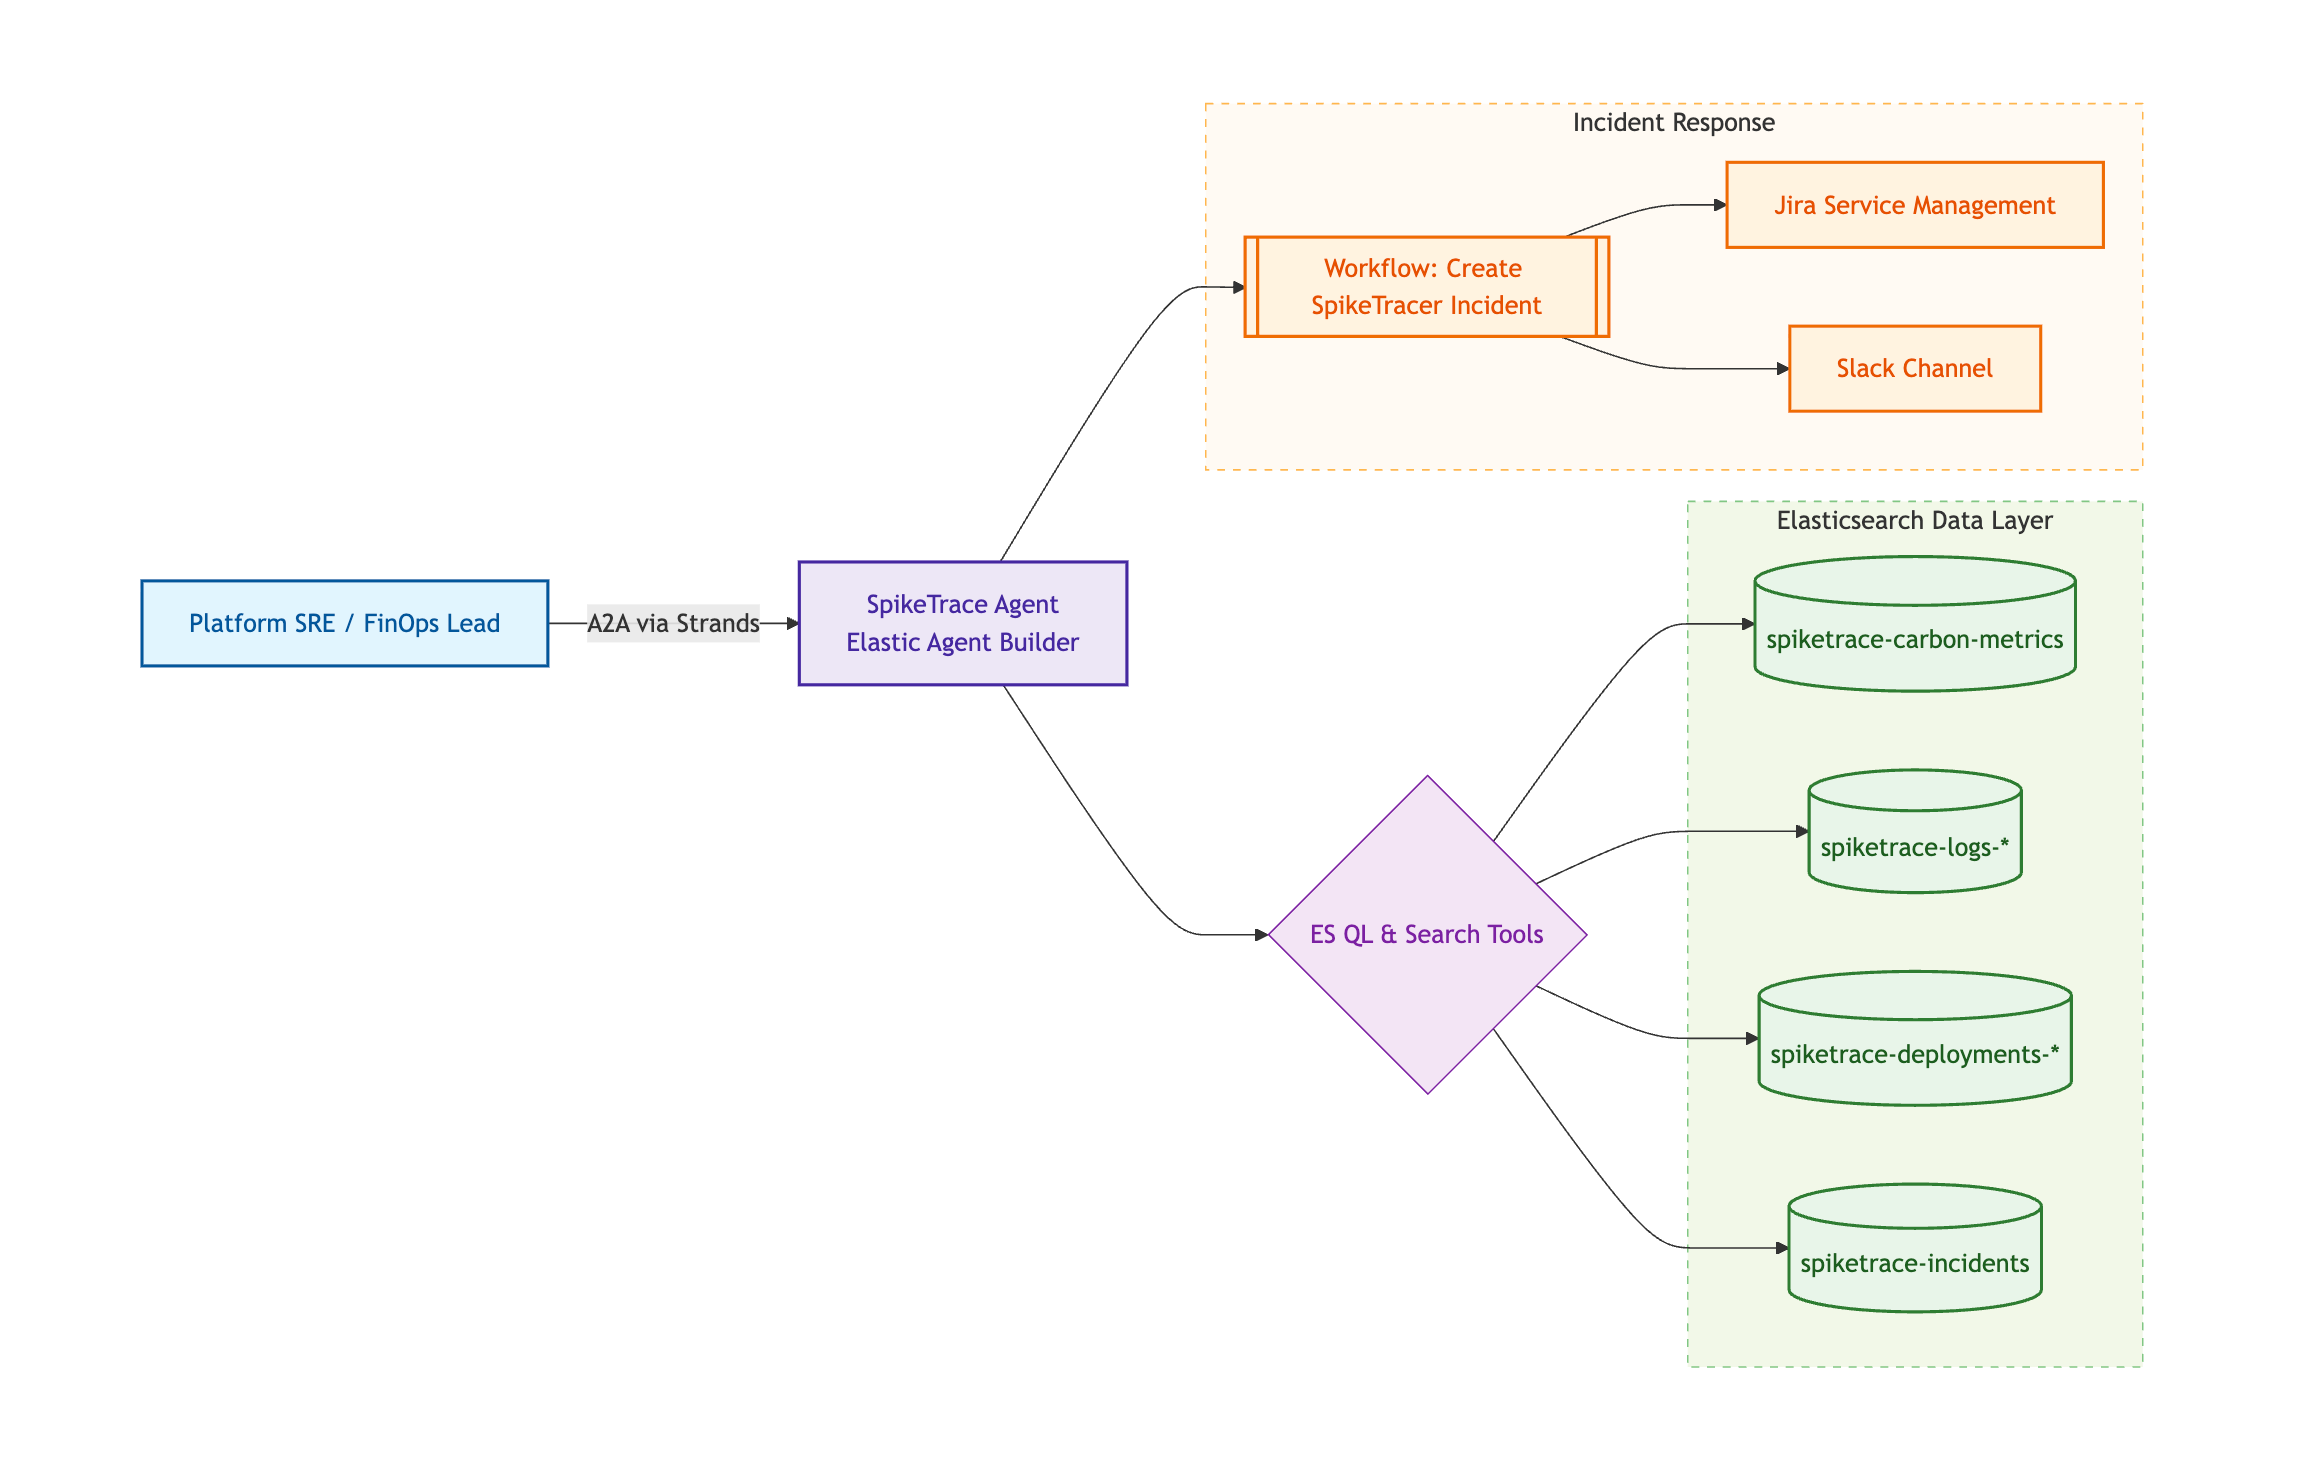
Architecture Diagram
Inspiration
Traditional observability tools tell you what broke. SpikeTrace asks a harder question: what did it cost? Not just in dollars—but in carbon and customer trust.
SpikeTrace was born to connect SRE, Finance, and ESG into one investigative loop—a true Triple Bottom Line commander that treats a carbon spike with the same urgency as a revenue drop.
What it does
SpikeTrace acts as an AI-powered Commander that investigates every incident through three lenses: users, carbon, and revenue.
Imagine an e-commerce giant like Amazon: An incident isn’t just a 500 error. It’s:
- A customer who couldn’t buy a gift
- Revenue that never landed
- Servers burning energy on pointless retries
SpikeTrace connects those dots instantly.
The SpikeTrace Ecosystem

At the center is the SpikeTrace Commander Agent — the brain that translates natural language into deep telemetry correlation.
1️⃣ Observability Correlation (Powered by ES|QL)
The agent queries across four dimensions:
- User Impact → Failed checkouts, latency spikes, rising error rates
- Environmental Impact → Wasted CO₂, excess runtime, inefficient retries
- Deployments & Logs → Correlates failures to specific releases (
spiketrace-deployments-*) - Business Impact → Orders affected and real revenue loss
It doesn’t just detect a spike — it explains it in business terms.
2️⃣ Autonomous Remediation
Once impact is quantified, SpikeTrace moves from insight to action:
- Creates a ticket in Jira Service Management
- Notifies the team instantly in Slack
Investigation → Decision → Execution. All in one conversational flow.
How we built it
- Elastic Stack → Indexed synthetic logs and carbon metrics
- Elastic Agent Builder → Created the “SpikeTrace Commander”
- Gemini via Vertex AI → Advanced reasoning + multi-tool orchestration
- Workflow Connectors → Chained Jira + Slack automation
- Strands Framework → A2A bridge between local frontend and Elastic Agent
- Kibana Dashboard → Visualized CO₂, latency, and emissions spikes in one pane
Challenges
The hardest part? Multi-dimensional correlation.
Mapping an UpstreamTimeout log to:
- A specific carbon emission increase
- A deployment version
- A quantified revenue loss
All without LLM hallucinations.
We solved it with strict grounding, structured prompts, and precise ES|QL aggregation—forcing the agent to reason only from real telemetry.
What we’re proud of
- 🌱 Triple Bottom Line Logic — Carbon waste prioritized alongside revenue
- ⚡ Zero-Touch Remediation — Discovery to Jira ticket in one turn
- 🔗 Seamless A2A Integration — Frontend to Elastic Agent via Strands
What we learned
Sustainability isn’t separate from reliability. Sustainability is an observability problem.
When systems fail or retry endlessly, they don’t just hurt SLAs—they burn energy and revenue.
Building SpikeTrace proved that AI agents shouldn’t just explain incidents. They should quantify impact and trigger action.
What’s next
- 🔮 Predictive Remediation — Use Elastic ML to detect carbon spikes before they happen
- ☁️ Multi-Cloud Intelligence — Correlate incidents across AWS, GCP, and Azure
SpikeTrace is evolving from an incident investigator… into a proactive sustainability commander.
Built With
- a2a
- elastic
- elastic-agent-builder
- elasticsearch
- kibana
- python
- strands-framework


Log in or sign up for Devpost to join the conversation.