-
-
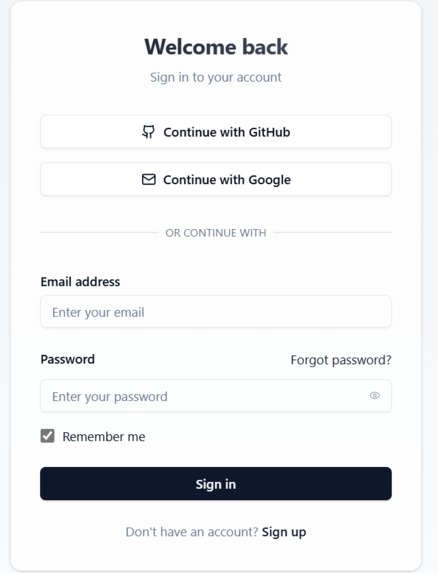
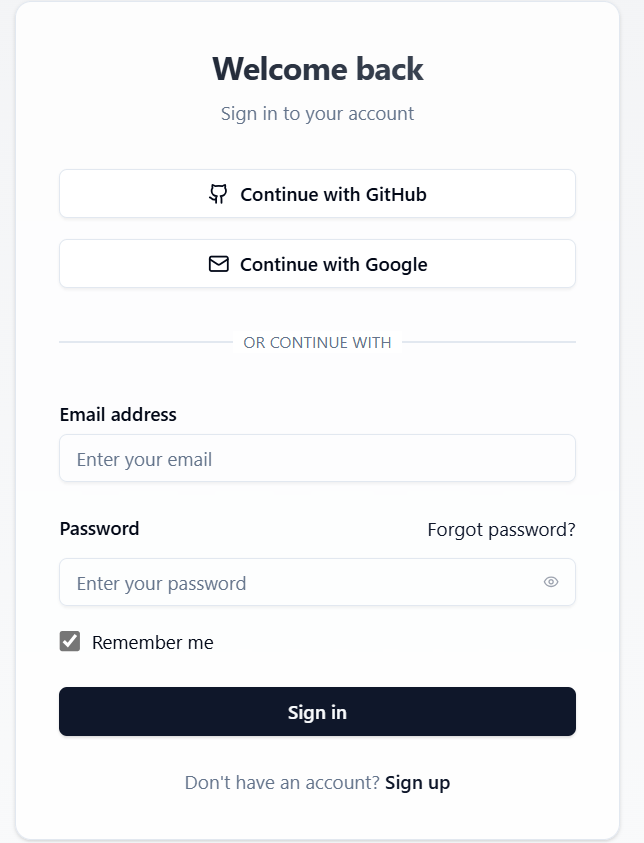
Login Page
-
-
-
-
-
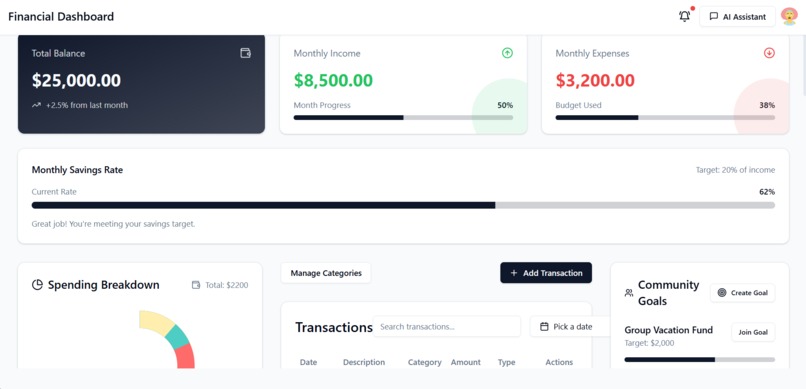
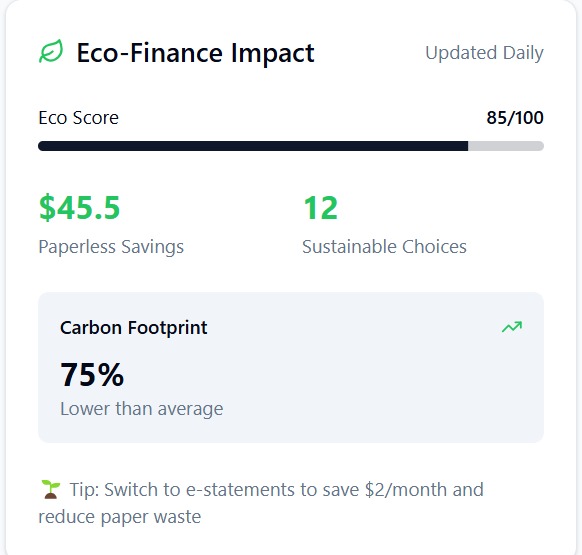
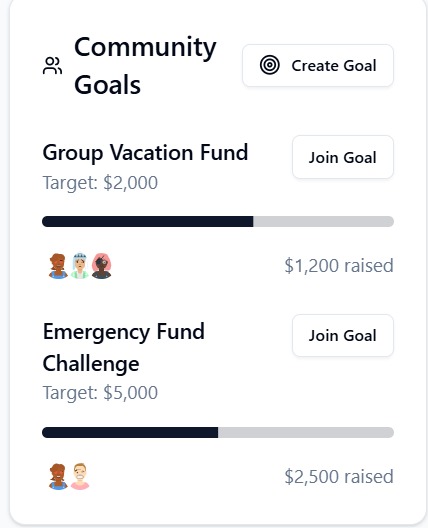
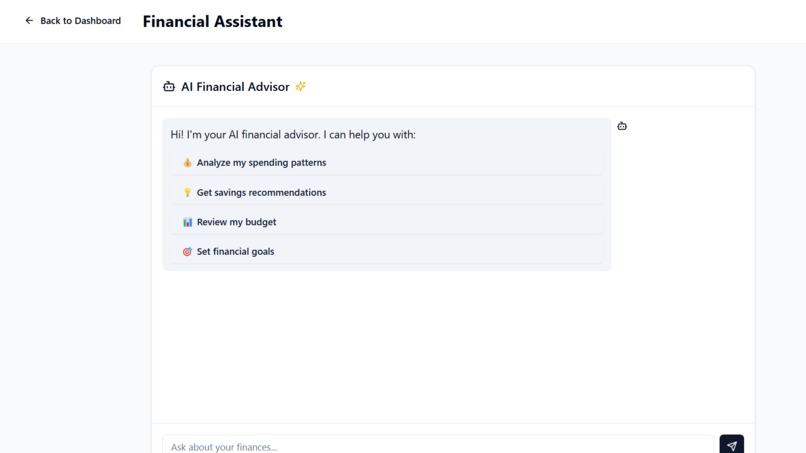
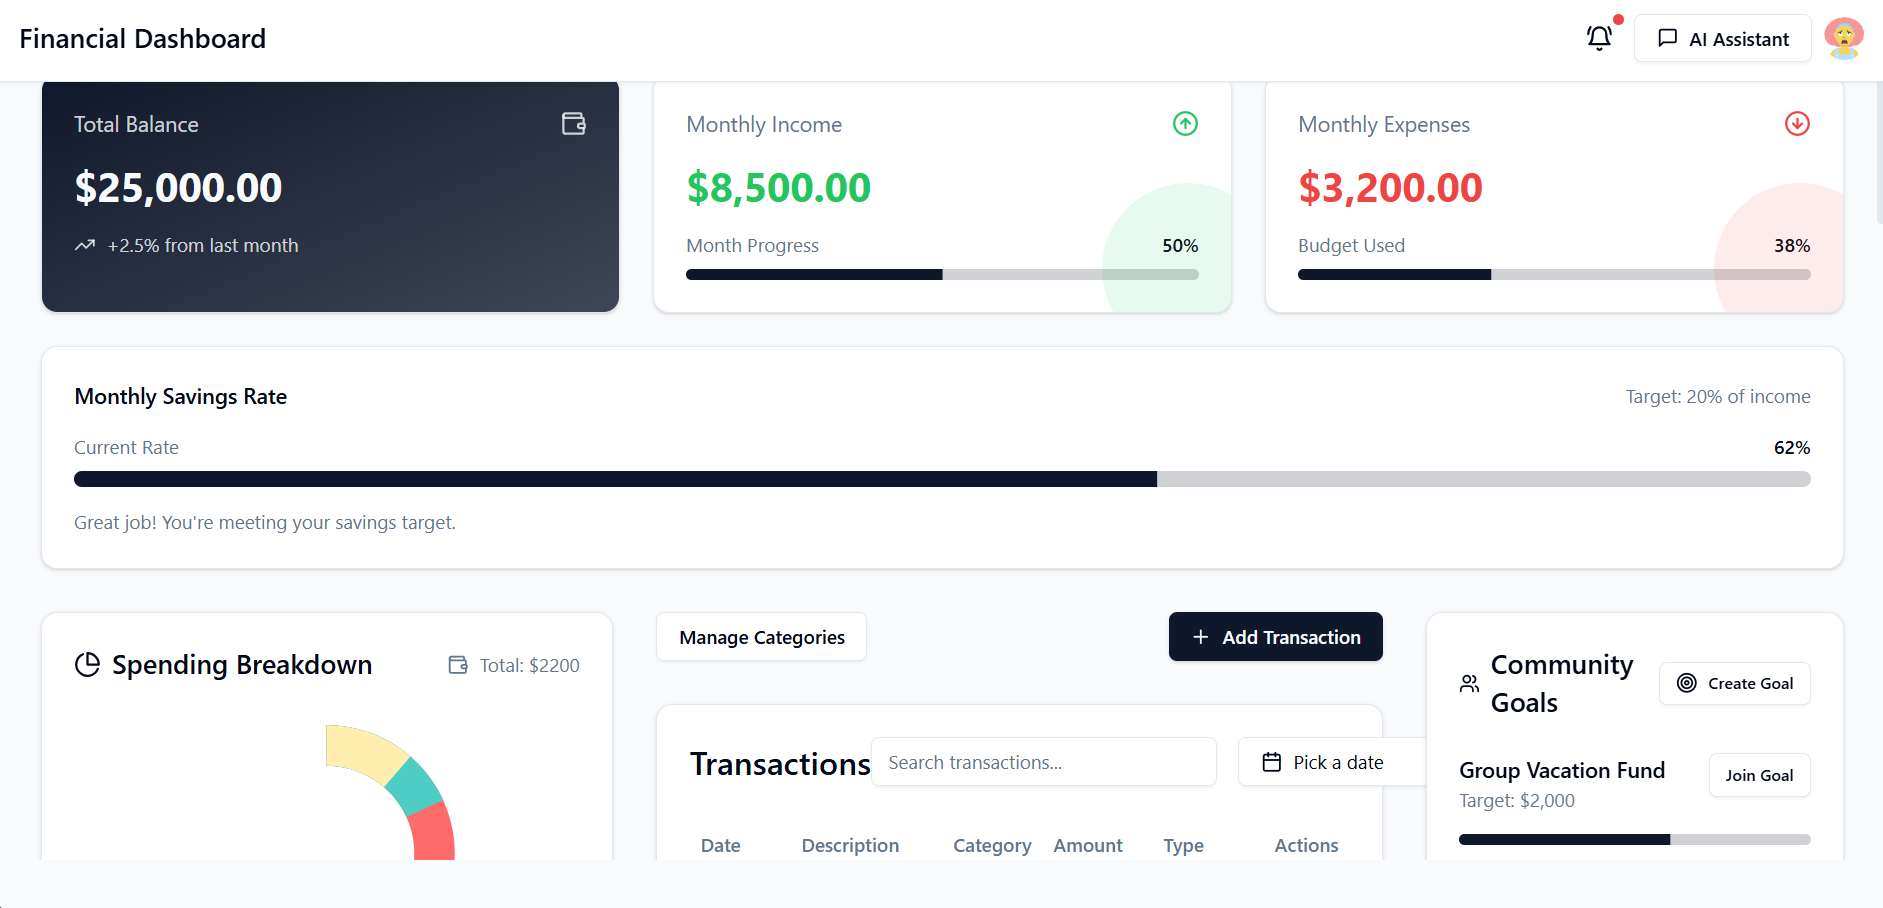
Main Page
About the Financial Dashboard Application
Inspiration
The inspiration for building this Financial Dashboard Application came from a desire to simplify personal finance management. Managing finances can often feel overwhelming, and many existing tools lack a balance between simplicity and detailed insights. This project aims to create an intuitive, user-friendly application that provides valuable insights into spending habits, financial health, and budgeting.
What I Learned
Throughout this project, I gained a deeper understanding of building modern web applications using React, TypeScript, and Vite. Key learning points include:
- Effective use of TypeScript for enhancing code reliability and maintainability.
- Creating dynamic and reusable components in React to optimize development time.
- Implementing data visualization techniques, such as integrating libraries for creating charts (e.g., the donut chart for spending breakdown).
- Understanding state management and how to handle user interactions, such as adding, editing, and deleting transactions.
- Building a responsive design that works seamlessly across desktop and mobile devices.
How I Built the Project
Tech Stack:
- Frontend: React and TypeScript for building the user interface and handling interactions.
- Build Tool: Vite for fast development and optimized builds.
- Styling: CSS modules and responsive design principles to ensure a clean and adaptive interface.
- Data Visualization: Libraries like Chart.js or Recharts for creating interactive and visually appealing charts.
Core Features:
- Transaction Management: Users can add, edit, and delete transactions easily.
- Spending Breakdown: A donut chart visualizes spending across categories for better insights.
- Financial Overview: Key metrics such as total balance, monthly income, and expenses are displayed at a glance.
- Savings Rate Tracker: Helps users monitor their progress toward monthly savings goals.
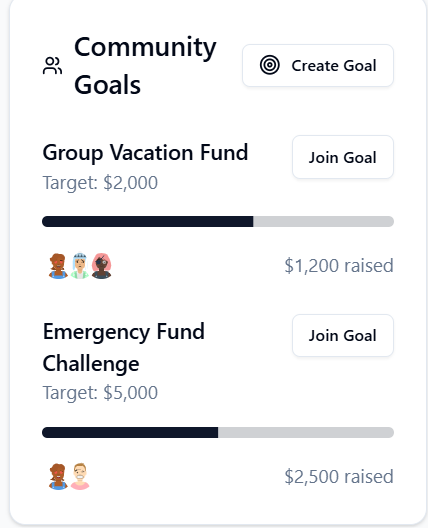
- Community Goals: Encourages collaborative financial planning by enabling group goal tracking.
Development Workflow:
- Designed wireframes and the user interface for an intuitive user experience.
- Built the core components and integrated state management to handle user interactions.
- Added real-time updates for financial data and implemented the spending visualization.
Challenges Faced
- Data Handling: Managing the flow of data across multiple components while maintaining efficiency and responsiveness was a significant challenge.
- Chart Integration: Customizing charts to display accurate financial insights required in-depth research and trial and error.
- Responsive Design: Ensuring the application works flawlessly across various screen sizes took meticulous attention to detail.
- Feature Prioritization: With many ideas to enhance the app, prioritizing features to meet deadlines was a consistent challenge.
Final Thoughts
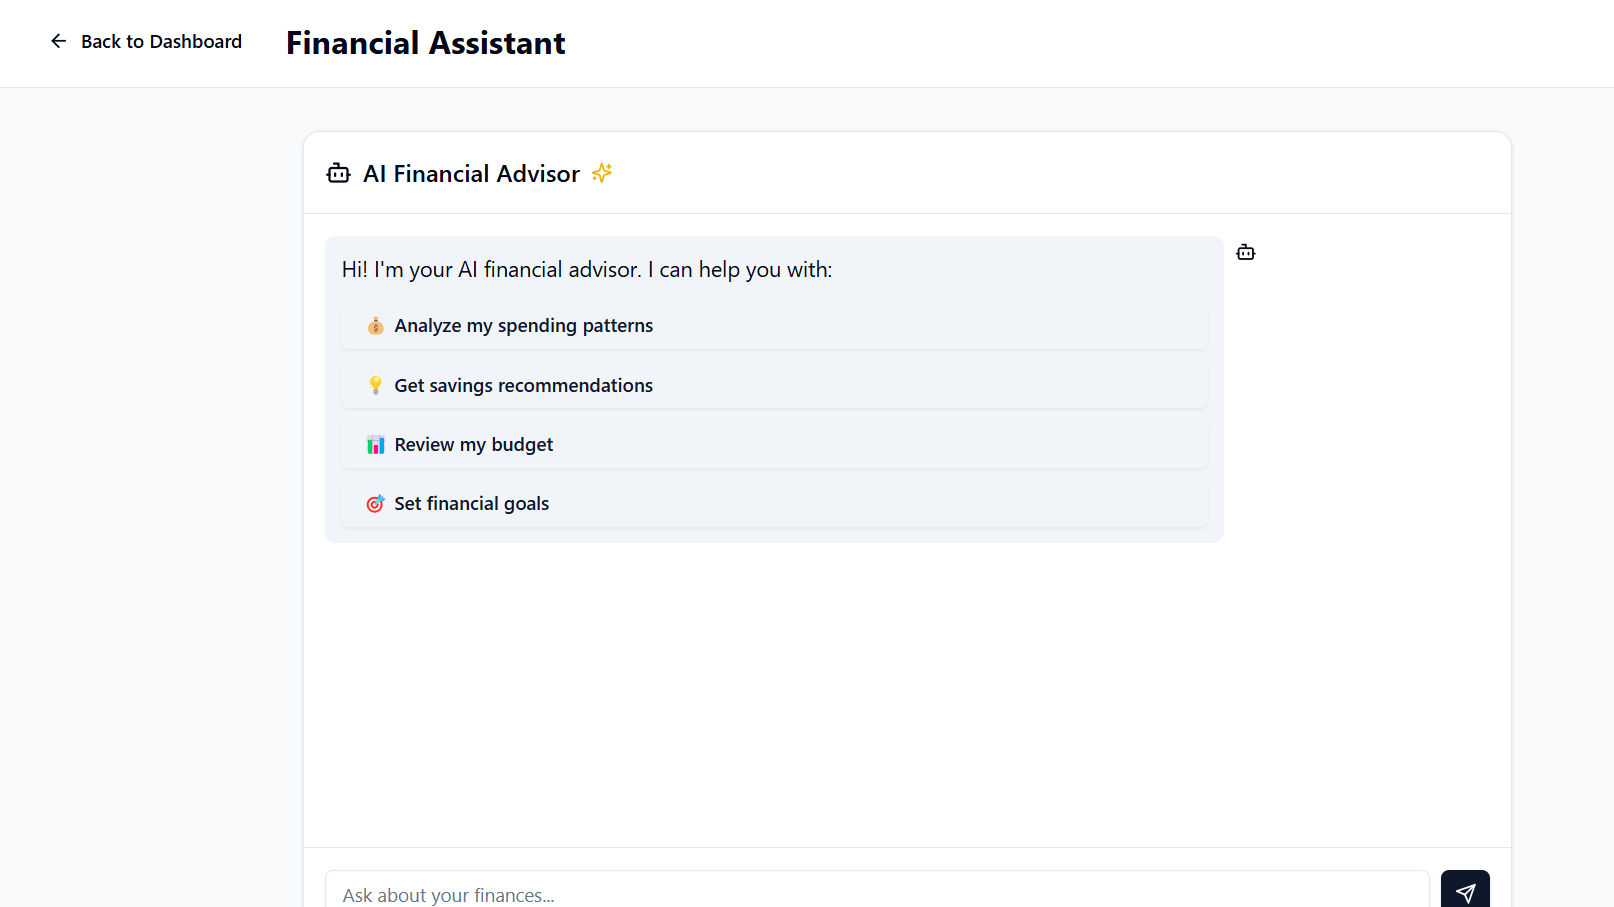
This project was a rewarding experience that improved my technical and problem-solving skills. It reaffirmed the importance of thoughtful design and user-centric development. I am excited to continue enhancing this application and exploring more advanced features like AI-driven financial recommendations and deeper analytics tools.
Built With
- react
- tempolabs
- ts
- vite

Log in or sign up for Devpost to join the conversation.