-
-
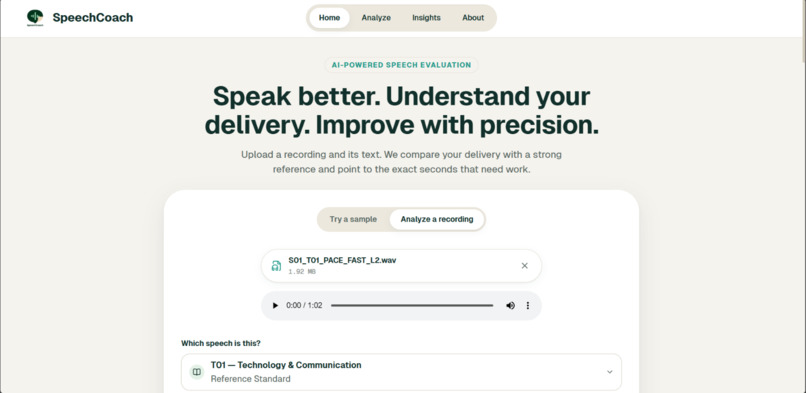
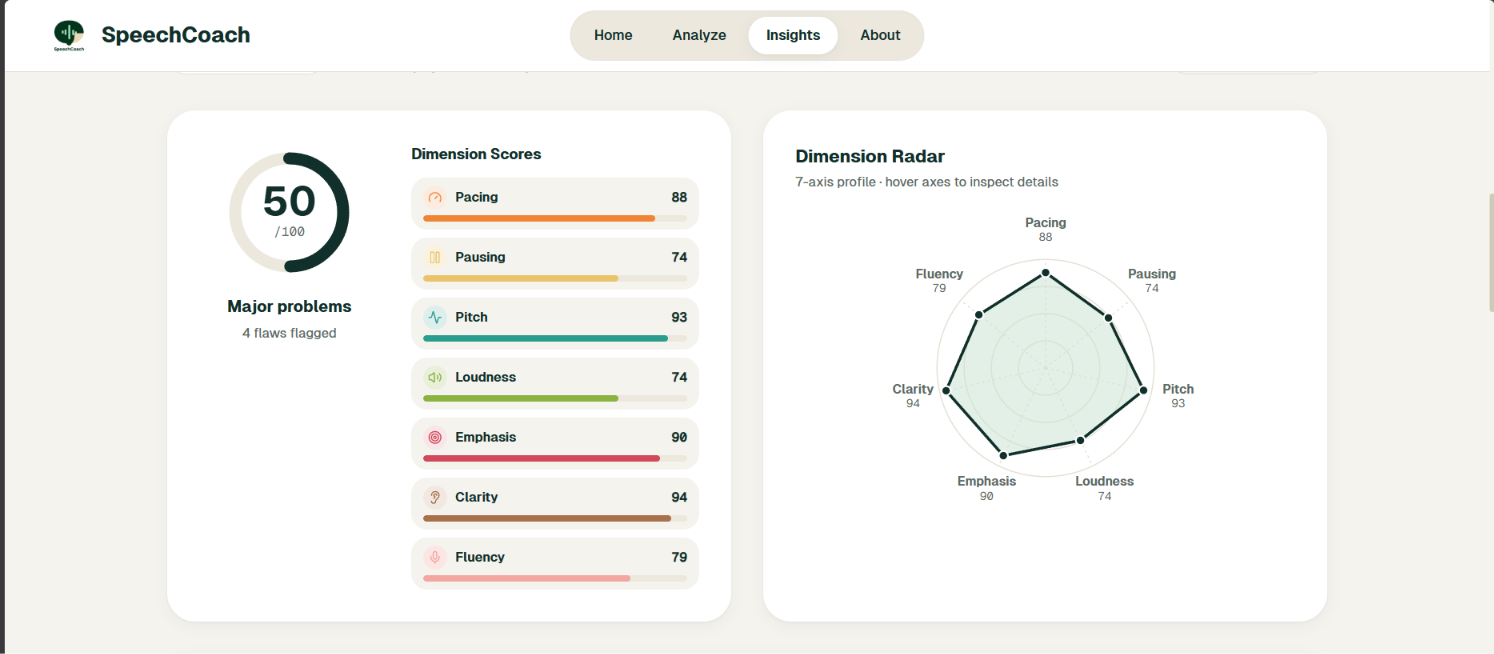
Dashboard
-
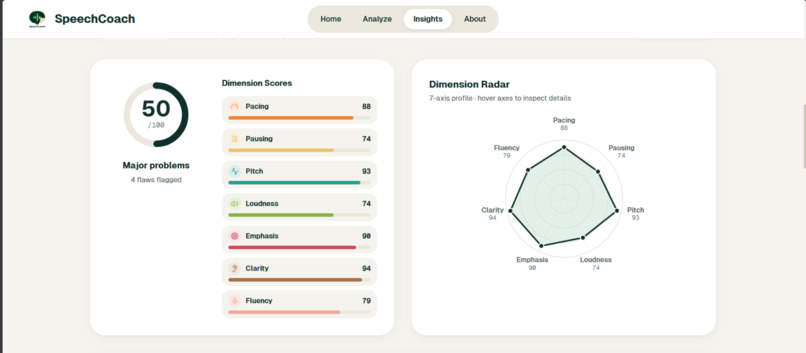
Flaw scoring
-
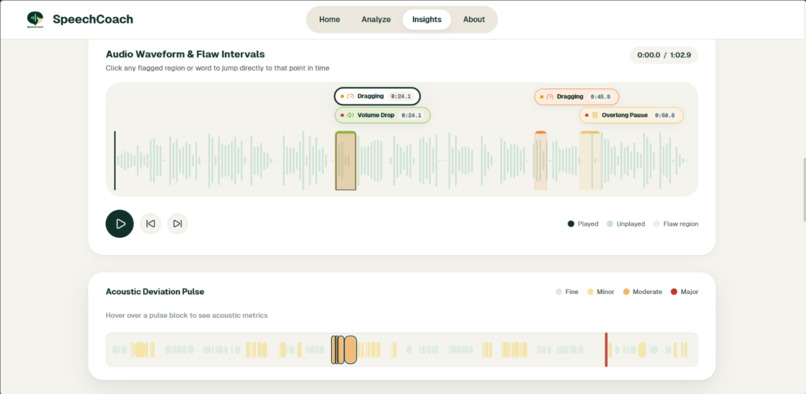
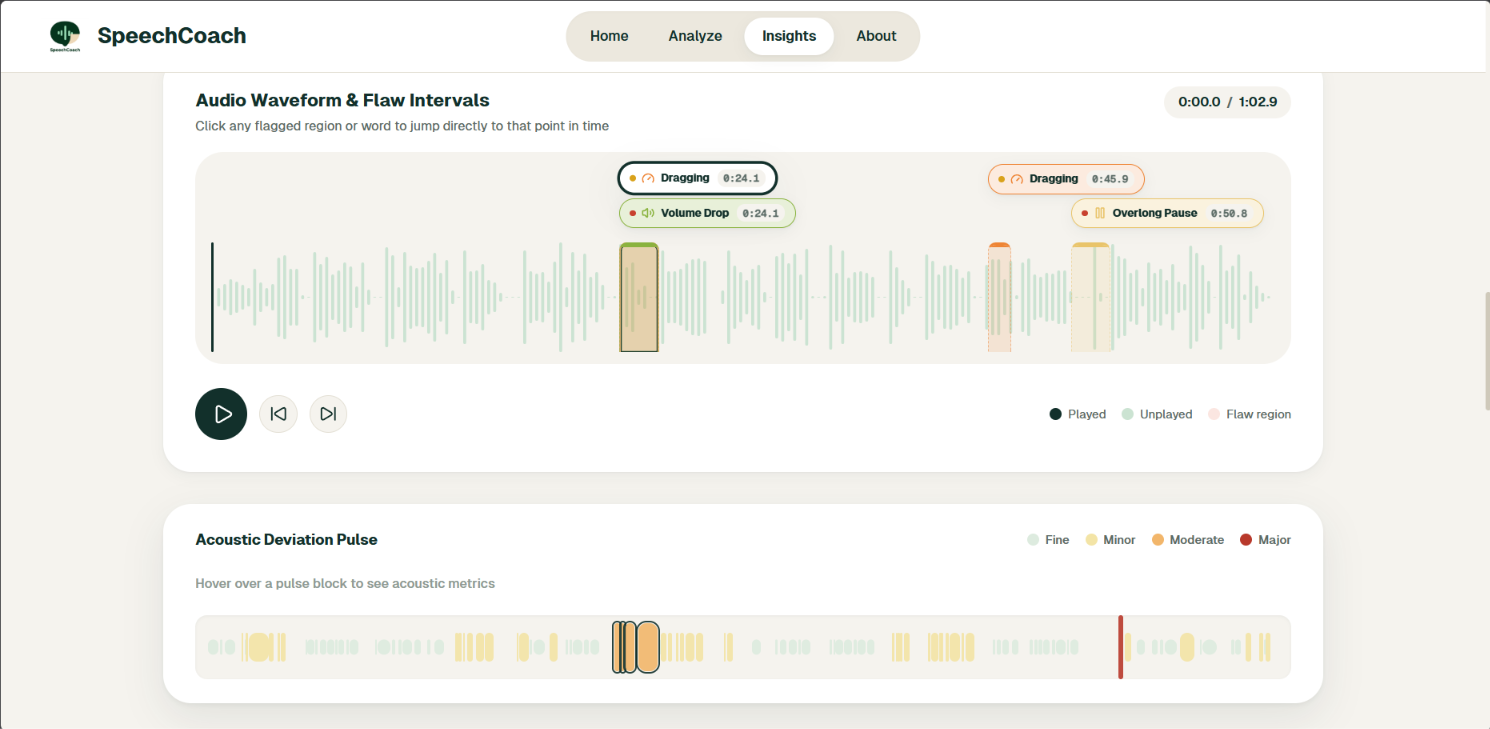
Flaw with timestamps
-
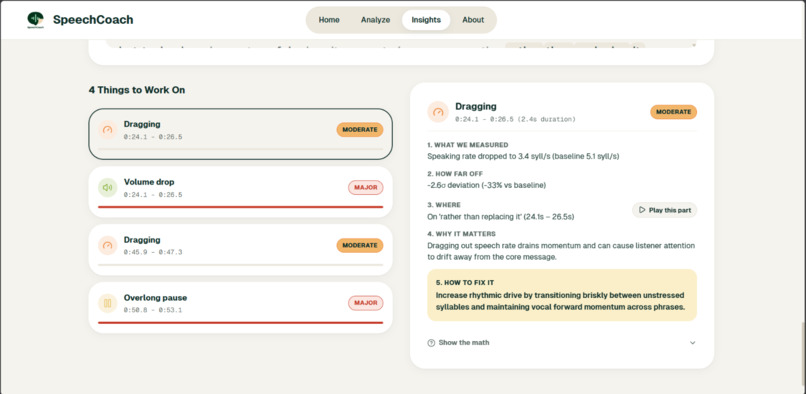
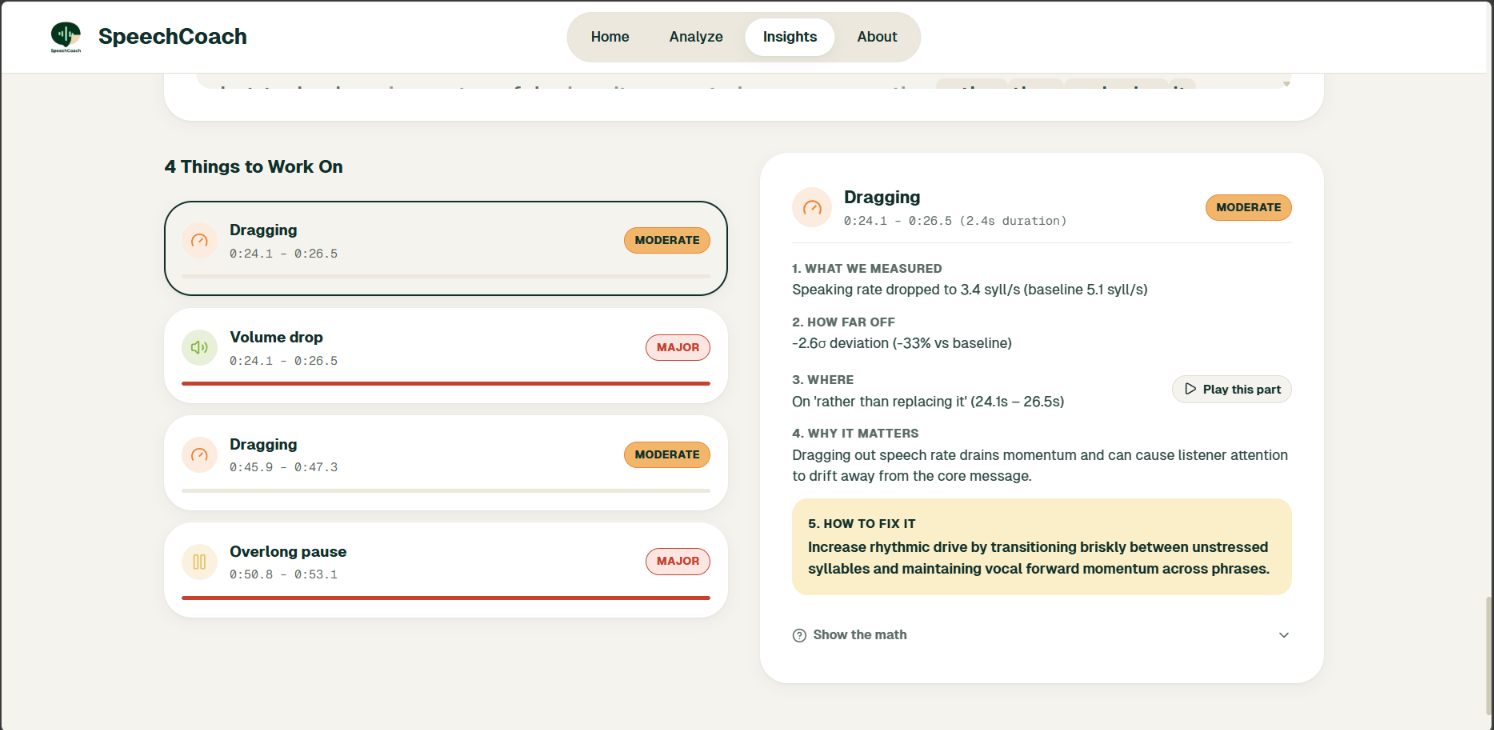
Explanation card
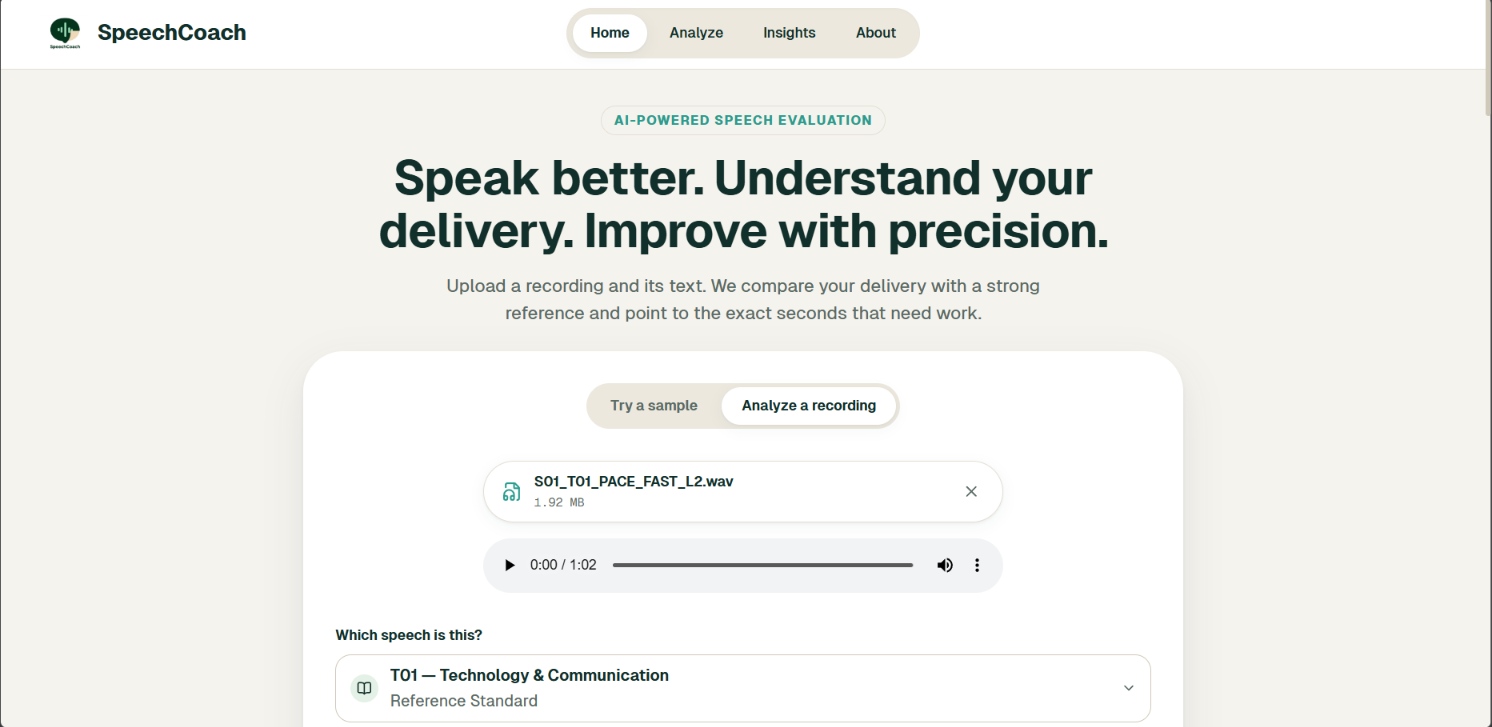
Inspiration
Speech competitions such as declamation, extempore and persuasive oratory are judged by humans, and human judging is subjective. Two judges can score the same speech differently, and competitors who lose points for delivery usually get advice like "watch your pacing" or "add more energy." That tells them nothing about where the problem was or why it counted against them.
We asked a simple question: can a machine find the exact second a delivery goes wrong and explain it with numbers?
The obstacle is data. Datasets for speech recognition are everywhere, but none map good delivery against bad delivery of the exact same words. So we decided to build one ourselves.
What it does
SpeechCoach takes an audio recording and its transcript, and returns:
- a 0 to 100 delivery score with seven subscores: pacing, pausing, pitch, energy, clarity, emphasis and fluency
- flaw regions with start and end timestamps snapped to word boundaries
- a number-backed explanation for each flaw, with no generative model involved
A real output from our pipeline:
32.7s to 36.0s, PAUSE_LONG: pause extended to 3.34 s (typical < 0.50 s), +10.60 robust standard deviations above the typical range. Fix: keep transition pauses between 0.3 s and 0.8 s.
An interactive dashboard shows the speaker's pitch, loudness and pace against a baseline band, shades the flaw regions, and plays the audio from any flagged moment with one click.
How we built it
1. A contrastive dataset, recorded by us. We wrote eight texts: four adapted public orations and four original team texts whose copyright we own. We recorded them ourselves with speakers of different voices and natural tempos. We kept natural variety, such as a fast talker at about 4.6 syllables/s versus a slow one at about 3.4, labeled as good, so the system never punishes someone for their natural style.
For every clean recording we created flawed "mirrors" of the same text across six flaw types (fast pace, slow pace, long pauses, flat pitch, erratic pitch, low volume) at three severity levels (subtle, moderate, severe). Flaws sit in short 1.5 to 4 s sections, so the detector must find where a fault happens.
Because we inject each flaw ourselves, its time span is known by construction. After a stretch or silence insertion, every later timestamp is remapped onto the edited file's own timeline:
$$t_{\text{new}} = t_{\text{insert}} + \Delta t_{\text{silence}} + \frac{t - t_{\text{insert}}}{\text{rate}}$$
We then verified every label against the raw audio, independently of the aligner, measuring silence length, pitch spread, RMS loudness and syllable rate. All 432 flawed files passed. The dataset has 467 recordings and 464 minutes of audio.
2. Speaker-agnostic features. We align transcript to audio with torchaudio's MMS_FA forced aligner, group words into phrases, and normalise each feature the way its physics demands. Pitch becomes semitones relative to the speaker's own median:
$$st(t) = 12 \log_2!\left(\frac{F_0(t)}{\operatorname{median}(F_0)_{\text{voiced}}}\right)$$
Loudness is measured in dB against the speaker's own loud phrases, pace in syllables per second, and pauses stay in raw seconds because time is physical.
3. Two-layer deviation with robust statistics. Each phrase is compared with the speaker's own norm (local) and with a population of good recordings (global), using a robust score:
$$z = \frac{x - \operatorname{median}}{\max!\left(1.4826\cdot \operatorname{MAD},\ \sigma_{\text{floor}}\right)}$$
Median and MAD stop the flaws from contaminating their own baseline. Regions are found with hysteresis (a higher threshold to enter a flaw, a lower one to exit), a minimum duration, and gap bridging, so one stumbled syllable isn't flagged but a real lapse is.
4. Explanations that can't lie. Each flaw produces an evidence record, and a deterministic template turns that record into text. The explanation always matches the math and never changes between runs.
5. Scoring and dashboard. Subscores come from deterministic rules. The overall score uses ridge regression on soft features with isotonic calibration, validated leave-one-speaker-out. The dashboard is React with WaveSurfer.js and D3, backed by a FastAPI service, packaged in Docker, with hashes frozen in results/frozen.json for reproducibility.
Challenges we ran into
Machine learning failed first, and that taught us the most.
- An unsupervised IsolationForest gave over 14 false alarms per minute on clean speech, because natural expressive speech looks like an anomaly.
- Word-level Random Forests broke on aligner jitter: a 40 ms vs 120 ms disagreement on a tiny word looked like a 300% speed change.
- Z-scoring everything corrupted physical quantities such as pause length.
We moved to deterministic signal processing with phrase-level units and hysteresis.
Our own bug fooled us. For a while we saw hundreds of "flaws" in clean files claiming a pace of 0.0 syllables/s. The cause was that silent gaps between phrases were being scored as speech. Marking gap frames as unassessed fixed most of it.
Labels had to be proven. Early recall numbers looked poor, and verification showed some of our ground-truth windows were on the wrong time axis after stretching. Remapping labels and adding independent verification made the numbers meaningful.
Speaker bias. Our held-out speaker S04 naturally speaks fast and varies pitch a lot, which exposed false positives that tuning speakers hid. We kept S04 untouched until the final run.
Accomplishments we're proud of
- A verified contrastive dataset where every flaw label passed an independent check (432 of 432)
- Explanations that carry the measured value, the baseline and the deviation, with no hallucination
- A reproducible pipeline: frozen parameters, SHA-256 hashes, and Docker
What we learned
- Label quality matters more than model complexity. Verified labels let us tell a real detector failure from a data bug.
- Normalise by physics. Pitch is log-scaled, pauses are absolute, and loudness is relative; one rule for all features breaks something.
- Humans judge phrases, not milliseconds. Smoothing at phrase level matched how a person hears a flaw.
- Report failures honestly. Our results are mixed, and saying so made the work more trustworthy to us too.
Honest results and limitations
- On clean speech we see 0.86 false positives/min on tuning speakers and 2.75/min on the held-out speaker, above our 0.5 target.
- Severe (L4) flaws are detected for pace, long pauses and erratic pitch on the dev split, but those test cells are very small.
- Subtle (L2) flaws fall below the detection threshold by design, and flat-pitch detection on short phrases is still weak.
- The learned overall score correlates only weakly with severity (Spearman $\rho \approx 0.19$ to $0.32$), so the deterministic subscores and flaw regions are the primary feedback.
- Flaws are synthetic, and the speaker cohort is small.
What's next
More speakers, accents and ages; real human mistakes alongside synthetic ones; a better overall score model; and a lower false-positive rate through per-speaker calibration.
Built with
Python, PyTorch, torchaudio (MMS_FA), Parselmouth (Praat), PyWorld, Librosa, PyLoudnorm, scikit-learn, FastAPI, React, Vite, WaveSurfer.js, D3, Docker


Log in or sign up for Devpost to join the conversation.