-
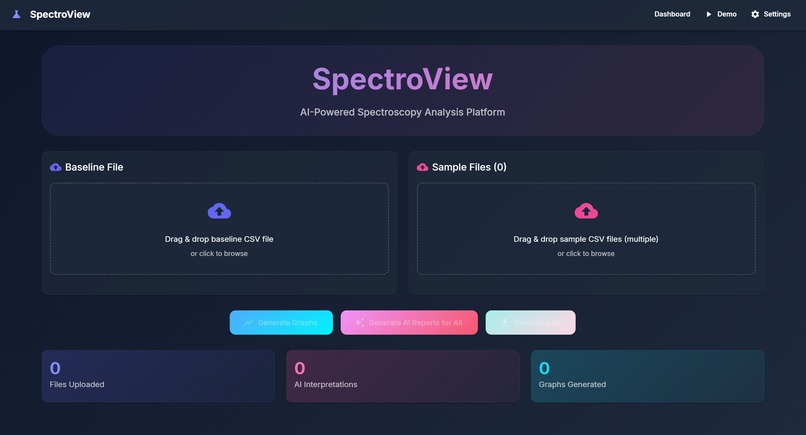
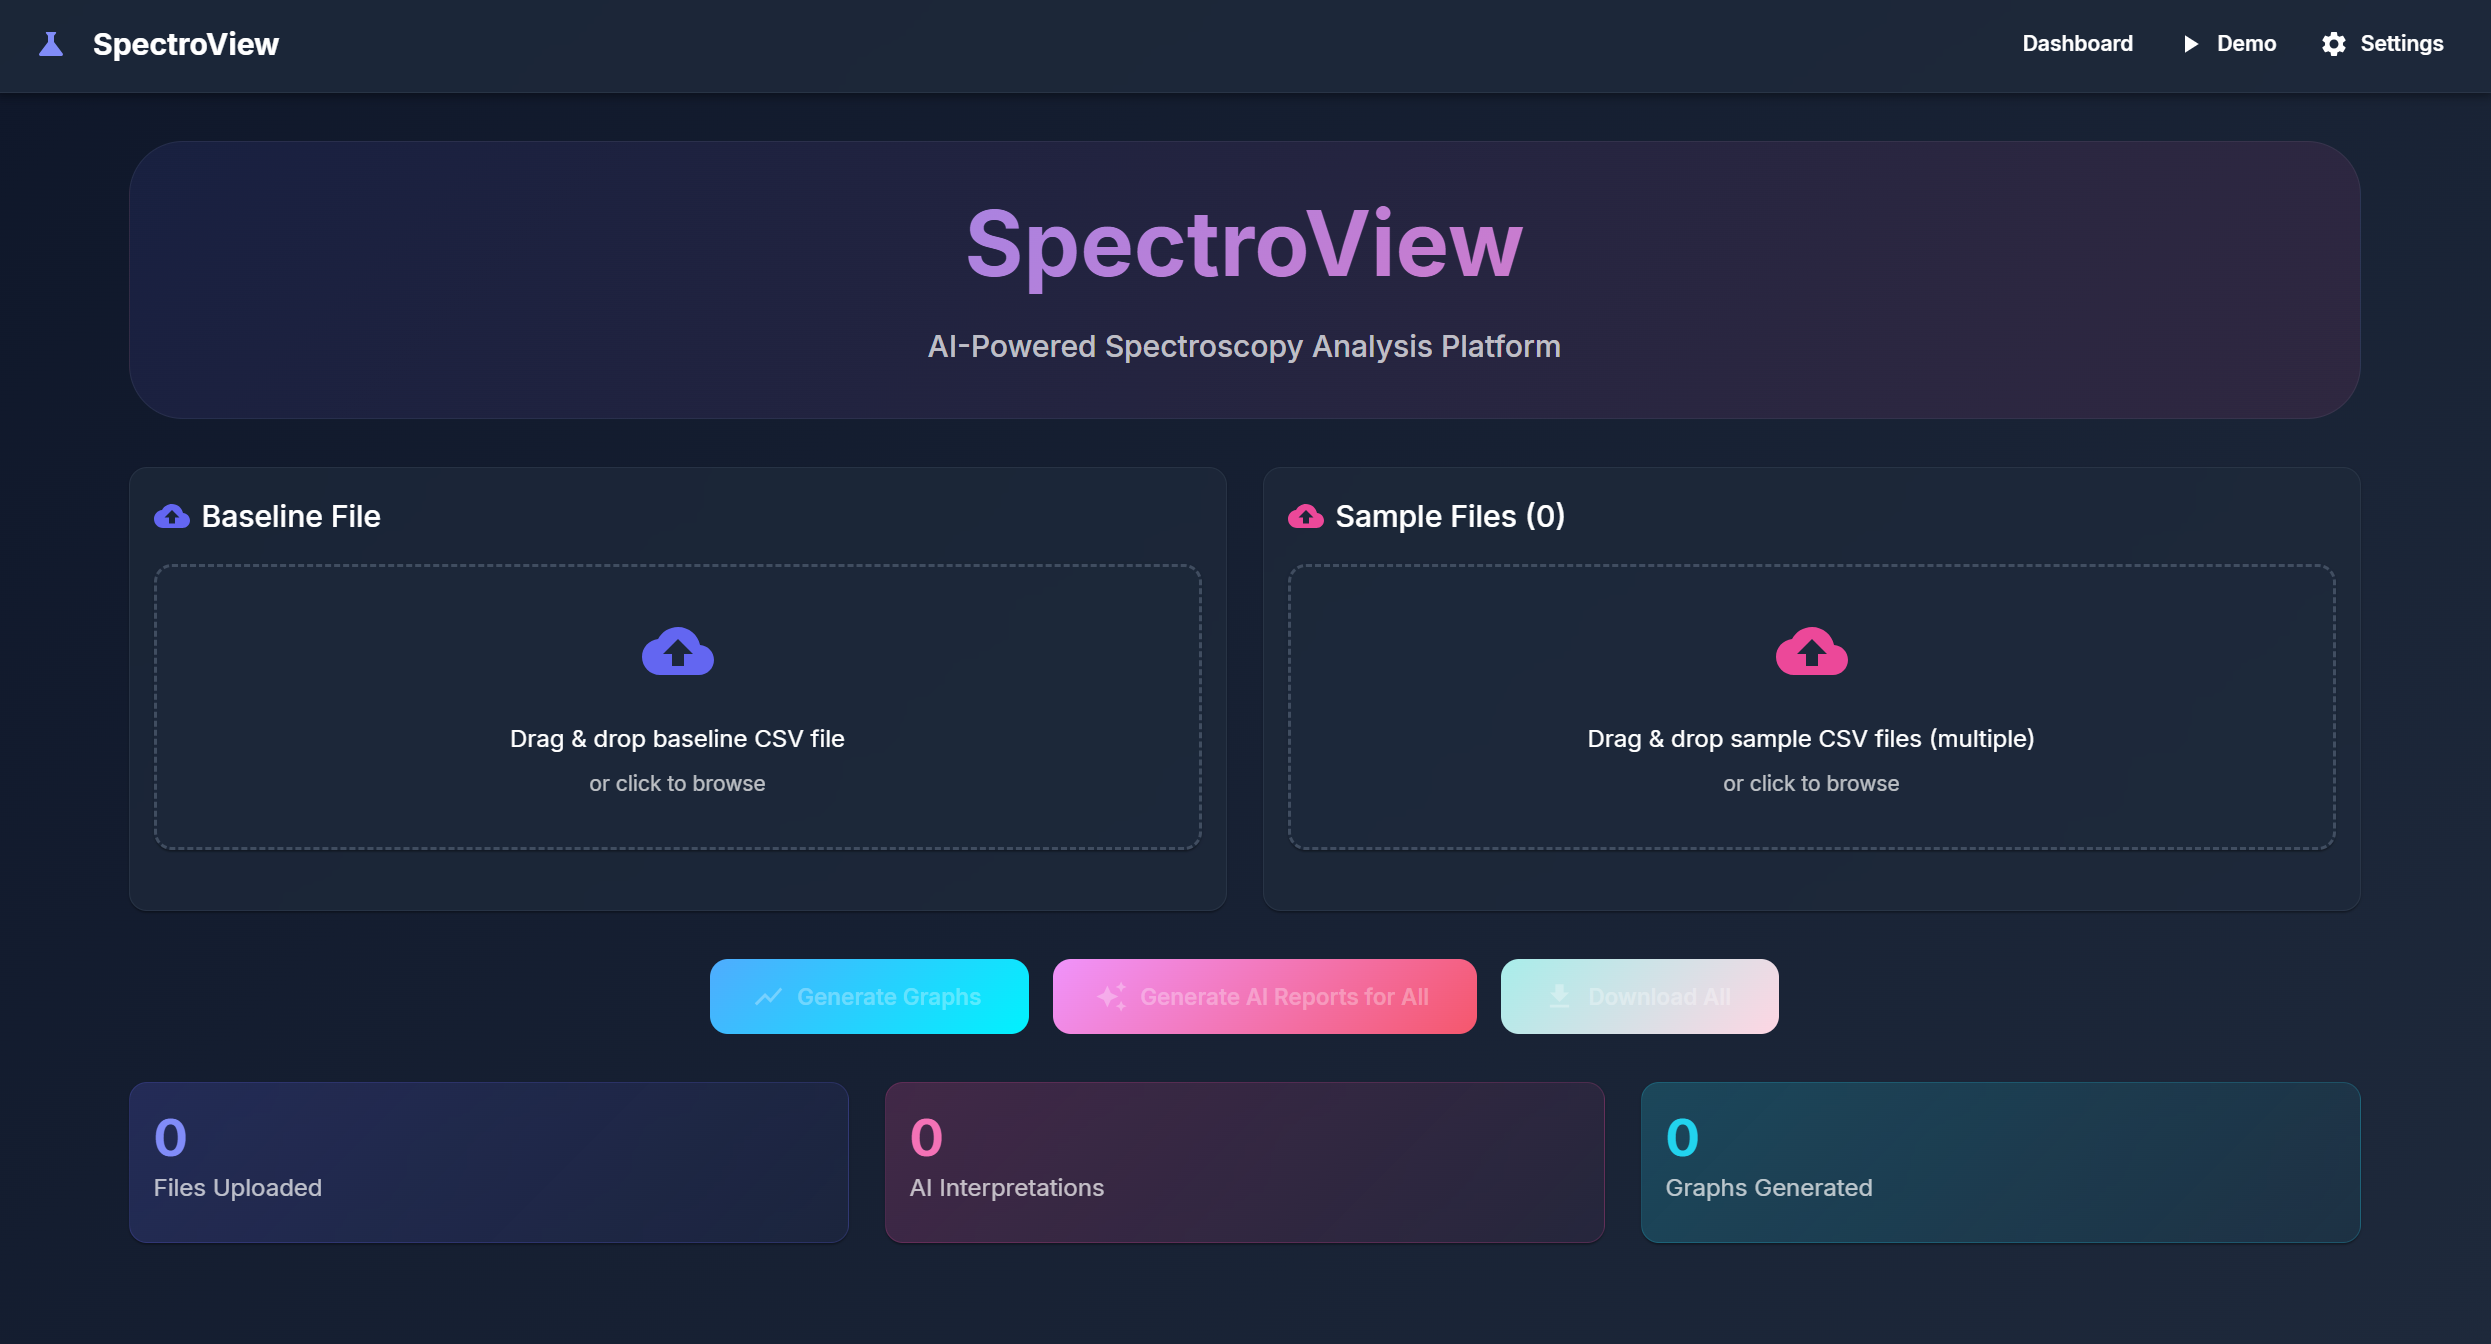
Dashboard
-

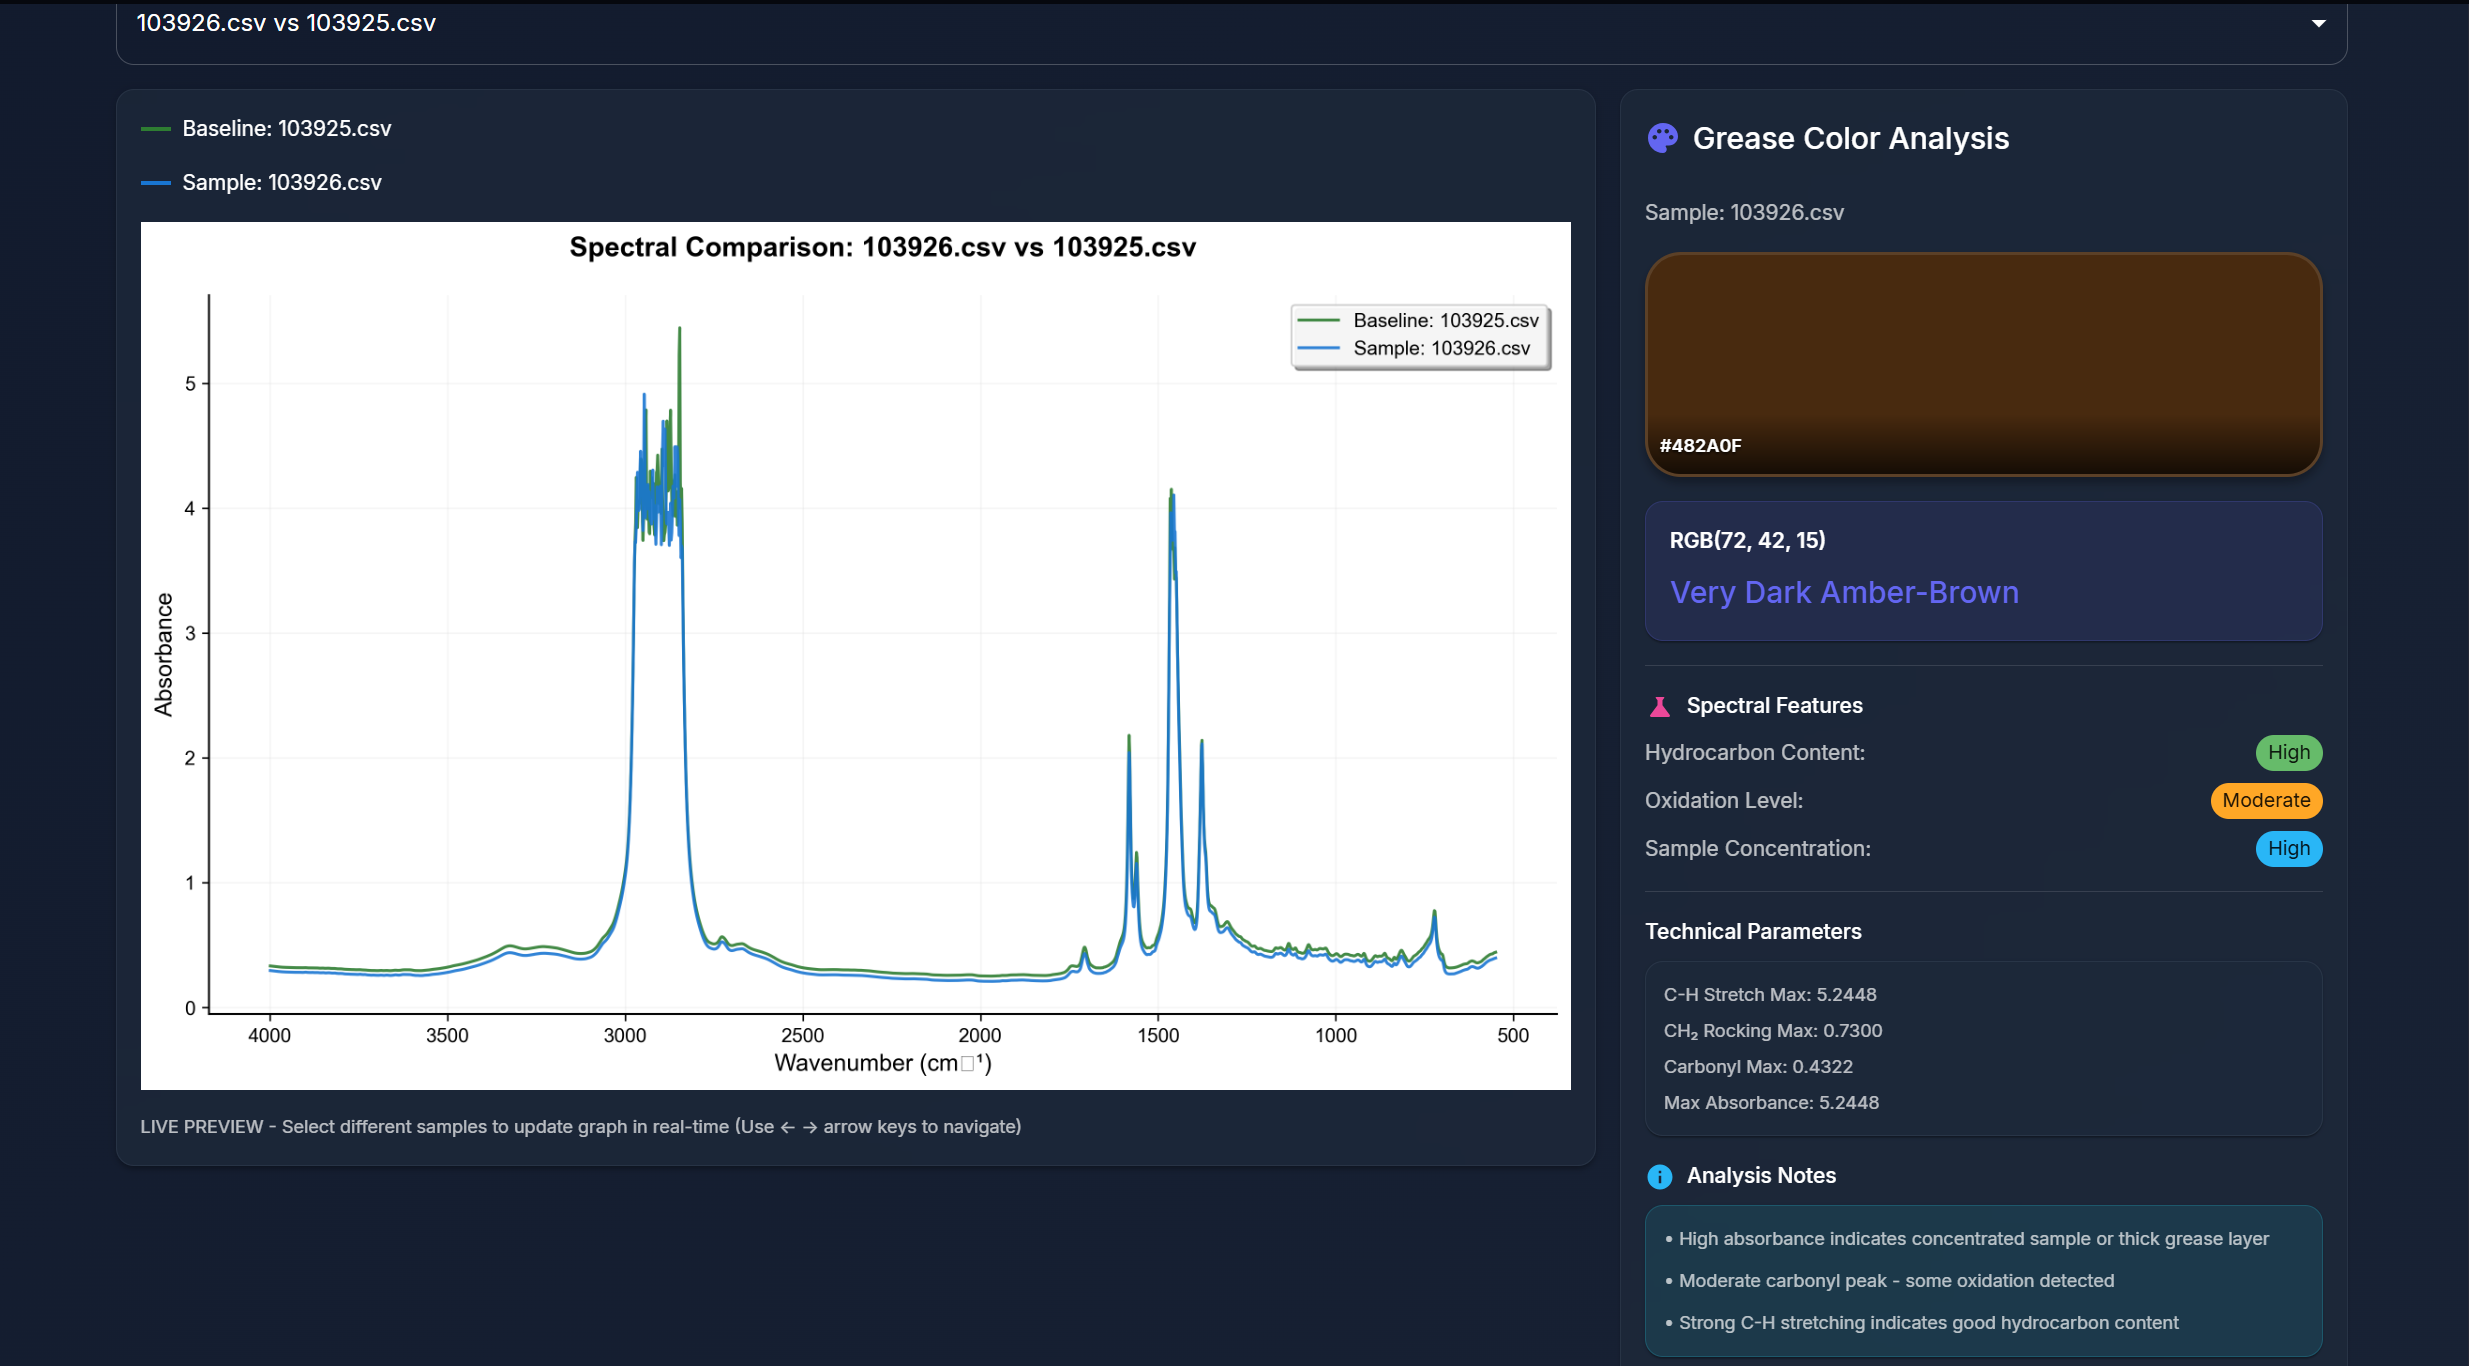
Graph With Color Data
-
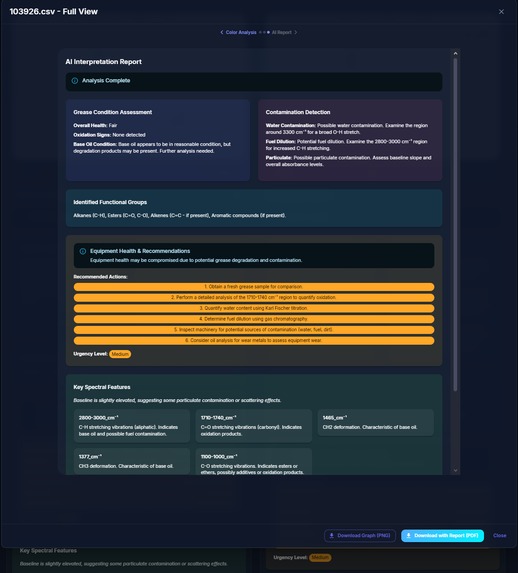
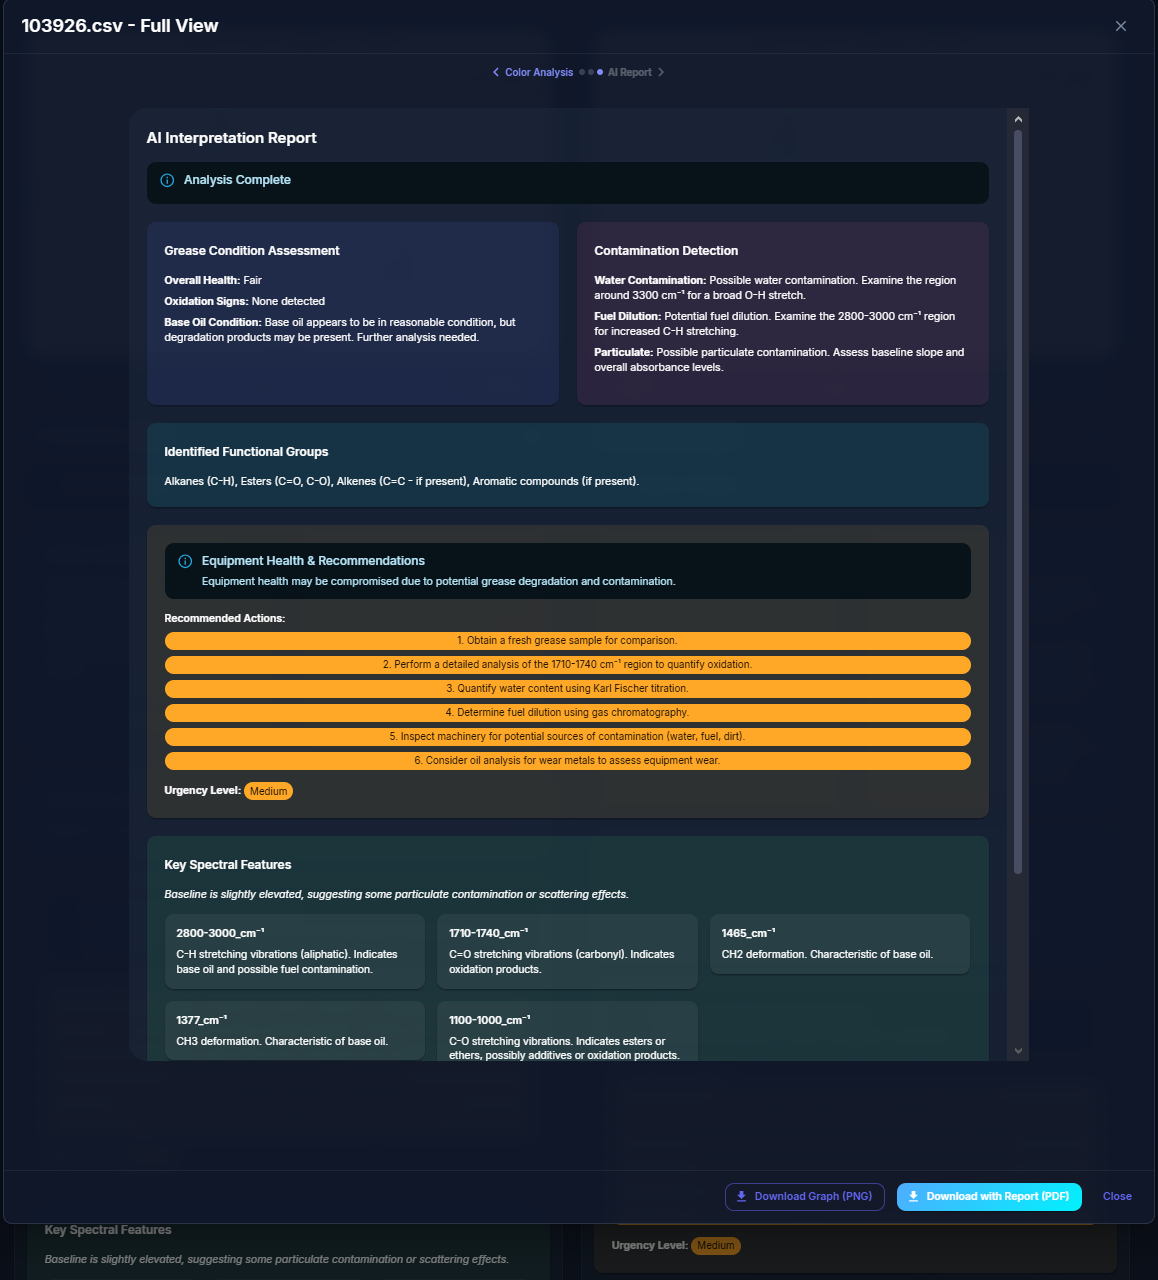
AI Analysis Report
-
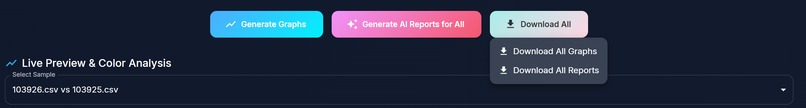
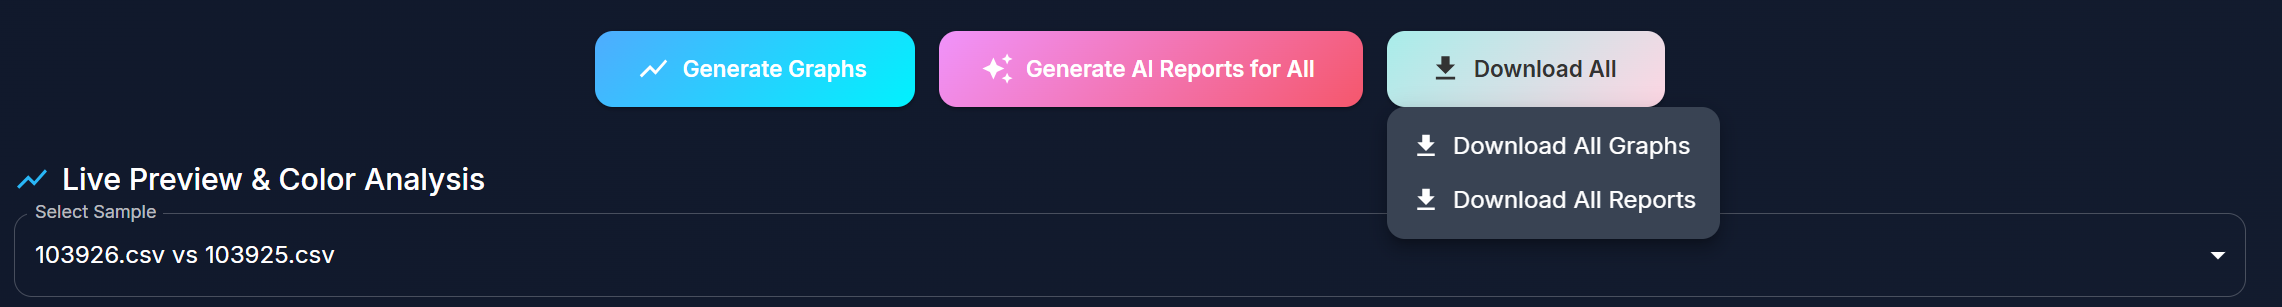
Download All Buttons (Graphs & Reports)
-

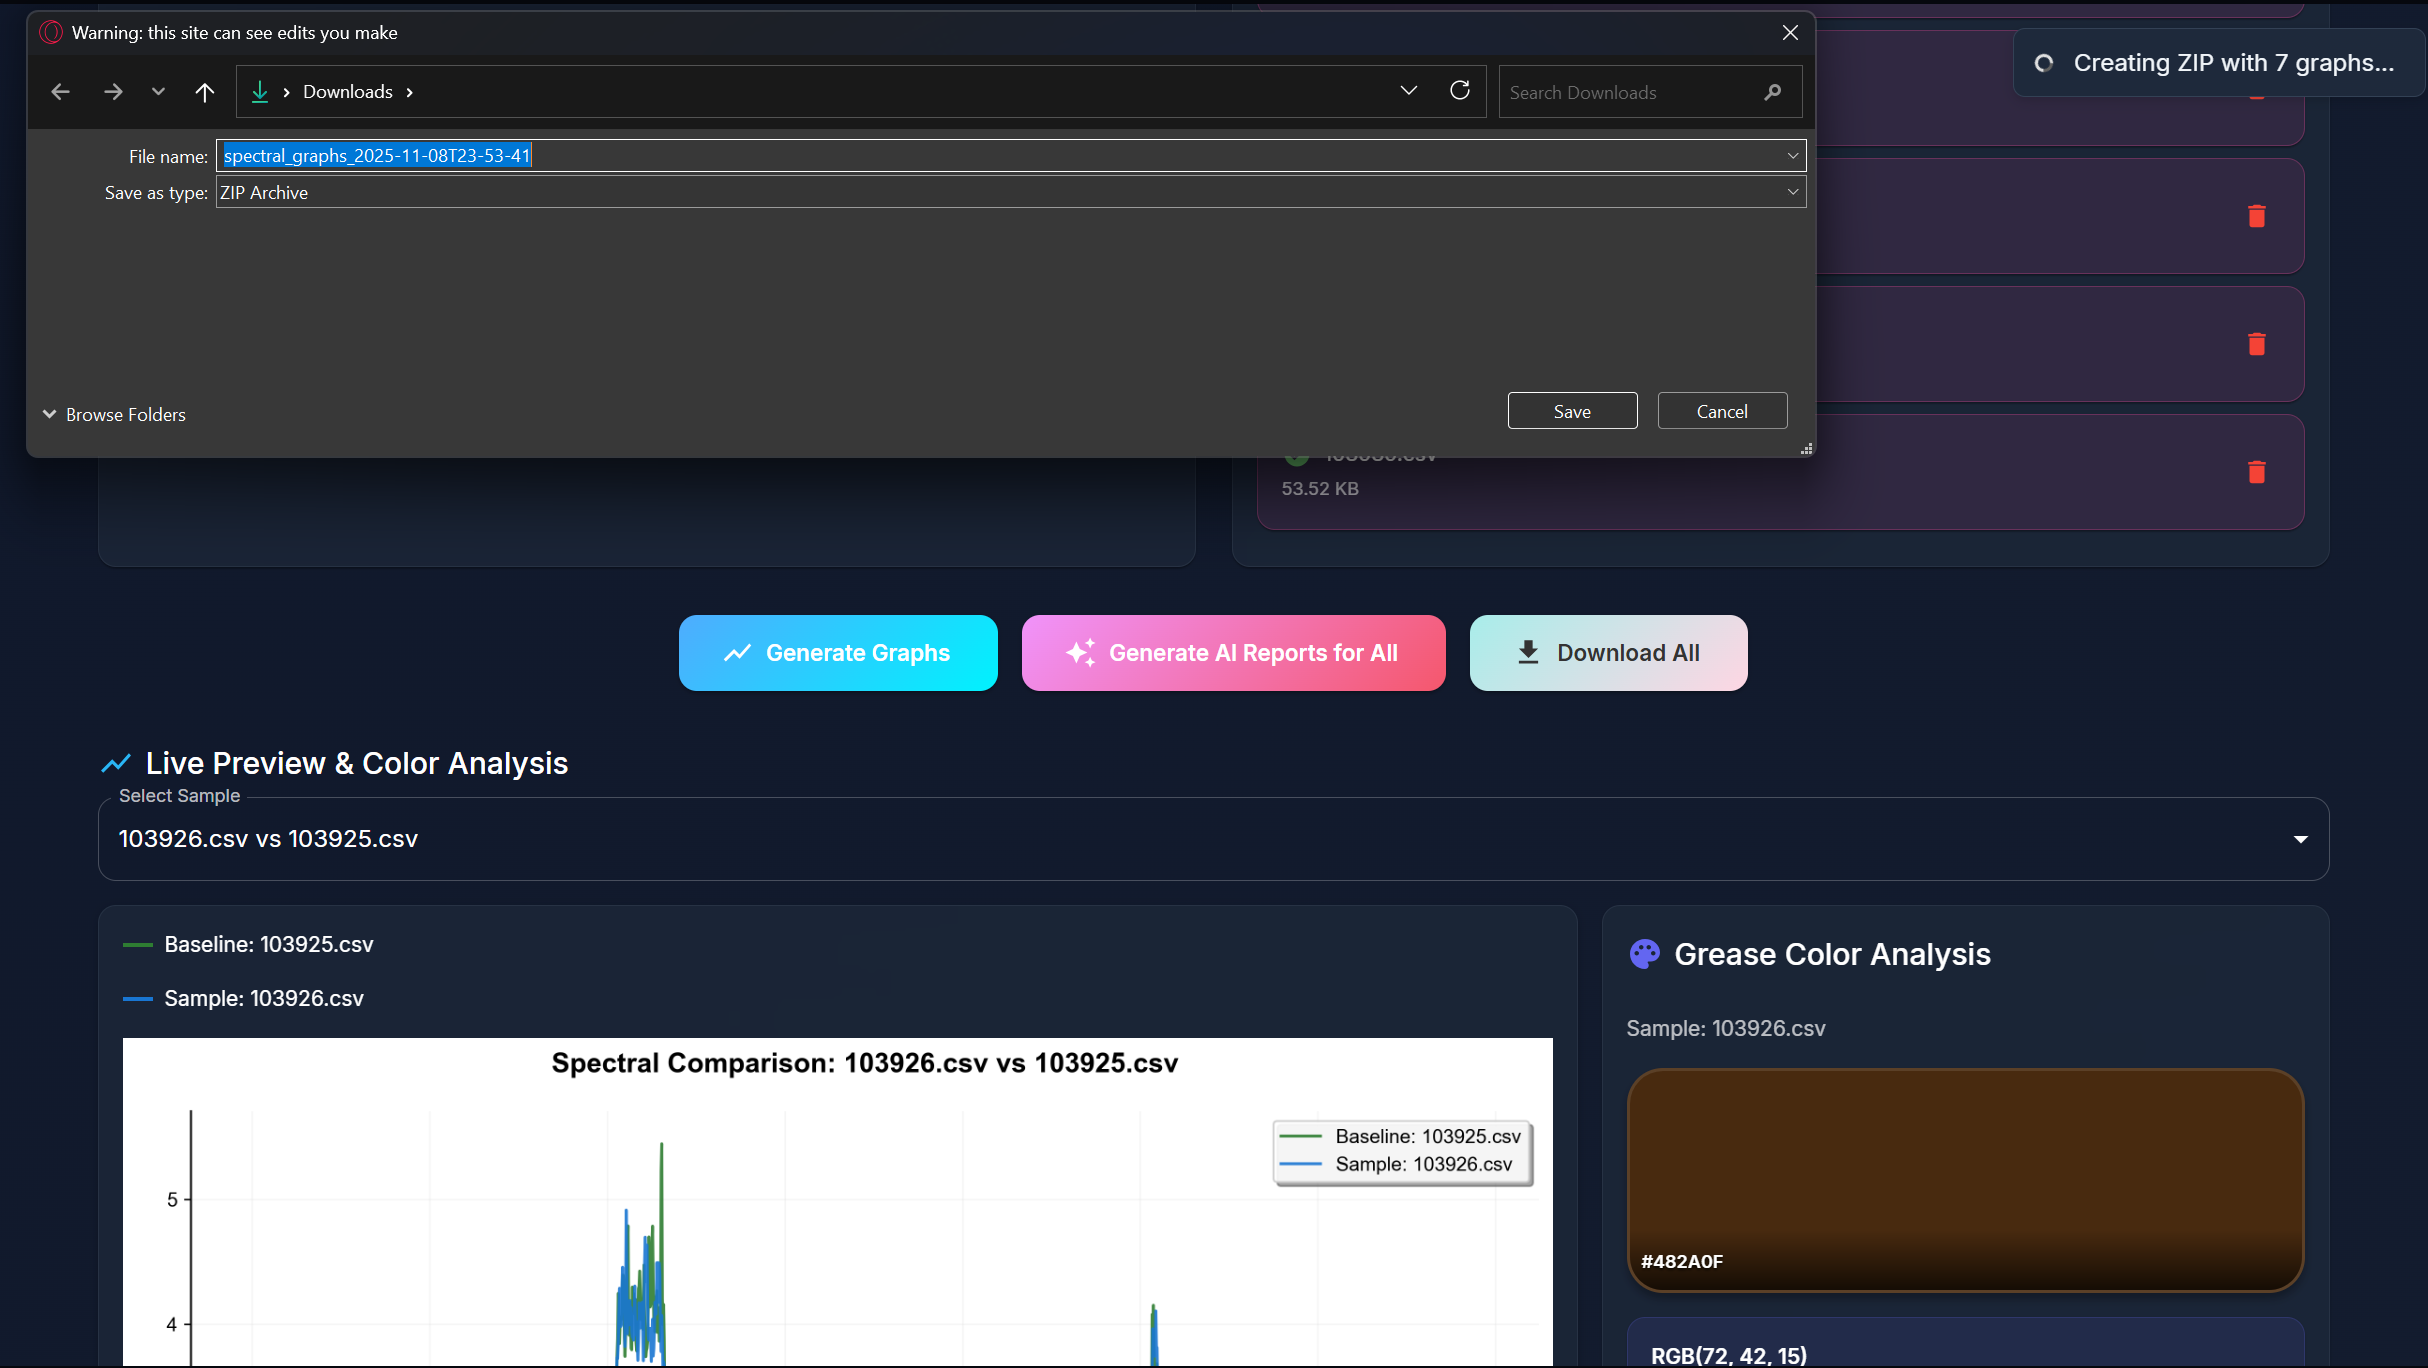
Specify File Path
-

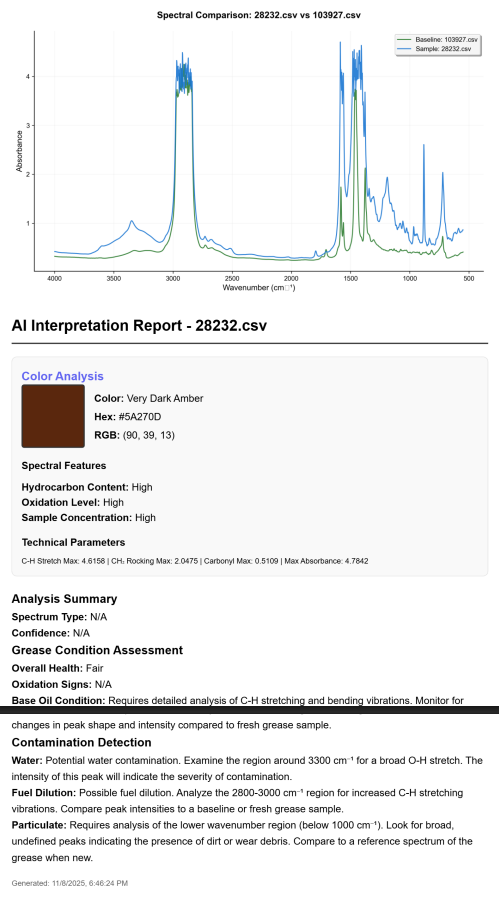
PDF Report
-
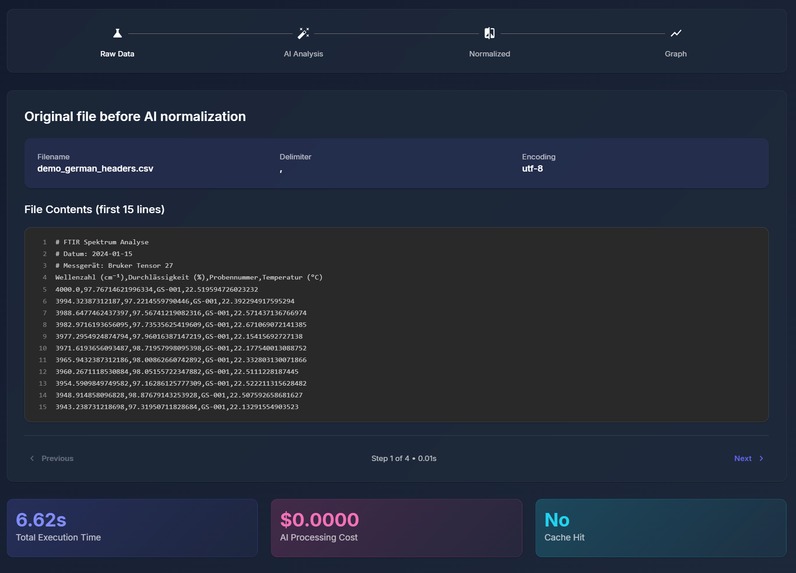
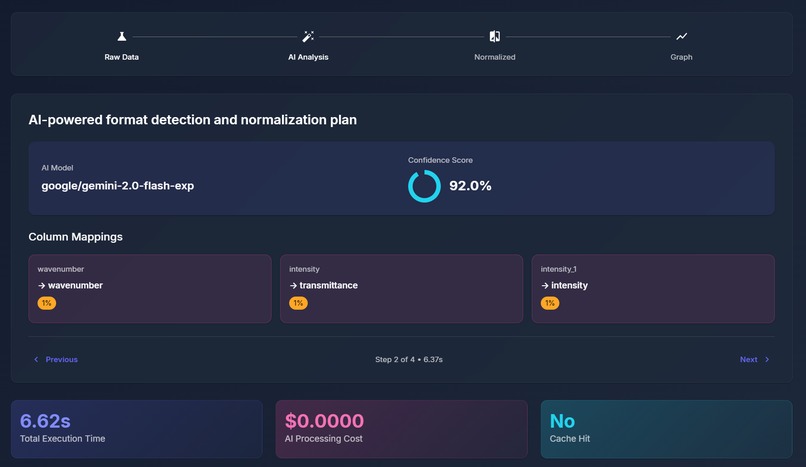
AI Normalization Demo (Page 1)
-
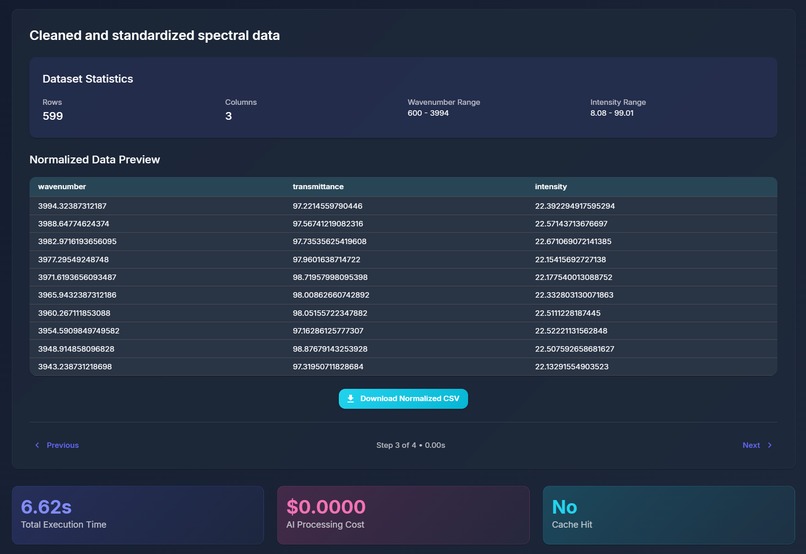
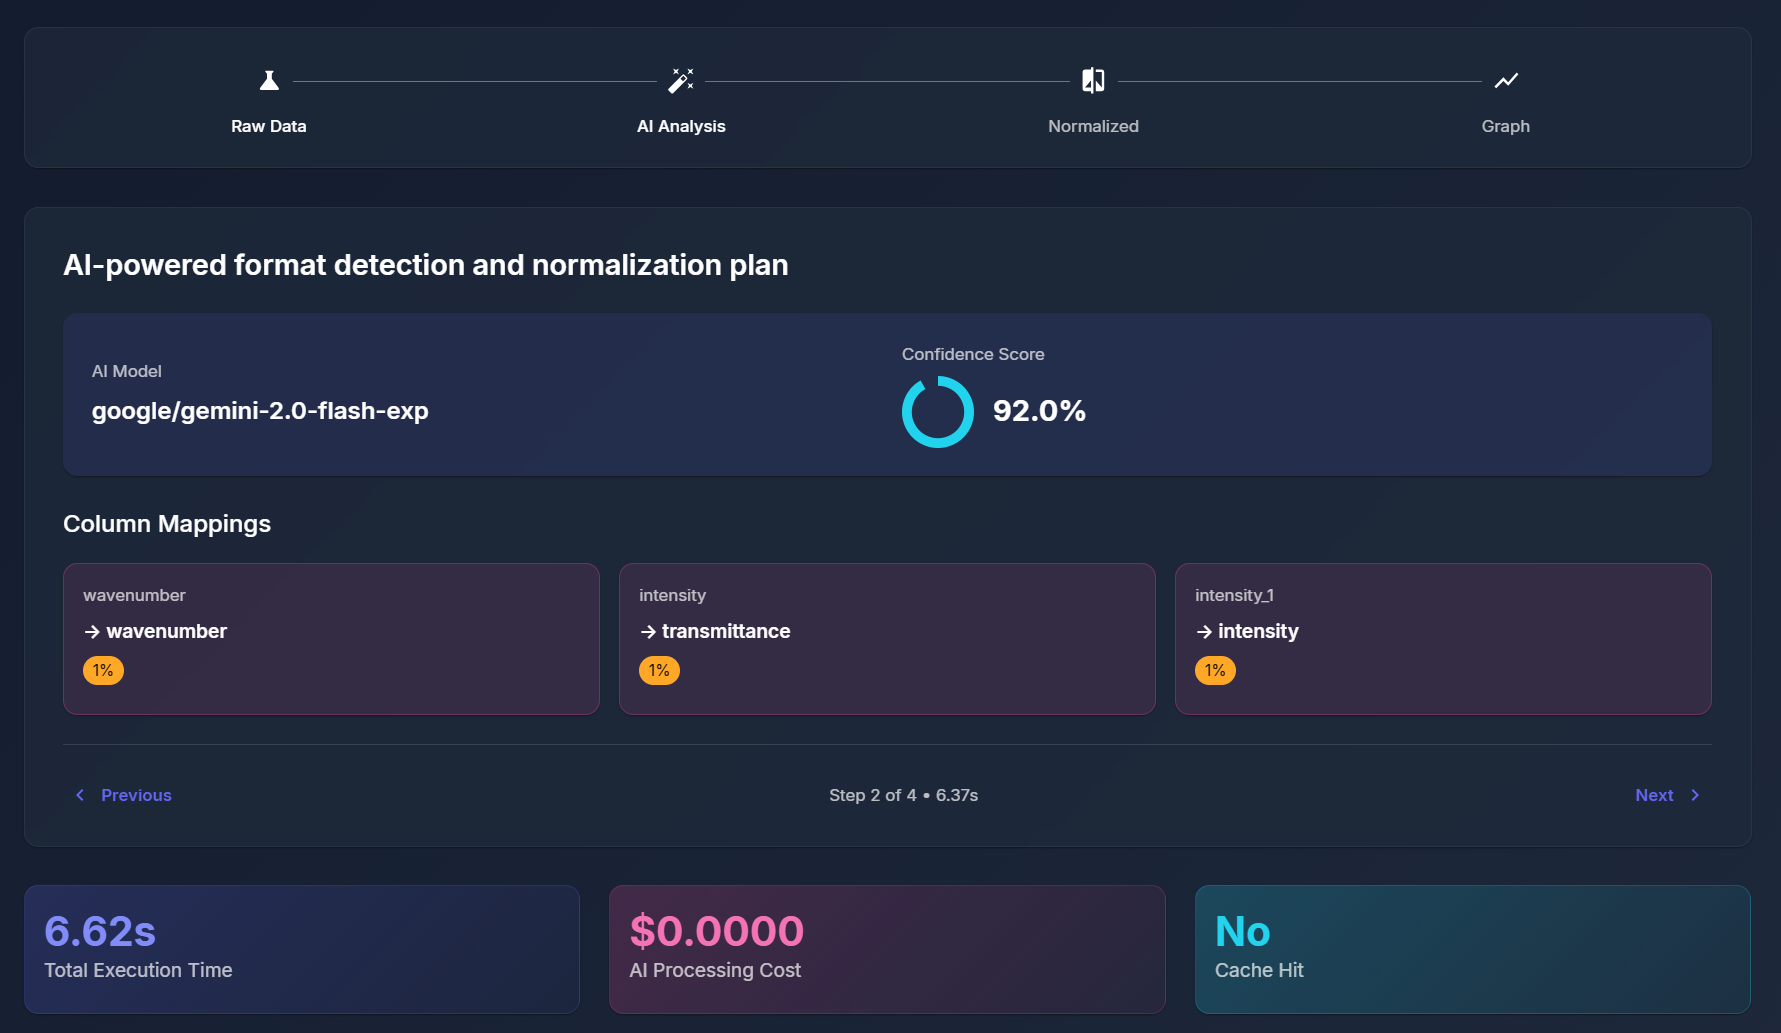
AI Normalization Demo (Page 2)
-
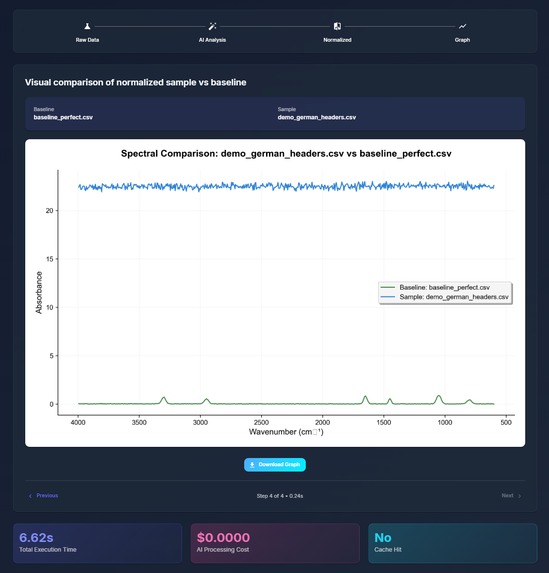
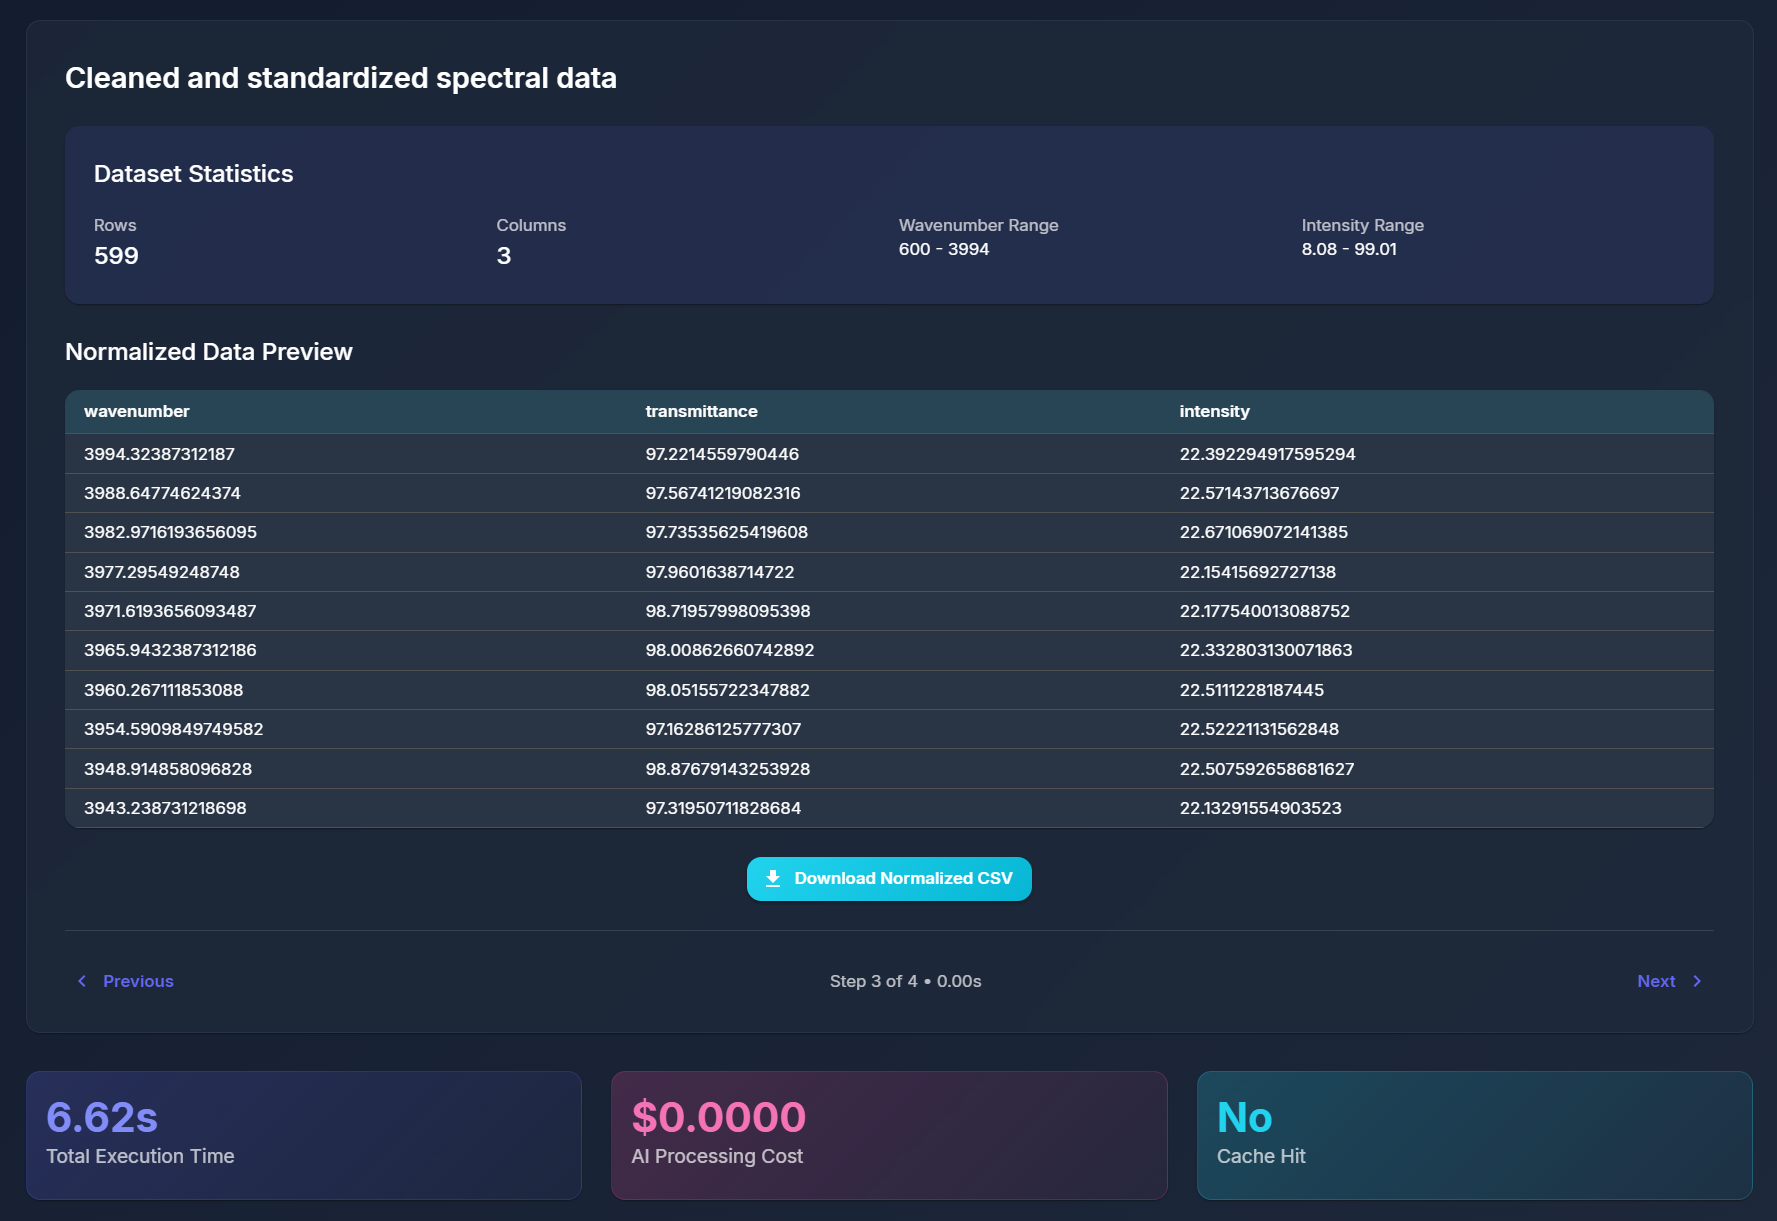
AI Normalization Demo (Page 3)
-
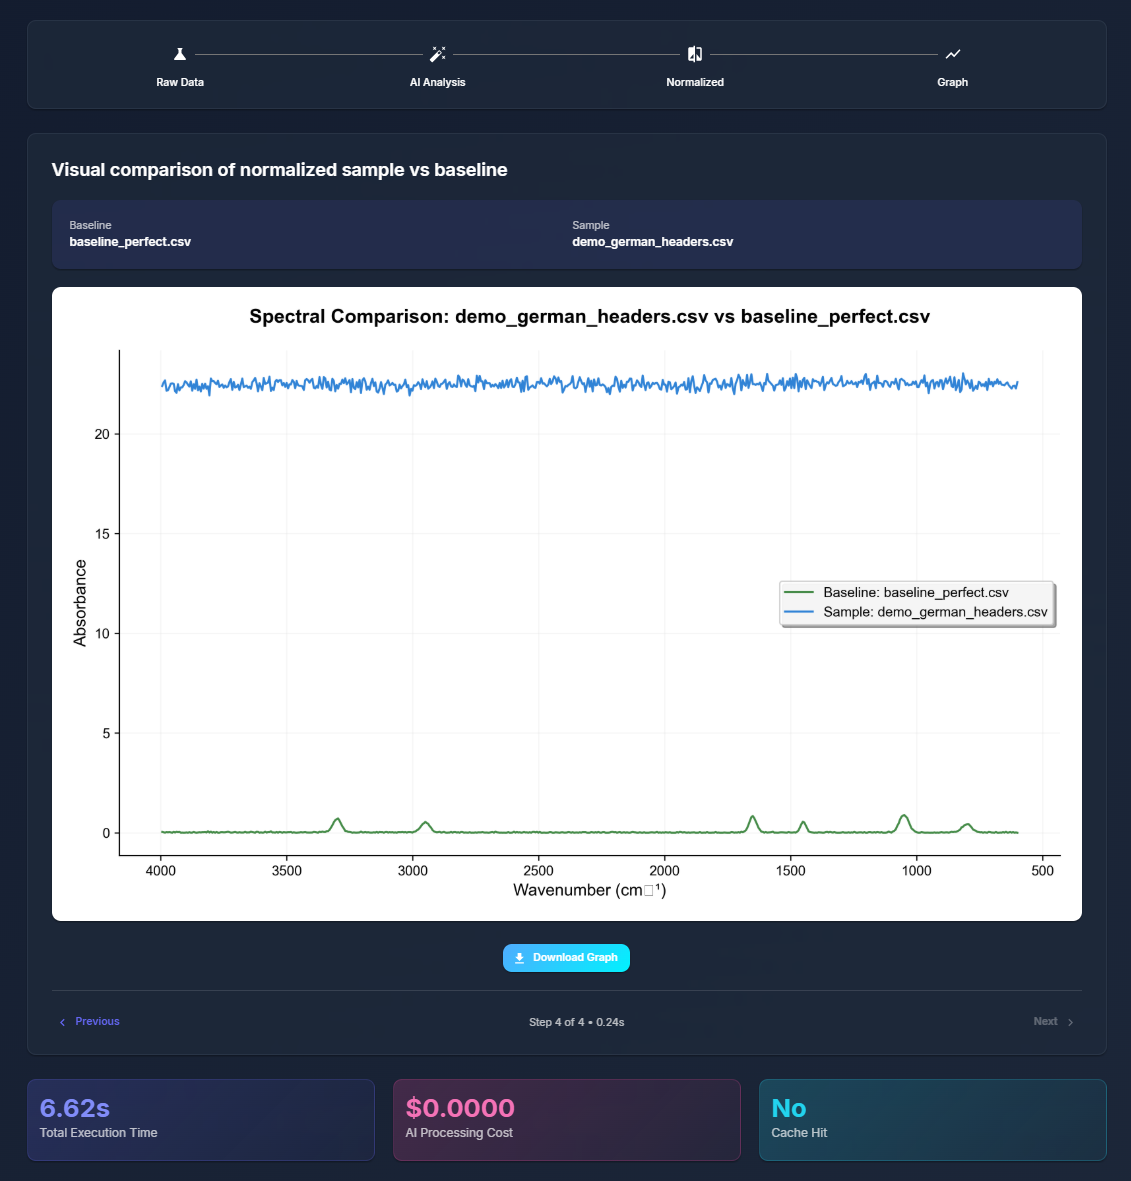
AI Normalization Demo (Page 4)
-
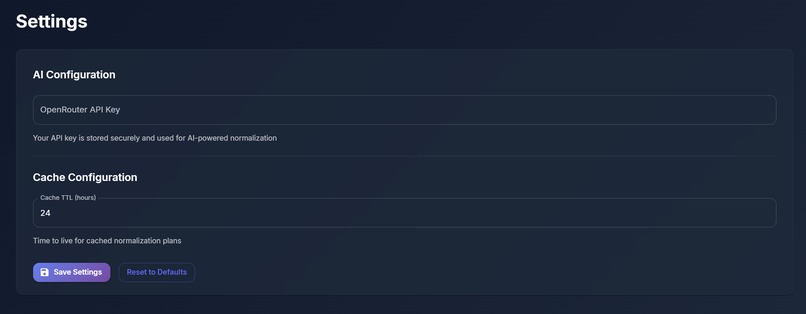
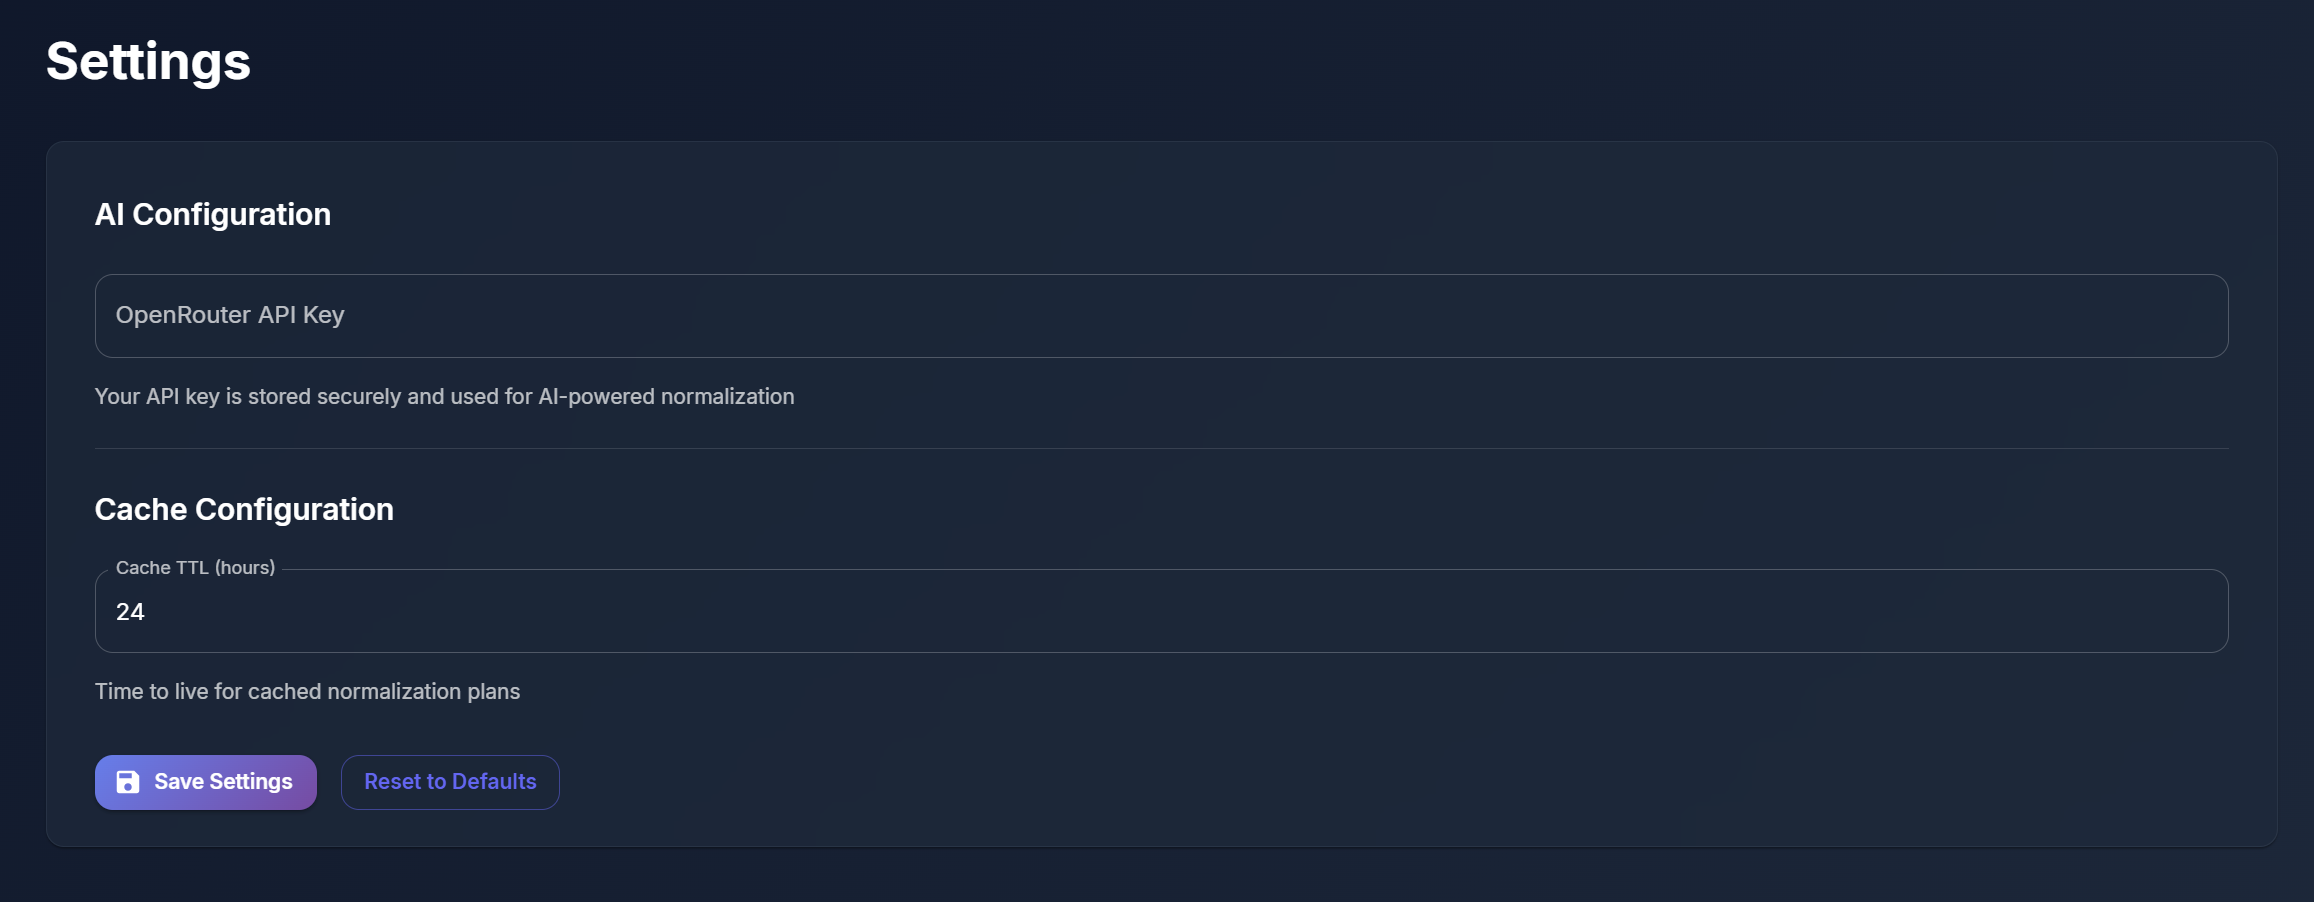
Settings

Inspiration
Our group, consisting of Omar Elfernani and myself, Arvin Chen, both came from previous lab experience. Whether it’s Omar’s part in the JHU Kiemen Lab, focusing on data manipulation, or my part in the Spangler Lab, where I used spectrometry daily, we have experienced the challenges of data analysis firsthand. Dealing with inconsistent CSV formats, manually fixing data headers, and the tedious process of graph generation were all slowly wasting time that could be spent productively elsewhere. We saw the opportunity to tackle this issue through the Grease Lab hackathon event. We were inspired to create a software that not only made researching more efficient, but also provide meaningful impact to those who rely on grease.
What it does
SpectroView takes a baseline CSV and graphs it upon an absorbance wavelength graph to be compared to another sample CSV data file. The program can take an unlimited amount of sample files and normalizes any unfamiliar headers using AI. Beyond the graphs, users can then also generate an AI-powered interpretation of the graph data that specifies a RGB code for the grease, and expands on the spectral features responsible for the identity of the grease.
How we built it
We built SpectroView with a multi-layered architecture designed for both performance and usability. The backend uses FastAPI with Python for CSV parsing, data validation, and AI-powered normalization through OpenRouter's API (Claude and GPT-4). For visualization, we integrated matplotlib to generate publication-quality spectral graphs with proper IR spectroscopy conventions.
Challenges we ran into
Our largest challenge was managing the inconsistent CSV formatting. It wasn’t a requirement from the hacking prompt, but it was a very likely predicament to come across. So we built a custom parser with automatic format detection to address those issues. Early on, we also ran into memory issues during batch graph generation, which we resolved by properly closing matplotlib figures between iterations.
Accomplishments that we're proud of
We're proud of building a tool that solves a real problem we've personally experienced in a laboratory setting.
The AI-powered normalization successfully handles messy, real-world data with confidence scoring, saving researchers hours of manual data cleaning.
Our multi-tier caching system achieves high hit rates (70%+ on typical workflows), drastically reducing API costs while maintaining sub-second response times.
The dual interface approach (desktop + web) means researchers can use SpectroView whether they're at a lab computer or reviewing data remotely.
What we learned
The hackathon taught us the value in building AI systems beyond just calling for APIs. We implemented retry logic, exponential backoff, cost tracking, and intelligent fallbacks while gaining hands-on experience with asynchronous Python, FastAPI background tasks, WebSockets, and parallel processing.
What's next for SpectroView
We wish to expand the possibilities for the program. Currently, we can use the graphs and analysis to determine the quality of a grease to its ideal baseline. One possible development is the ability to identify the source of grease degradation. We planned to do so through a contamination ratio that accounts for the metallic breakdown of the bearing that vessels the grease itself. Identifying whether the grease or the environment is failing could aid in the precision of advice that can be given to customers.
Built With
- anthropicclaude
- fastapi
- figurecanvasqtagg
- javascript
- material-ui
- matplotlib
- openaigpt-4
- openrouterapi
- panda
- pyqt6
- python
- react18
- sql
- typescript
- vite


Log in or sign up for Devpost to join the conversation.