-
-
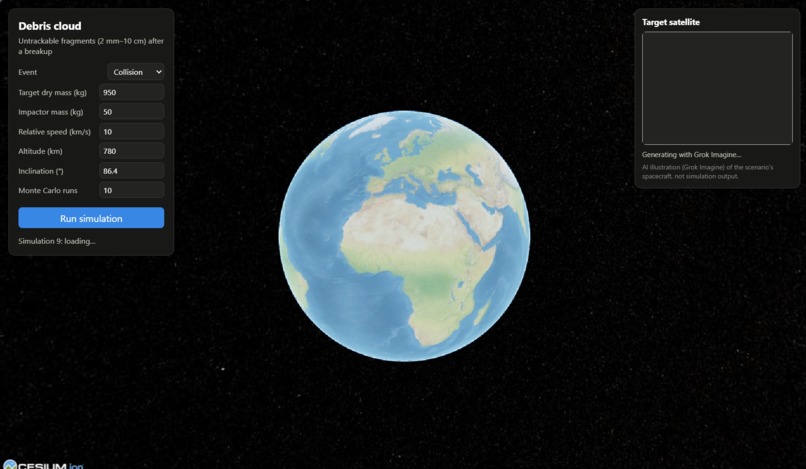
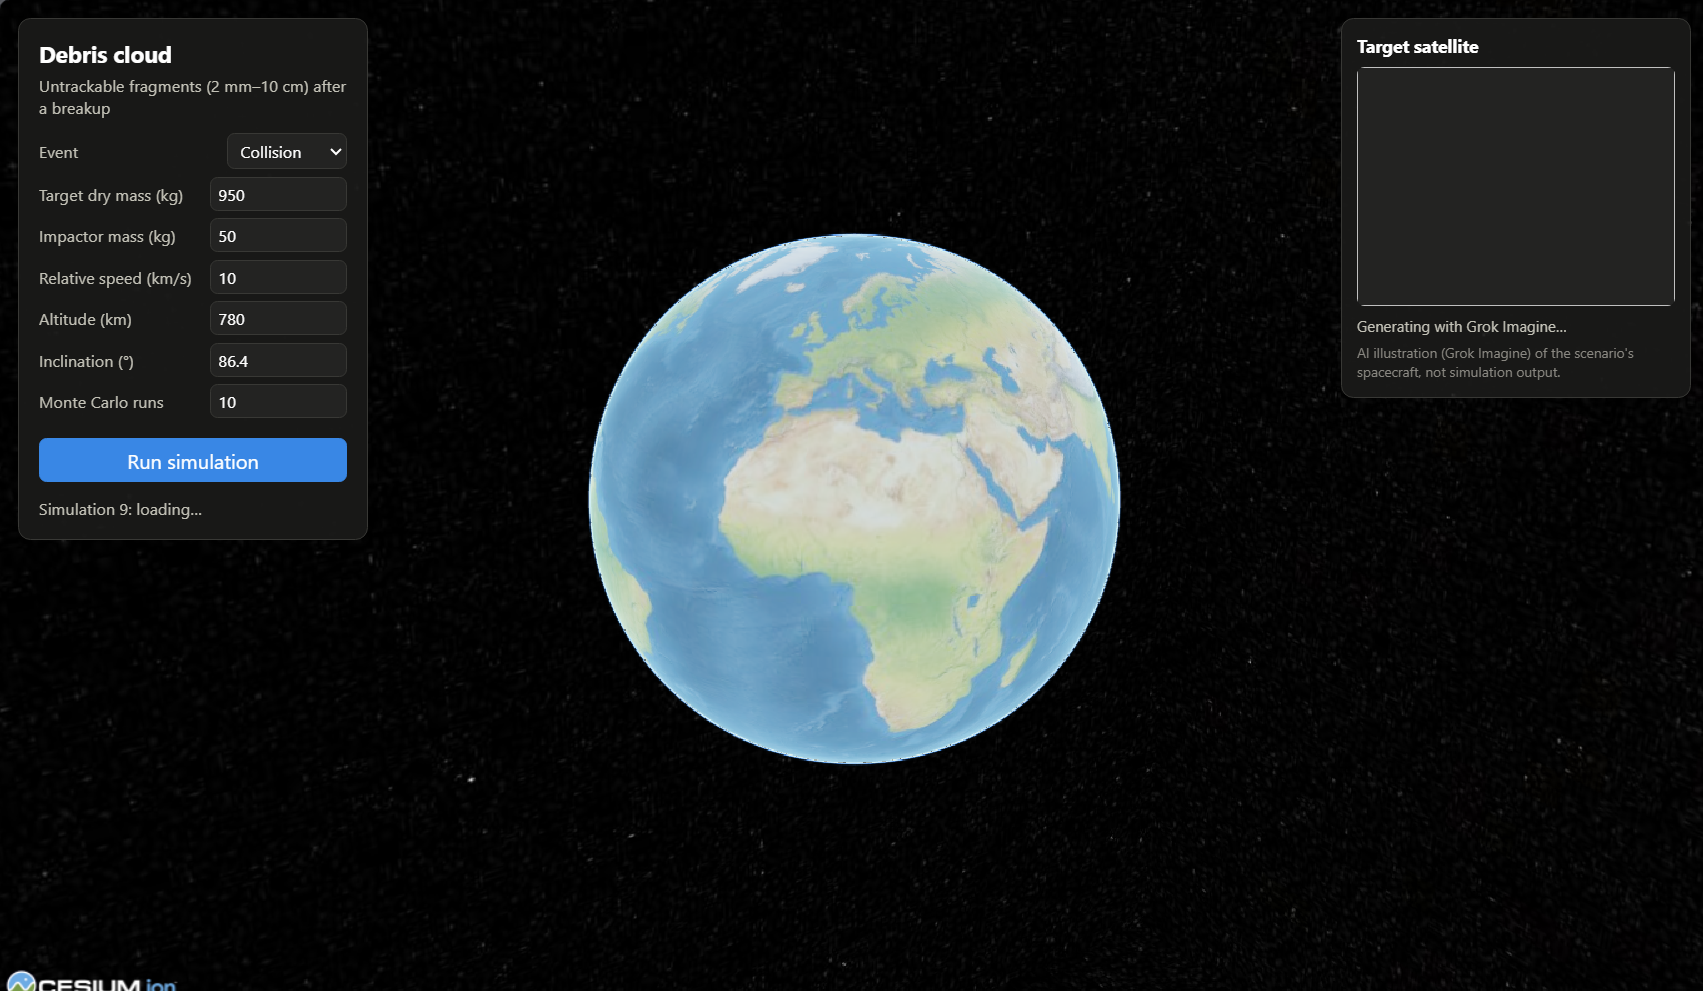
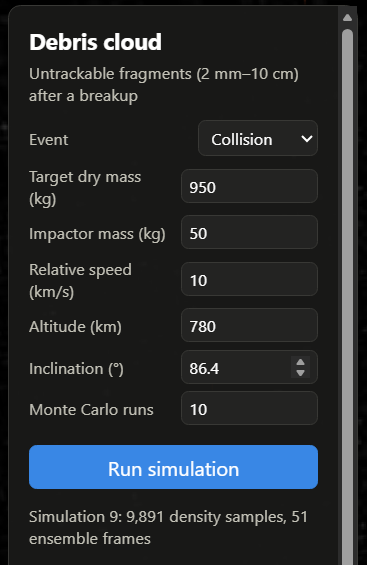
Main demo showing what can be created using our API. The left panel can set parameters for the satelite and create/control the simulation
-
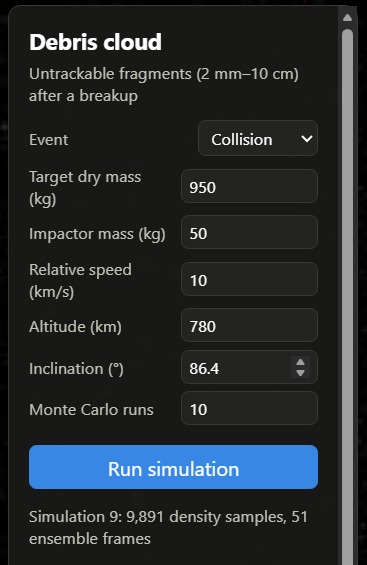
Simulation Parameters. Controls the simulated satellites attributes and how the fragments will act after collision/explosion.
-
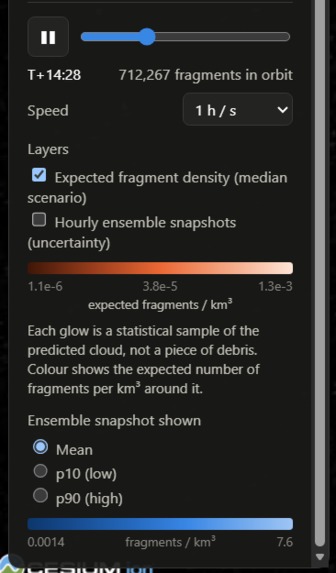
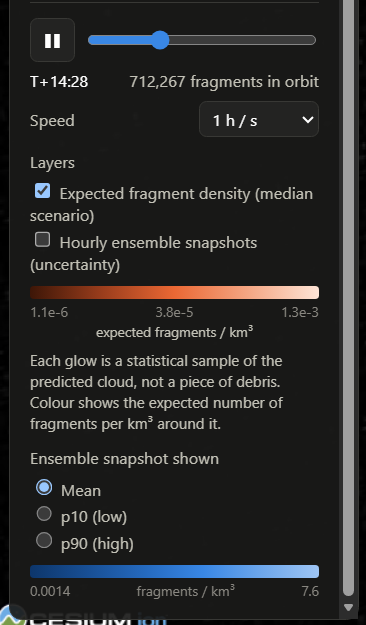
Simulation Control. Show density distribution, show percentile averages, and control simulation speed.
-
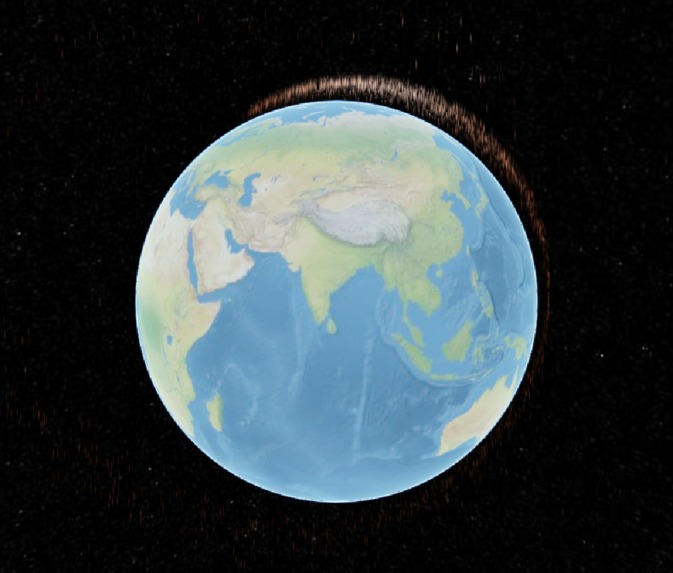
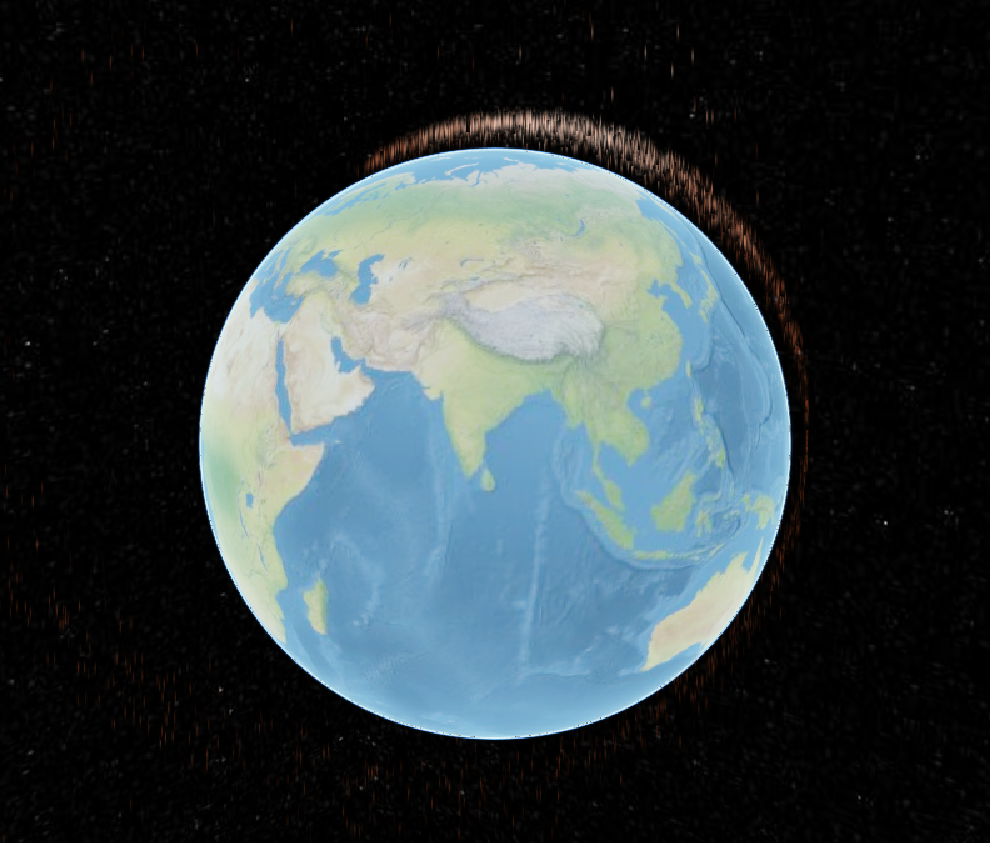
Fragment density distribution. Each points hue represents its expected fragments per kilometers cubed
-
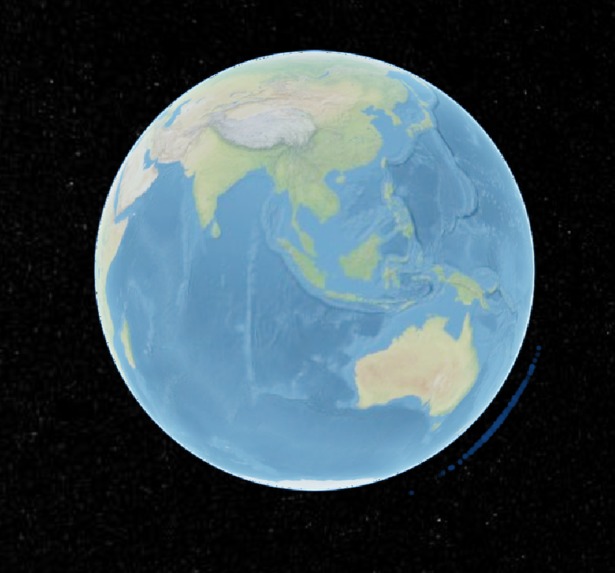
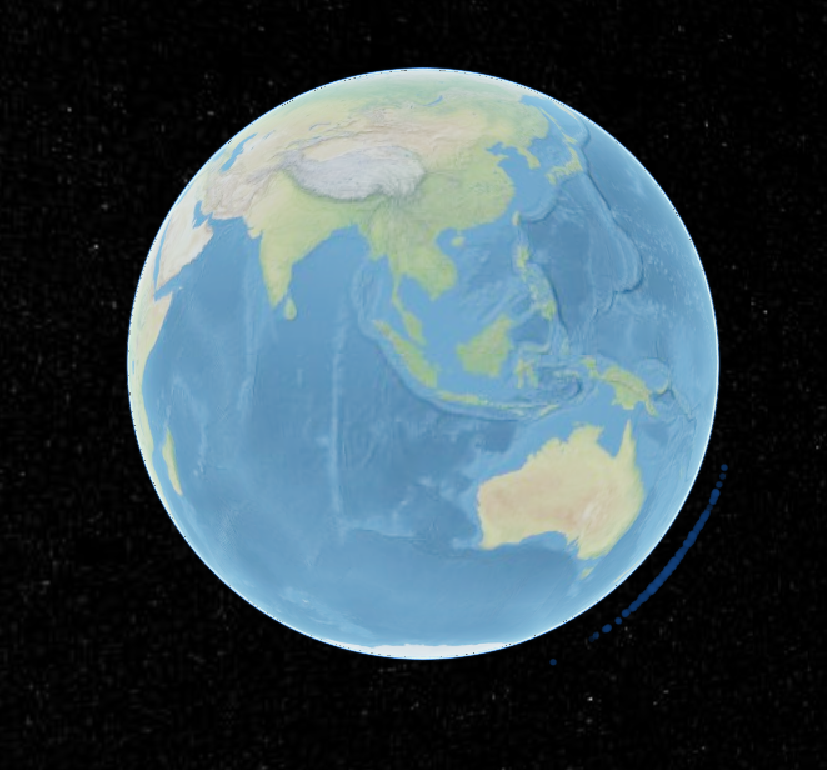
Hourly snapshots from 10 runs: each dot is a 20 km cube, brighter = denser debris. Toggle mean, p10 or p90 to see the uncertainty.
-
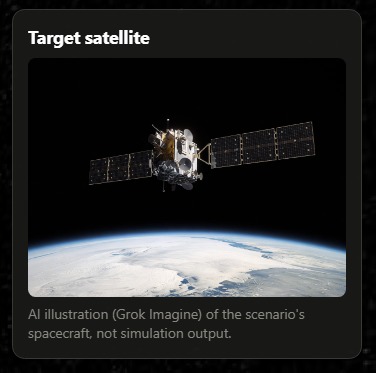
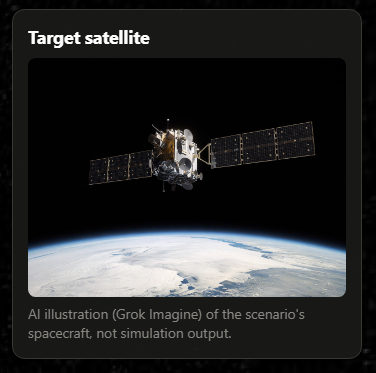
Image generated by Grok Imagine. Custom generated at simulation time based on satellite parameters.
-
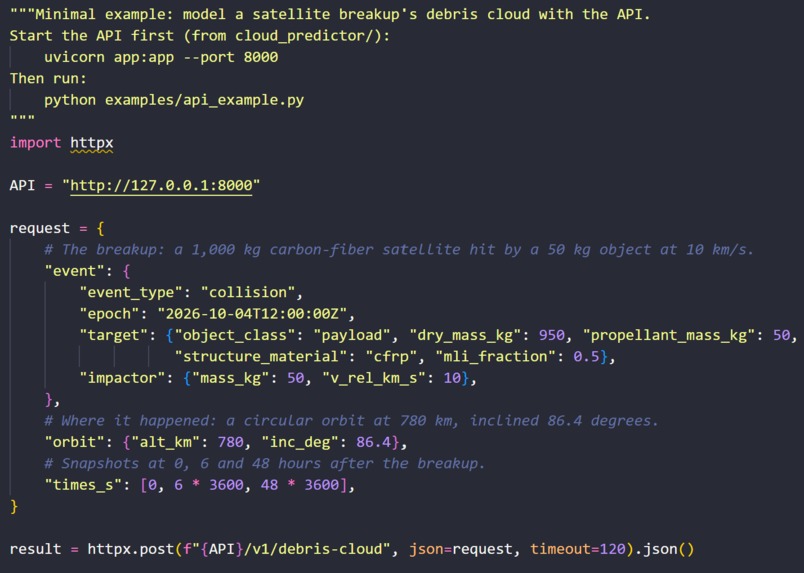
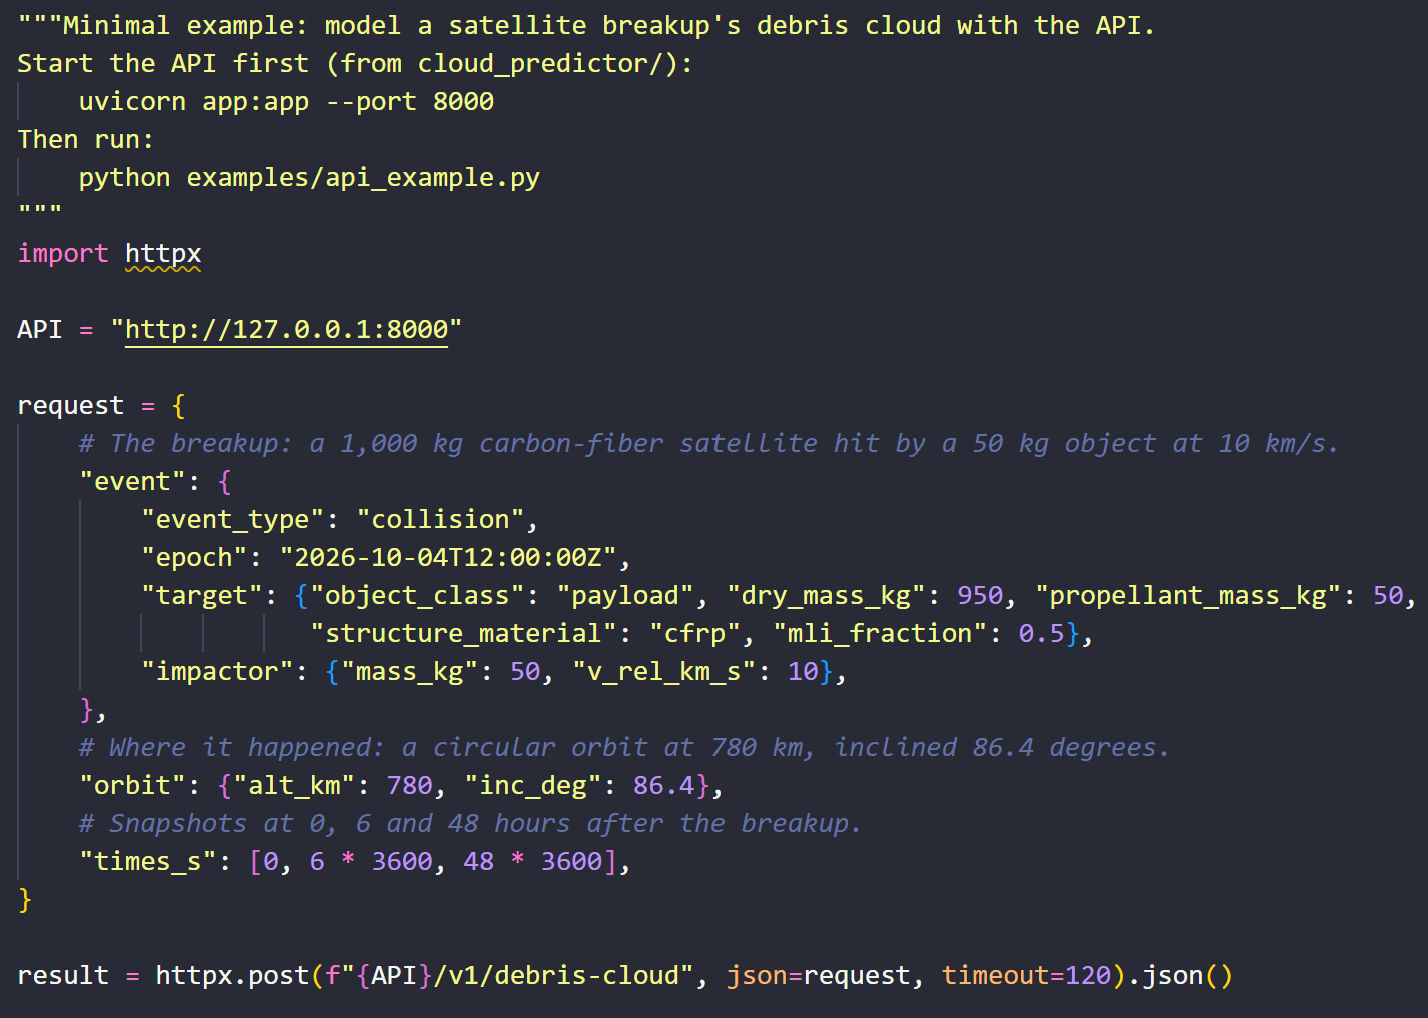
Example API Usage
Inspiration
Every satellite breakup leaves a cloud of debris, and most of it is too small to track. Anything under about 10 cm is invisible to ground radar but still hits at around 10 km/s, which is enough to disable a working satellite. Space agencies estimate this debris with the NASA Standard Breakup Model, which was built from tests on 1960s-era, mostly aluminium spacecraft. Modern satellites break up differently. When NASA and the DoD smashed a modern test satellite (DebriSat), the NASA model predicted 85,000 fragments of 2 mm or more, and over 295,000 have been collected so far. On real breakups, the model with its default scaling factor predicts the same 239 large fragments for every explosion, whatever exploded.
We wanted anyone building space-safety tools to be able to ask "where does the untrackable debris go after this breakup, and how sure are we?" and get the answer back as data.
What it does
SPECTRE is an API. You send it the parameters of a satellite breakup, and it sends back data about the fragments: how many there are, how big they are, where they go over the next 48 hours, and how sure it is about the debris density and the fragment count. It covers the untrackable range, 2 mm to 10 cm.
You send:
- Breakup type: explosion or collision
- Satellite mass
- Impactor mass and speed (for collisions)
- Orbit altitude and inclination
- Optional construction details (bus family, bus volume, solar array area, insulation or material), which switch on the learned correction; without them SPECTRE uses the plain NASA count with a wide uncertainty range
You get back:
- The total fragment count, plus the model's correction to it with uncertainty ranges (10th, 50th and 90th percentiles), learned from real breakups for that specific spacecraft when you send its construction details
- 10,000 weighted sample fragments (for stored simulations), each with a size, its orbit (including drag decay) and its re-entry time, so you can work out where any of them is at any time
- A debris density field (expected fragments per km³ in 20 km cells) over the next 48 hours, with a low and high estimate for each of the densest 1,000 cells per snapshot
Under the hood, each stored simulation runs:
- A machine-learning correction to the NASA model for the spacecraft you described, with uncertainty ranges.
- A physics engine that breaks the satellite into 10,000 weighted sample fragments and follows each along its orbit, including Earth's flattening and atmospheric drag. Over time the cloud stretches from a point into a ring around Earth.
- 10 runs (by default) of that engine with different settings drawn from the uncertainty ranges, which is where the low, expected and high estimates come from.
The demo is just one example client. To show what you can build on the API, we made a 3D globe that calls it and plays back the result: the cloud moves smoothly around Earth, coloured by expected fragments per km³, with an optional uncertainty overlay. The demo also uses Grok Imagine to generate a picture of the target satellite from the scenario parameters, so you can see what is breaking apart. It is clearly labelled as an illustration, not model output.
The same API could just as easily feed a collision-screening tool, a mission-planning dashboard or a research notebook.
How we built it
- Development: we wrote almost all of our code using Cursor.
- Data: we built our own dataset from several space datasets:
- ESA DISCOS: breakup events and how many fragments were eventually catalogued.
- Space-Track SATCAT: the public satellite catalogue.
- Gunter's Space Page: spacecraft mass and bus type.
- DebriSat: published lab results on how modern composite spacecraft break apart, applied when the caller says the spacecraft is carbon-fibre or mixed construction.
- Hand-checked, cited data for known collisions.
- Machine learning: a small PyTorch neural network predicts a correction to the NASA model's fragment count for each spacecraft, with uncertainty ranges. We tested it with cross-validation grouped by spacecraft family, so the model never trains on a "sister" of the satellite it is predicting. A correction only ships if it beats the plain NASA model on that test; so far only the fragment-count correction does, so area-to-mass and speed stay at the NASA model's values.
- Physics engine: NumPy code that splits the satellite into fragments using the NASA model with our corrections. It gives each fragment a size, area-to-mass ratio and speed, then moves all fragments through orbit drift and drag. Fragments are counted into 20 km cubes of space, and the counts are smoothed to remove random noise.
- The API: a FastAPI service takes the scenario and returns the results. SpacetimeDB (a Rust module) queues simulation requests and stores the results. A Python worker picks up requests, runs the simulation (10 runs by default) and saves the output. SpacetimeDB is our system's backbone: every simulation is queued, tracked live and stored in it, including every density voxel with its uncertainty range and thousands of fragment orbits. A custom Rust module runs inside the database, with reducers that validate and store each result and a built-in 10 Hz clock that can drive a shared, time-compressed 48-hour playback for multiple viewers (our single-user demo plays back in the browser). Every stored simulation the API returns, and everything the 3D viewer draws apart from the Grok illustration, comes out of SpacetimeDB.
- Demo client: TypeScript, Vite and CesiumJS. Instead of jumping between saved snapshots, the browser takes the fragment orbits from the API and recomputes every fragment's position each frame, using a JavaScript copy of our Python orbit code that agrees with it to within about 1e-10 km. It also computes density live for 10,000 samples in under 5 ms.
- Grok AI (in the demo): xAI's Grok Imagine API turns each scenario's parameters into a picture of the satellite.
- Grok Bot: for streamlined project planning, task alignment, and team collaboration
Challenges we ran into
- Little ground truth: nobody can count fragments under 10 cm, so we trained on the one thing that is recorded: fragments of 10 cm and up that were eventually catalogued. We carry that learned correction down to smaller sizes through the physics model.
- Few collisions: explosions make up almost all recorded breakups, with only a handful of collisions. We added a safeguard: collisions use the plain NASA model until there are at least 30 labelled examples, rather than a correction trained on just a few.
- Missing data: the public catalogue's radar-size field is all zeros, and none of our 456 spacecraft records says what the satellite is made of. So we had to be careful about what the model can honestly learn.
- Finding a fair comparison: no newer breakup model we found publishes accuracy on real events, and beating the NASA model alone turned out to be too easy a bar (see below).
- SpacetimeDB can't run Python: our physics is in Python, so we used the database as a job queue and result store, with a Python worker talking to it over HTTP.
- Showing it honestly and smoothly (demo): our first version jumped between hourly snapshots, and the cloud moved about 212° around Earth between frames. We switched to recomputing orbits every frame, and we drew the samples as a density cloud rather than pretending they were real fragments.
- Our SSD disconnected mid-build and Windows warned about possible corruption. Luckily everything had just been committed.
Accomplishments that we're proud of
We tested the model behind the API on 381 real breakups, always predicting events the model had never seen (all with a known bus family). "Typical error" is how many times too high or too low a prediction usually is.
| Model | Typical error | Within 2× | Within 10× |
|---|---|---|---|
| NASA model (default scaling factor) | ×30 | 7% | 30% |
| Always predict the median | ×3.7 | 26% | 84% |
| Gradient boosting | ×3.6 | 29% | 78% |
| SPECTRE | ×3.5 | 32% | 81% |
- Most of the gap to the NASA model is calibration: it predicts 239 large fragments for every explosion, while the typical real count is about 8. So we also tested simple data-driven baselines: always predicting the median, per-cause medians, linear regression, and gradient boosting.
- SPECTRE beats all of them on typical error and share within 2×, and is closer to the real count than the best baseline on 212 of 381 events. Always predicting the median does slightly better on the share within 10× (84% vs 81%).
- Honest uncertainty: SPECTRE is the only one that gives a range, and the range holds up. The real count falls inside our 10th–90th percentile range 83% of the time, against an 80% target.
We're also proud of the complete pipeline, from raw space data to an API that turns a handful of satellite parameters into a full debris cloud, with a live 3D globe built on top to prove it works. And of keeping it honest: the demo never presents its statistical samples as real fragments, and the Grok picture is clearly labelled as an illustration.
What we learned
- Always test against simple baselines. Beating a 25-year-old model felt like a breakthrough until "always predict the median" got most of the way there. That pushed us to measure what our model really adds: a bit more accuracy, uncertainty ranges that hold up, and a full 3D debris cloud.
- Testing grouped by spacecraft family matters. Sister spacecraft are built alike, so letting one train the model while another tests it would overstate accuracy.
- Showing uncertainty is a design problem as much as a maths problem.
- How to combine a Python science stack with SpacetimeDB, CesiumJS, and generative AI like Grok in one product.
What's next for SPECTRE
- Collision risk: a new endpoint that turns debris density into a hit probability for active satellites crossing the cloud, with alerts.
- Per-fragment data: use Space-Track's historical orbit data to learn ejection speed per fragment, so those predictions are learned rather than assumed.
- More collision data and spacecraft materials, so the collision safeguard can be lifted and composite construction is modelled for real.
- Streaming and access control: push results to clients live over SpacetimeDB subscriptions, plus authentication and API keys.
- In the demo: Grok Imagine video of the moment of breakup, shown while the simulation runs.
Built With
- cesiumjs
- cursor
- debrisat
- esa-discos
- grokimagine
- gunter's-space-page
- numpy
- python
- pytorch
- satcat
- spacetimedb
- typescript
- vite
- xai


Log in or sign up for Devpost to join the conversation.