-
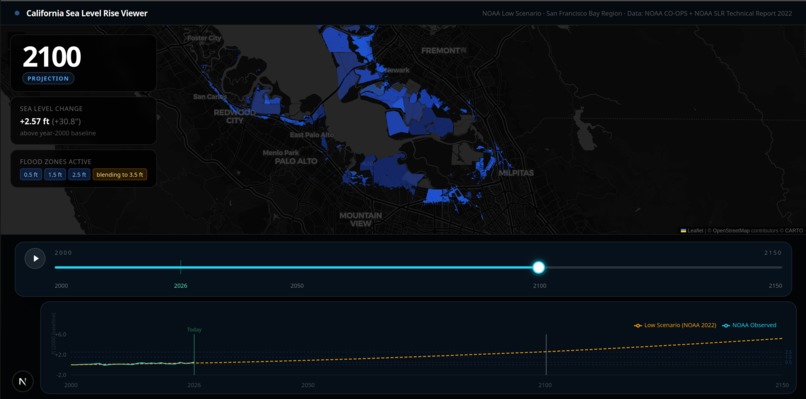
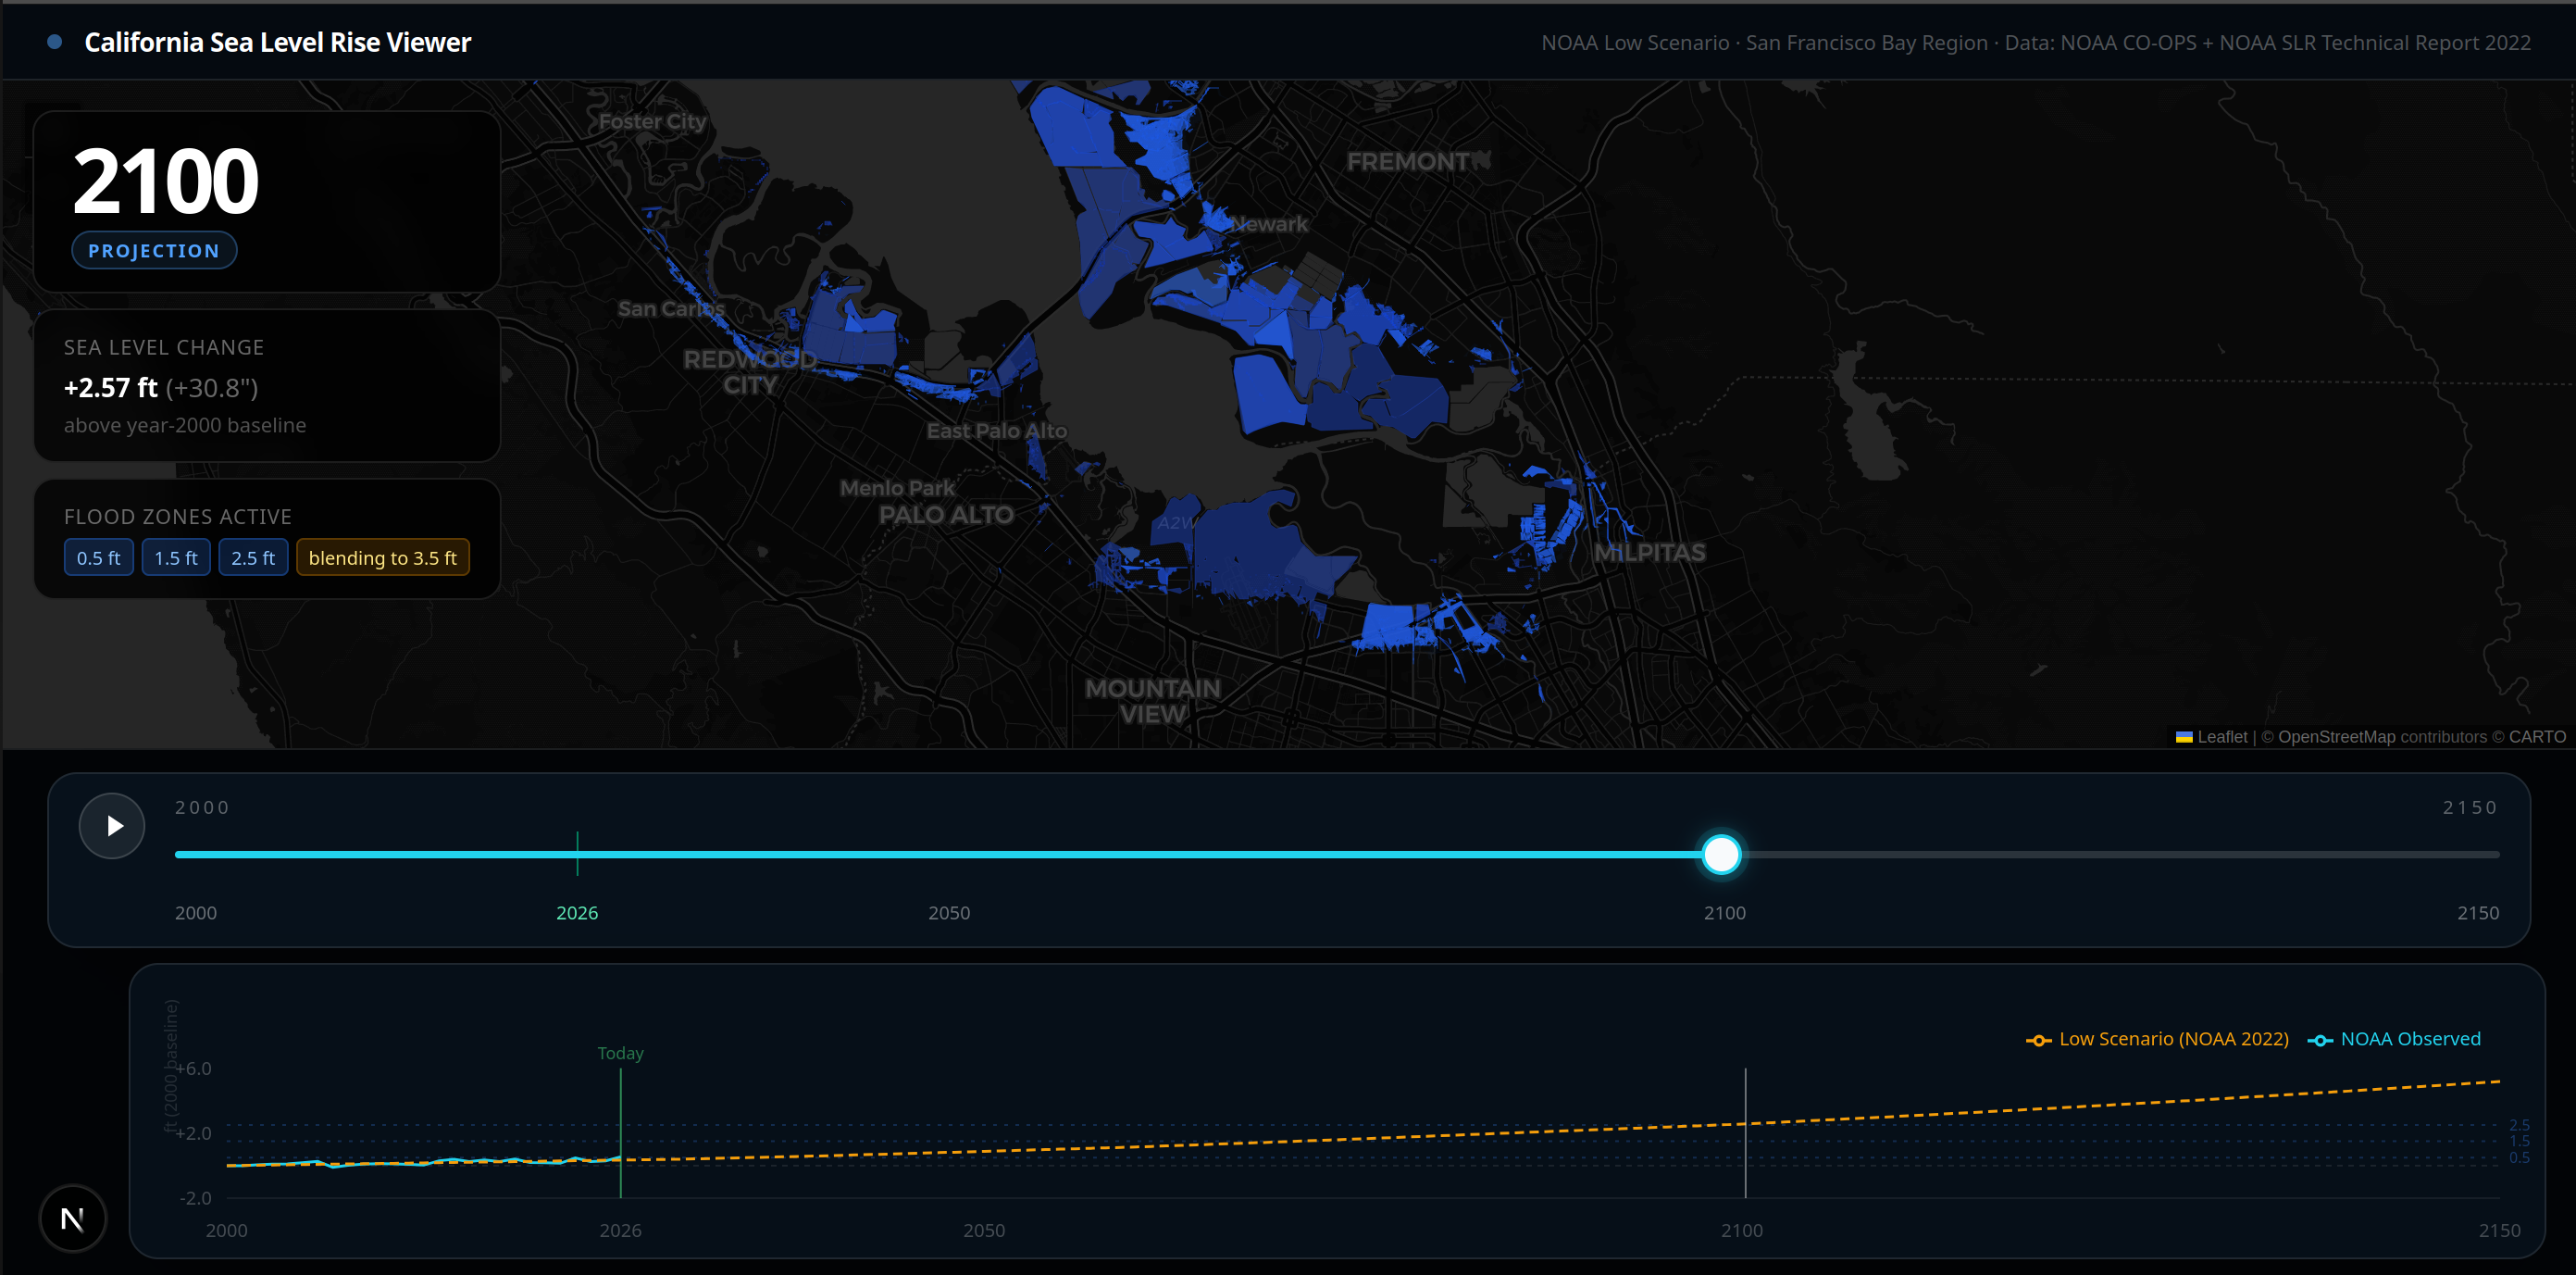
Sea level visualization at year 2100
Inspiration
Sea level rise is often presented through static charts or technical flood maps, which can be difficult for most people to connect with. We wanted to build something more visual and intuitive: a tool that lets people watch a coastline change over time instead of reading about it abstractly.
What it does
Spectre is an interactive web app that lets users move through time and see how coastal flood risk changes from past to present to future. A year-based timeline drives the entire experience, updating the map and chart together so users can explore sea level change as one continuous visual story.
How we built it
We built Spectre using Next.js, React, TypeScript, Leaflet, and Recharts. We used NOAA Sea Level Rise Viewer polygon data for the map layers, NOAA CO-OPS tide-gauge data for the observed historical record, and NOAA 2022 sea level rise projections for the future timeline. We also generated our own historical proxy polygon layers so the visualization could stay consistent across the full timeline.
Challenges we ran into
One of the biggest challenges was balancing visual continuity with scientific honesty. We wanted the coastline to evolve smoothly over time, but we also needed to avoid overstating the accuracy of historical area layers that were designed as proxies rather than exact reconstructions. We also had to simplify and optimize geospatial data enough for the app to run smoothly in the browser.
Accomplishments that we're proud of
We’re proud that Spectre turns complex environmental data into a clear, interactive experience instead of a static dashboard. The strongest part of the project is the continuous timeline itself: the map, chart, and year slider all work together to make long-term sea level change feel tangible and easy to follow.
What we learned
We learned a lot about working with NOAA geospatial and tide-gauge data, preparing those datasets for a web app, and designing around uncertainty responsibly. We also learned how much better climate data communicates when it is presented as a visual experience rather than just raw numbers or isolated maps.
What's next for Spectre
Next, we want to expand Spectre with 3D coastline visualization, broader geographic coverage, more sea level rise scenarios, and AI-assisted future flood prediction. We also want to make the experience more immersive and location-specific so it can become a stronger tool for education, planning, and public awareness.
Data Sources
Spectre uses NOAA Sea Level Rise Viewer polygon data to power the map-based coastline and flood-area visualization. We processed those layers into lightweight GeoJSON files for the future timeline and also used them as the spatial base for our historical proxy layers, so the entire experience stays visually consistent. Source: https://coast.noaa.gov/slrdata/Sea_Level_Rise_Vectors/index.html
We used NOAA CO-OPS tide-gauge data as the observed historical evidence layer. In the current app, San Francisco station 9414290 is used for the historical chart, and broader NOAA station trend data helped inform the historical proxy layer generation. Sources: https://api.tidesandcurrents.noaa.gov/api/prod/datagetter https://api.tidesandcurrents.noaa.gov/mdapi/prod/webapi/stations.json?type=waterlevels https://tidesandcurrents.noaa.gov/sltrends/data/USStationsLinearSeaLevelTrends.csv https://tidesandcurrents.noaa.gov/stationhome.html?id=9414`290
We used NOAA’s 2022 Sea Level Rise Technical Report for the low-scenario projection values that drive the future timeline and flood-threshold logic. Source: https://earth.gov/sealevel/us/resources/2022-sea-level-rise-technical-report/
We also generated our own historical proxy polygon layers to create a continuous past-to-future coastline visualization. These are derived layers based on NOAA flood polygons and station trend context, and are intended as a visual continuity tool rather than a precise historical reconstruction.
Built With
- leaflet.js
- next.js
- noaa
- node.js
- recharts
- tailwind

Log in or sign up for Devpost to join the conversation.