-
-

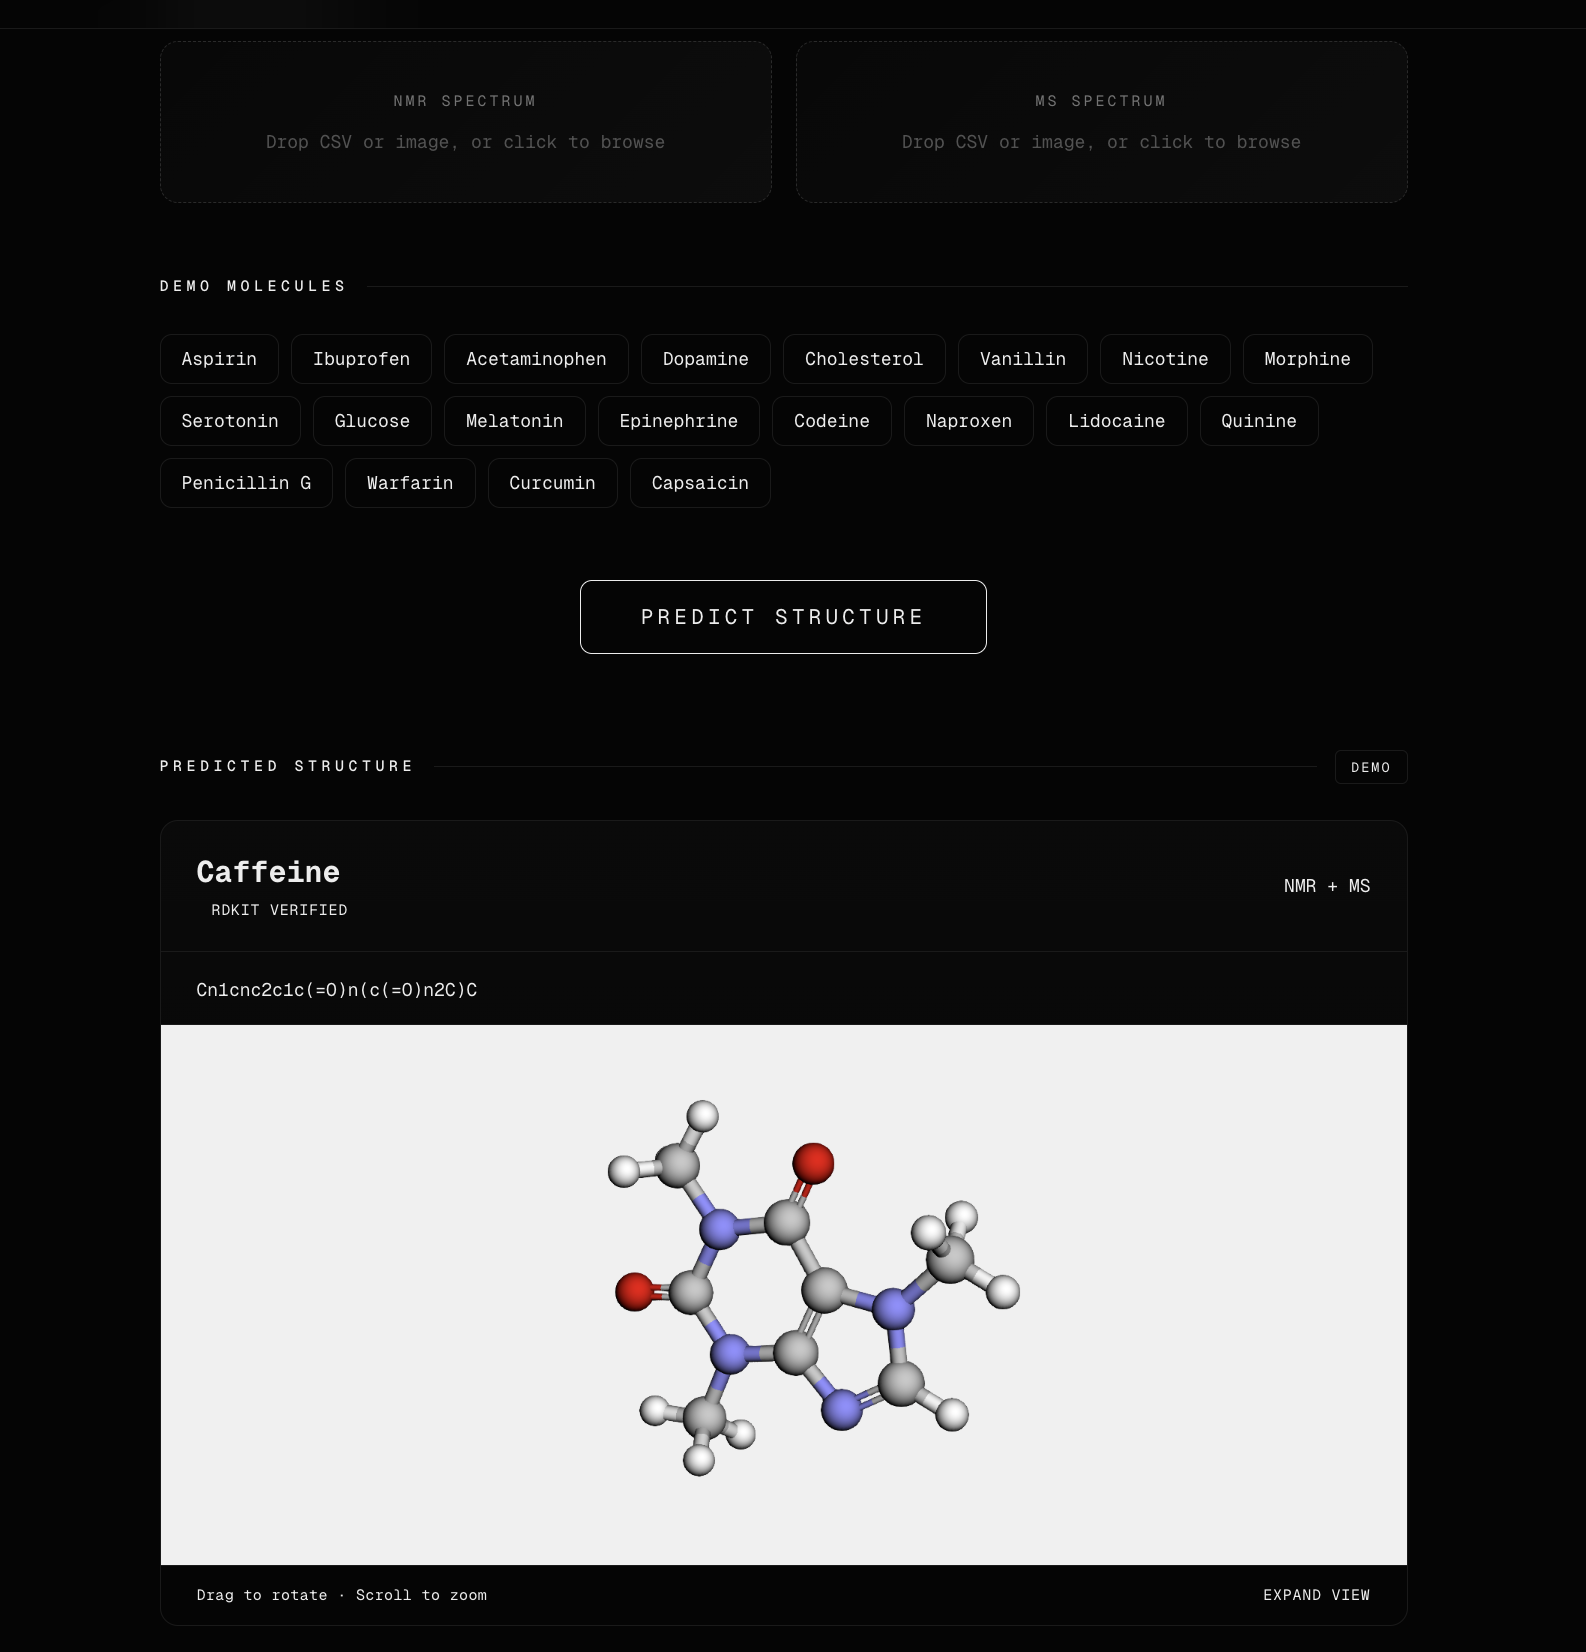
Image of one of the examples.
Inspiration
Interpreting spectral data can be slow, technical, and difficult, especially for students, researchers, or anyone without deep chemistry experience. We wanted to build something that makes molecular identification more accessible by turning complex NMR and mass spectrometry data into a clearer, faster, and more visual experience.
What it does
SpectraStruct allows users to upload NMR or MS spectral data and receive a predicted molecular structure. The platform then presents the result with an interactive 3D conformer visualization, helping users better understand the predicted molecule in a more intuitive and visual way.
How we built it
We built SpectraStruct as a full-stack application with a frontend for uploading spectra, selecting demo molecules, and viewing predictions. On the backend, we created a pipeline to process spectral CSV data and connect it to our molecular structure prediction workflow. We also worked on integrating 3D molecular visualization so the final result would feel interactive and useful rather than just returning a plain prediction.
Challenges we ran into
One of our biggest challenges was building the 3D molecular structure visualization, since that process was not very beginner-friendly and required us to learn tools and workflows that were new to us. We also struggled with training the model on spectral data. Training took a lot of time, and the results were not always as strong as we hoped, which made iteration difficult. That challenge showed us how important data quality, preprocessing, and model design are in scientific machine learning projects.
What we learned
We learned a lot about the complexity of spectral interpretation, the difficulty of working with scientific data, and the importance of building interfaces that make technical results easier to understand. We also learned that combining machine learning, chemistry, and visualization into one product requires a lot of iteration, especially when working with limited time and resources.
What's next for SpectraStruct
In the future, we want to expand SpectraStruct so users can upload not only CSV files but also images of spectroscopy graphs. Using computer vision, we plan to extract the graph data from an image, convert it into CSV-like structured data, and then feed that into our prediction pipeline. This would make the platform much more flexible and accessible for users who only have graph images instead of raw data files. We also want to improve model accuracy, support more spectral formats, and make the prediction pipeline more robust overall.

Log in or sign up for Devpost to join the conversation.