-
-
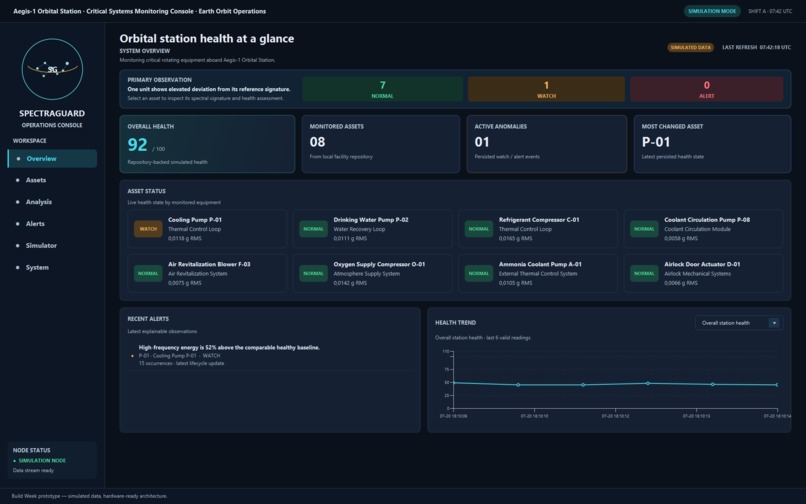
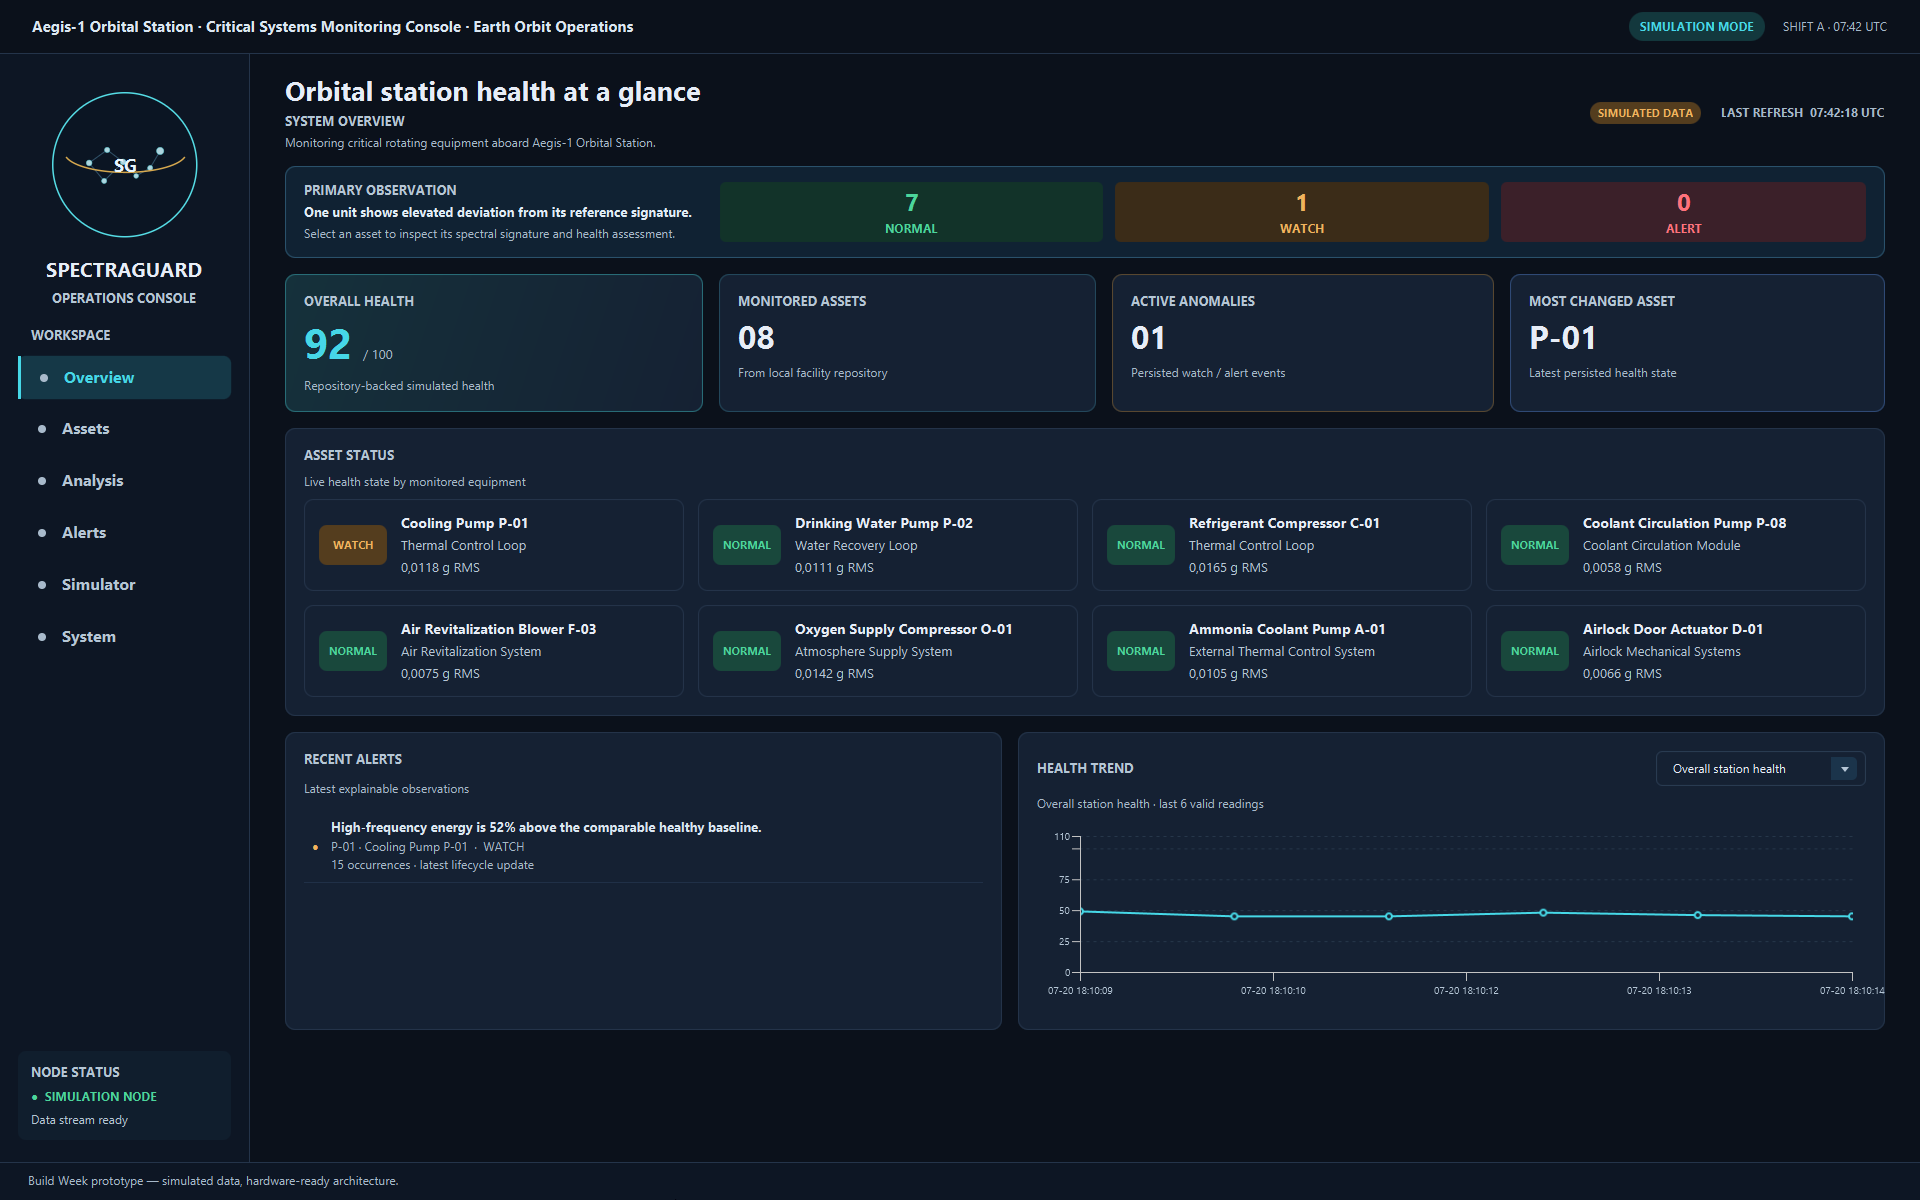
Orbital Station Health at a Glance. Overview
-
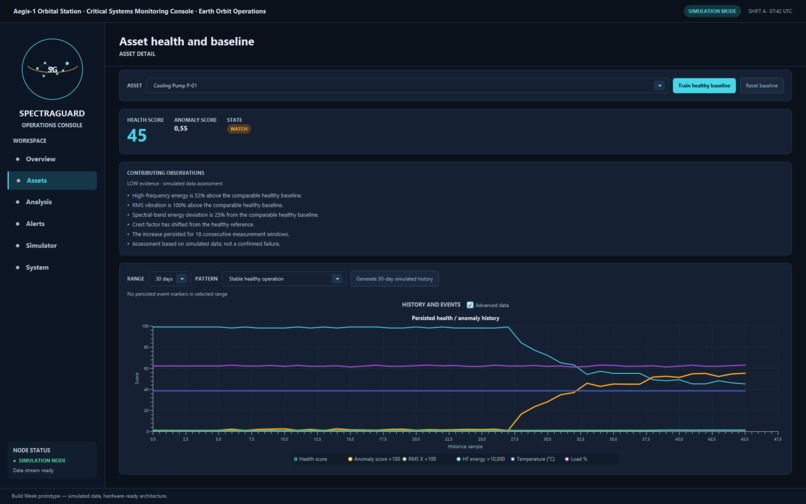
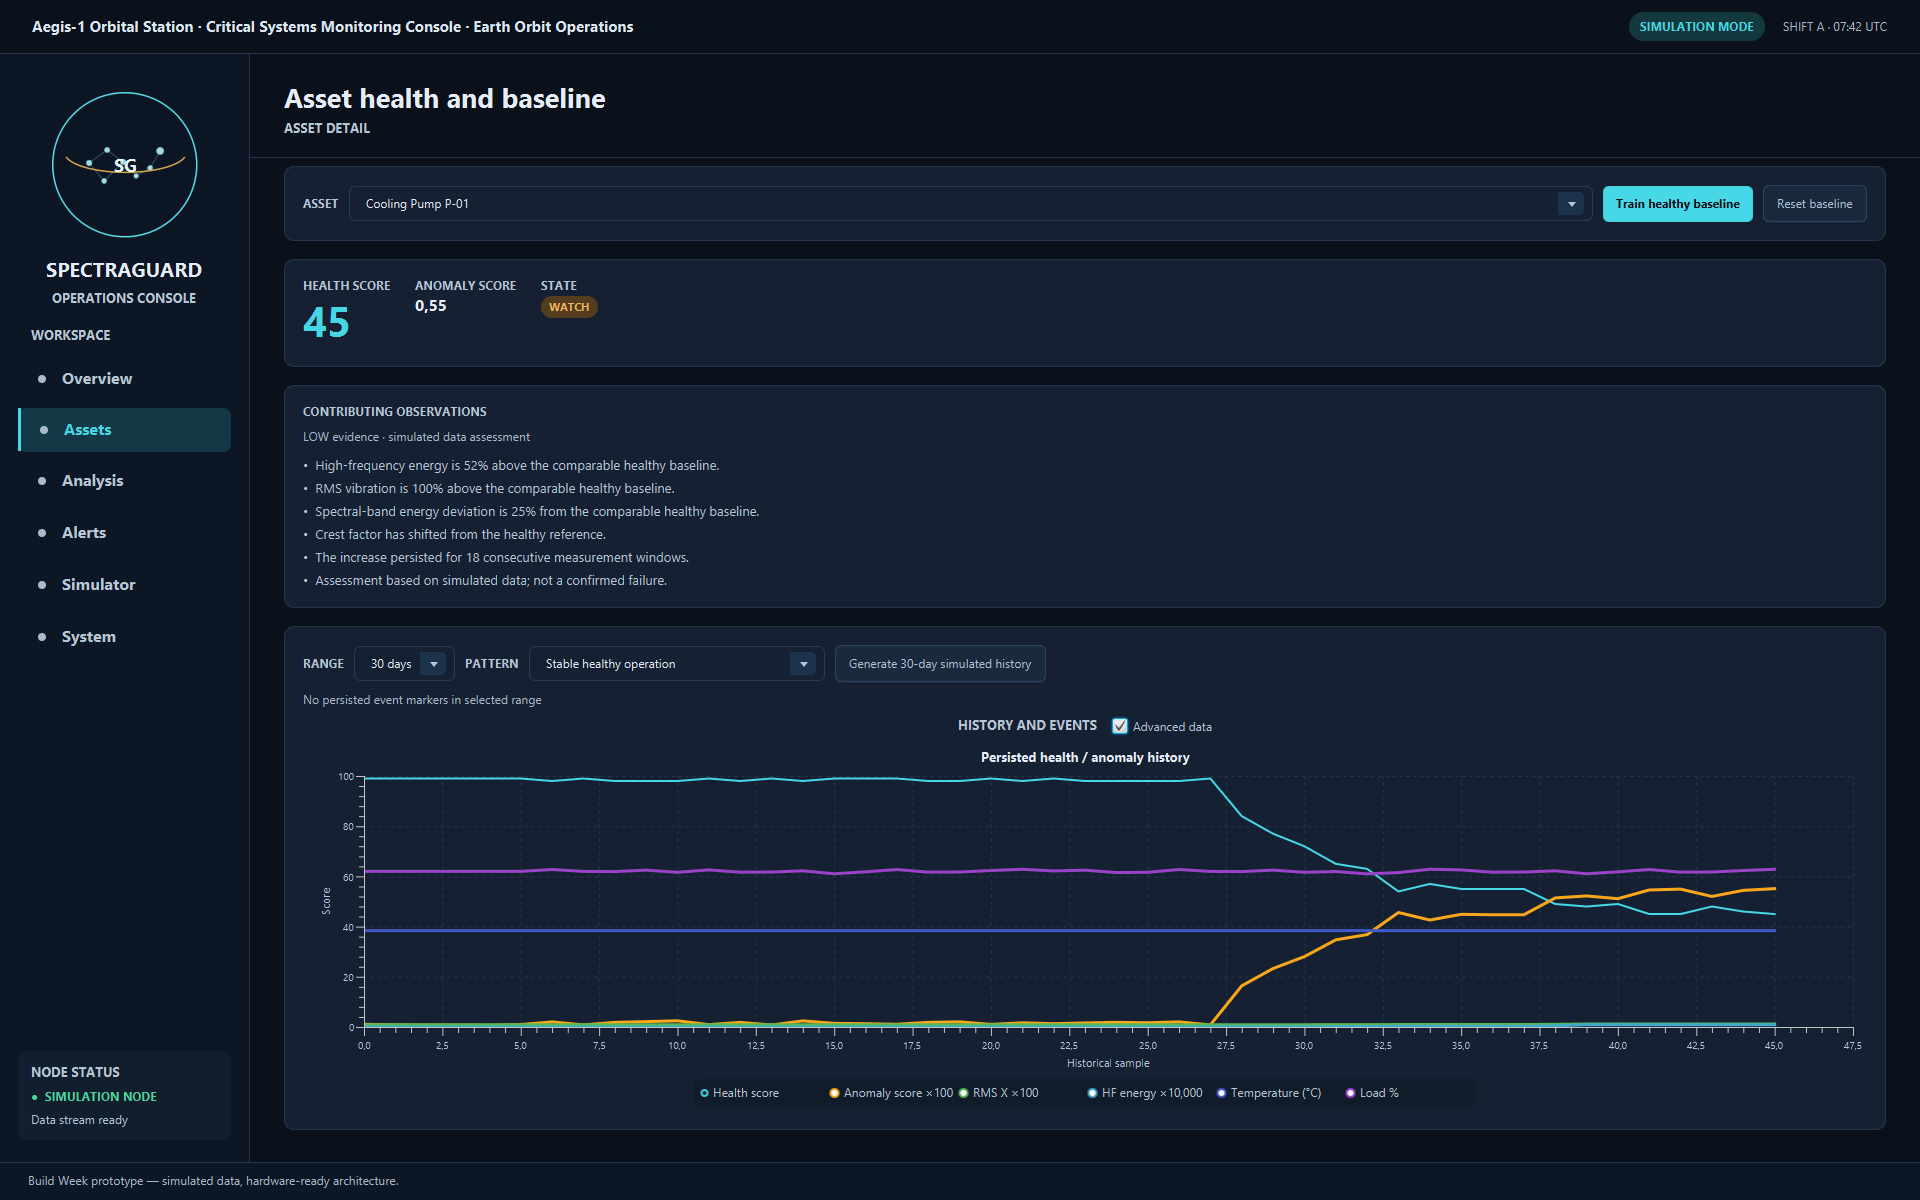
Asset Health and Baseline
-
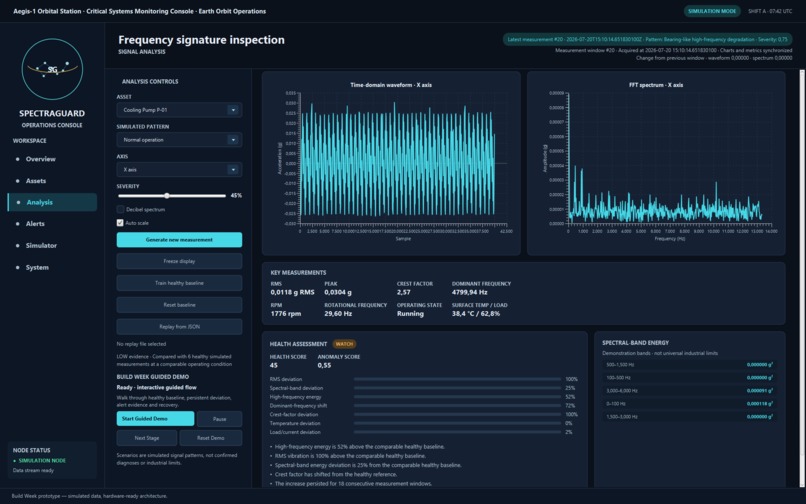
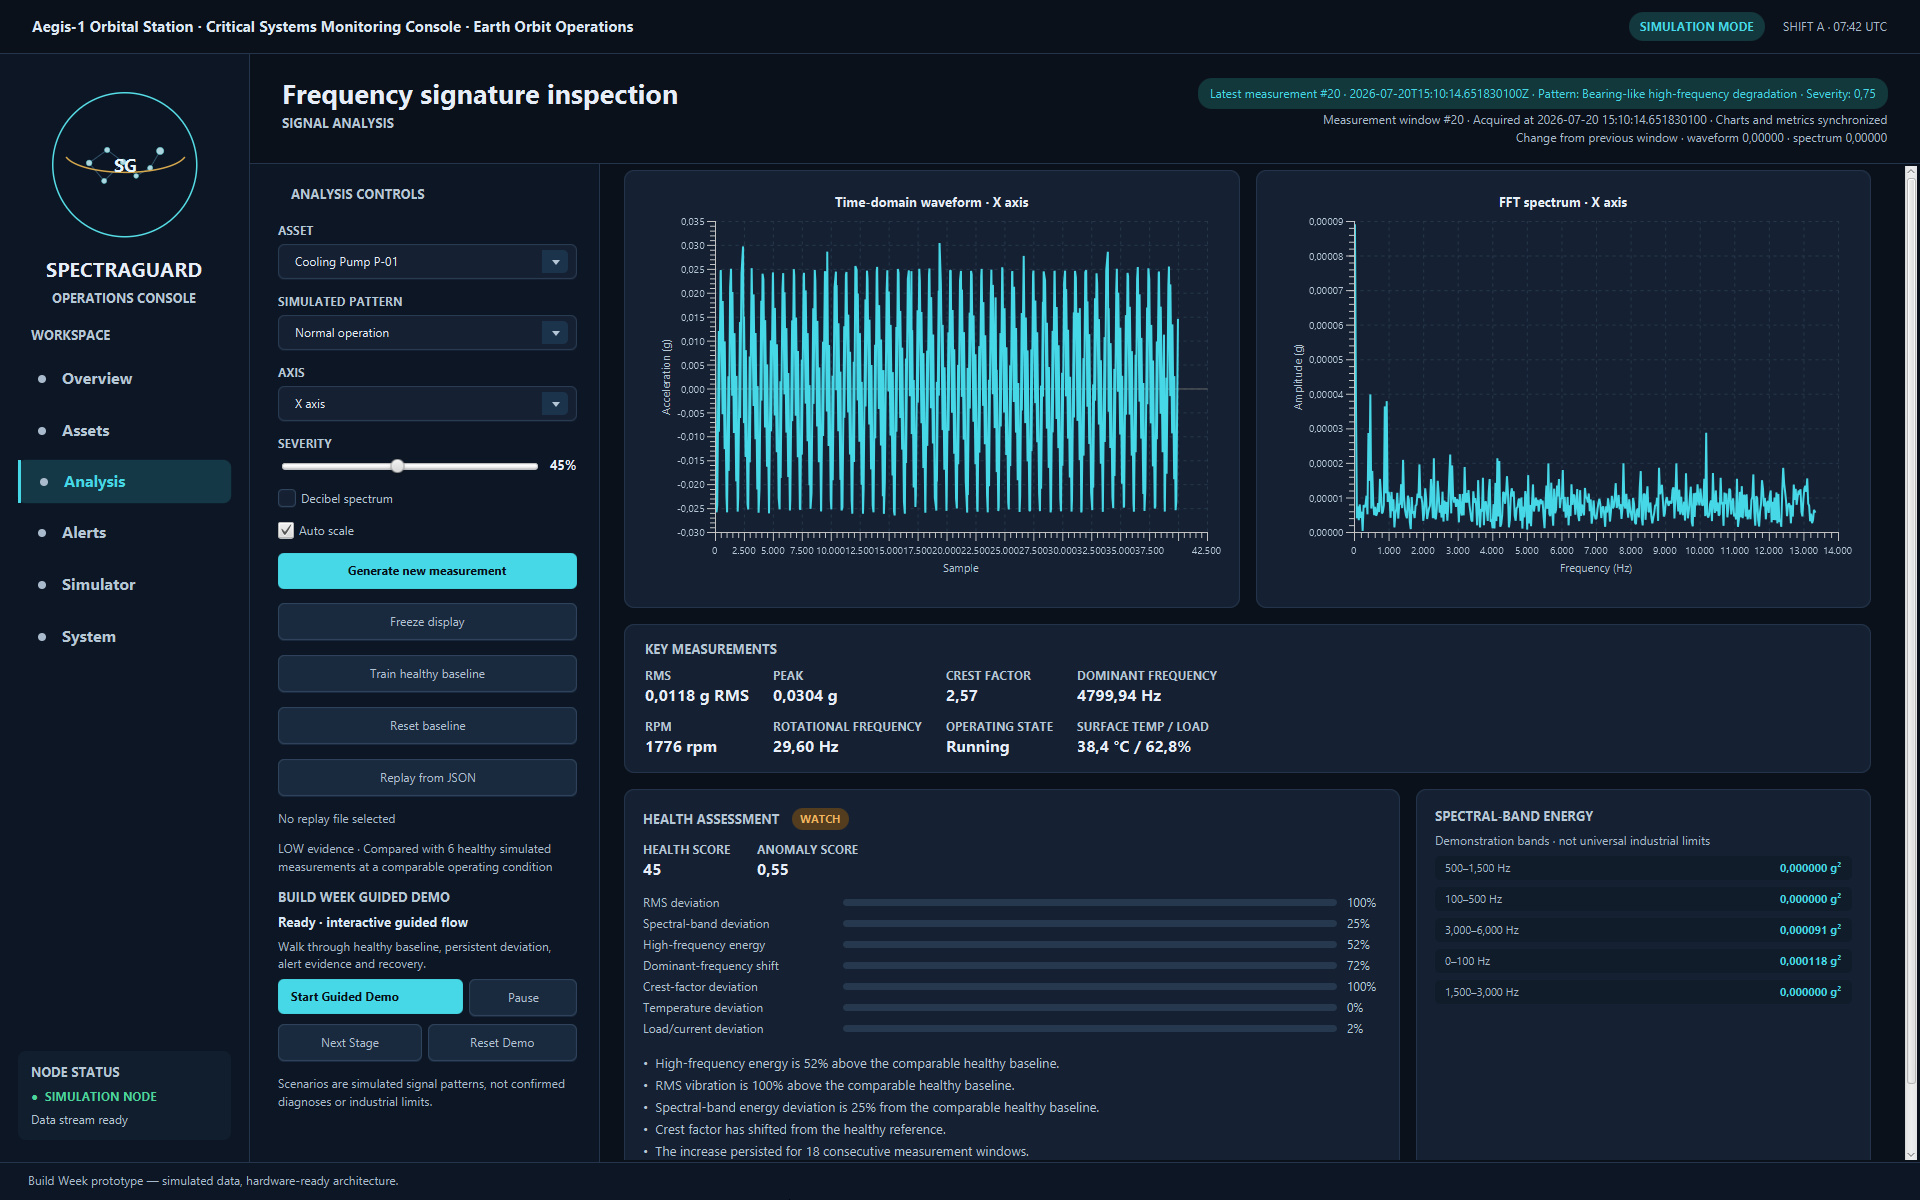
Frequency Signature Inpsection
-
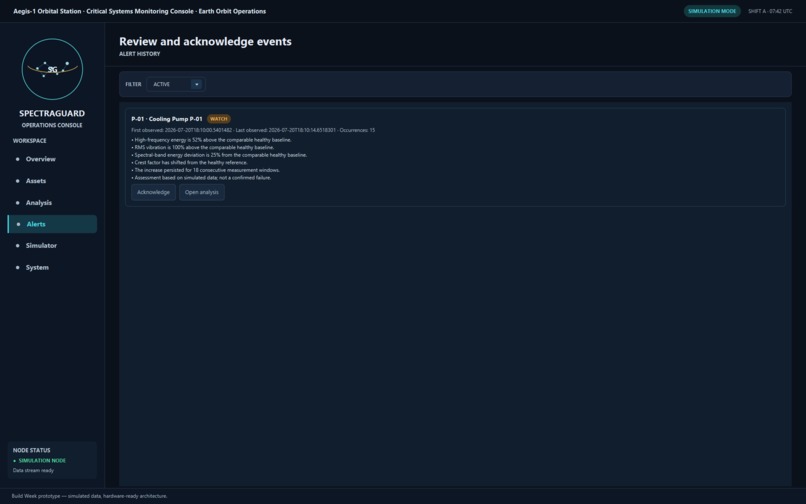
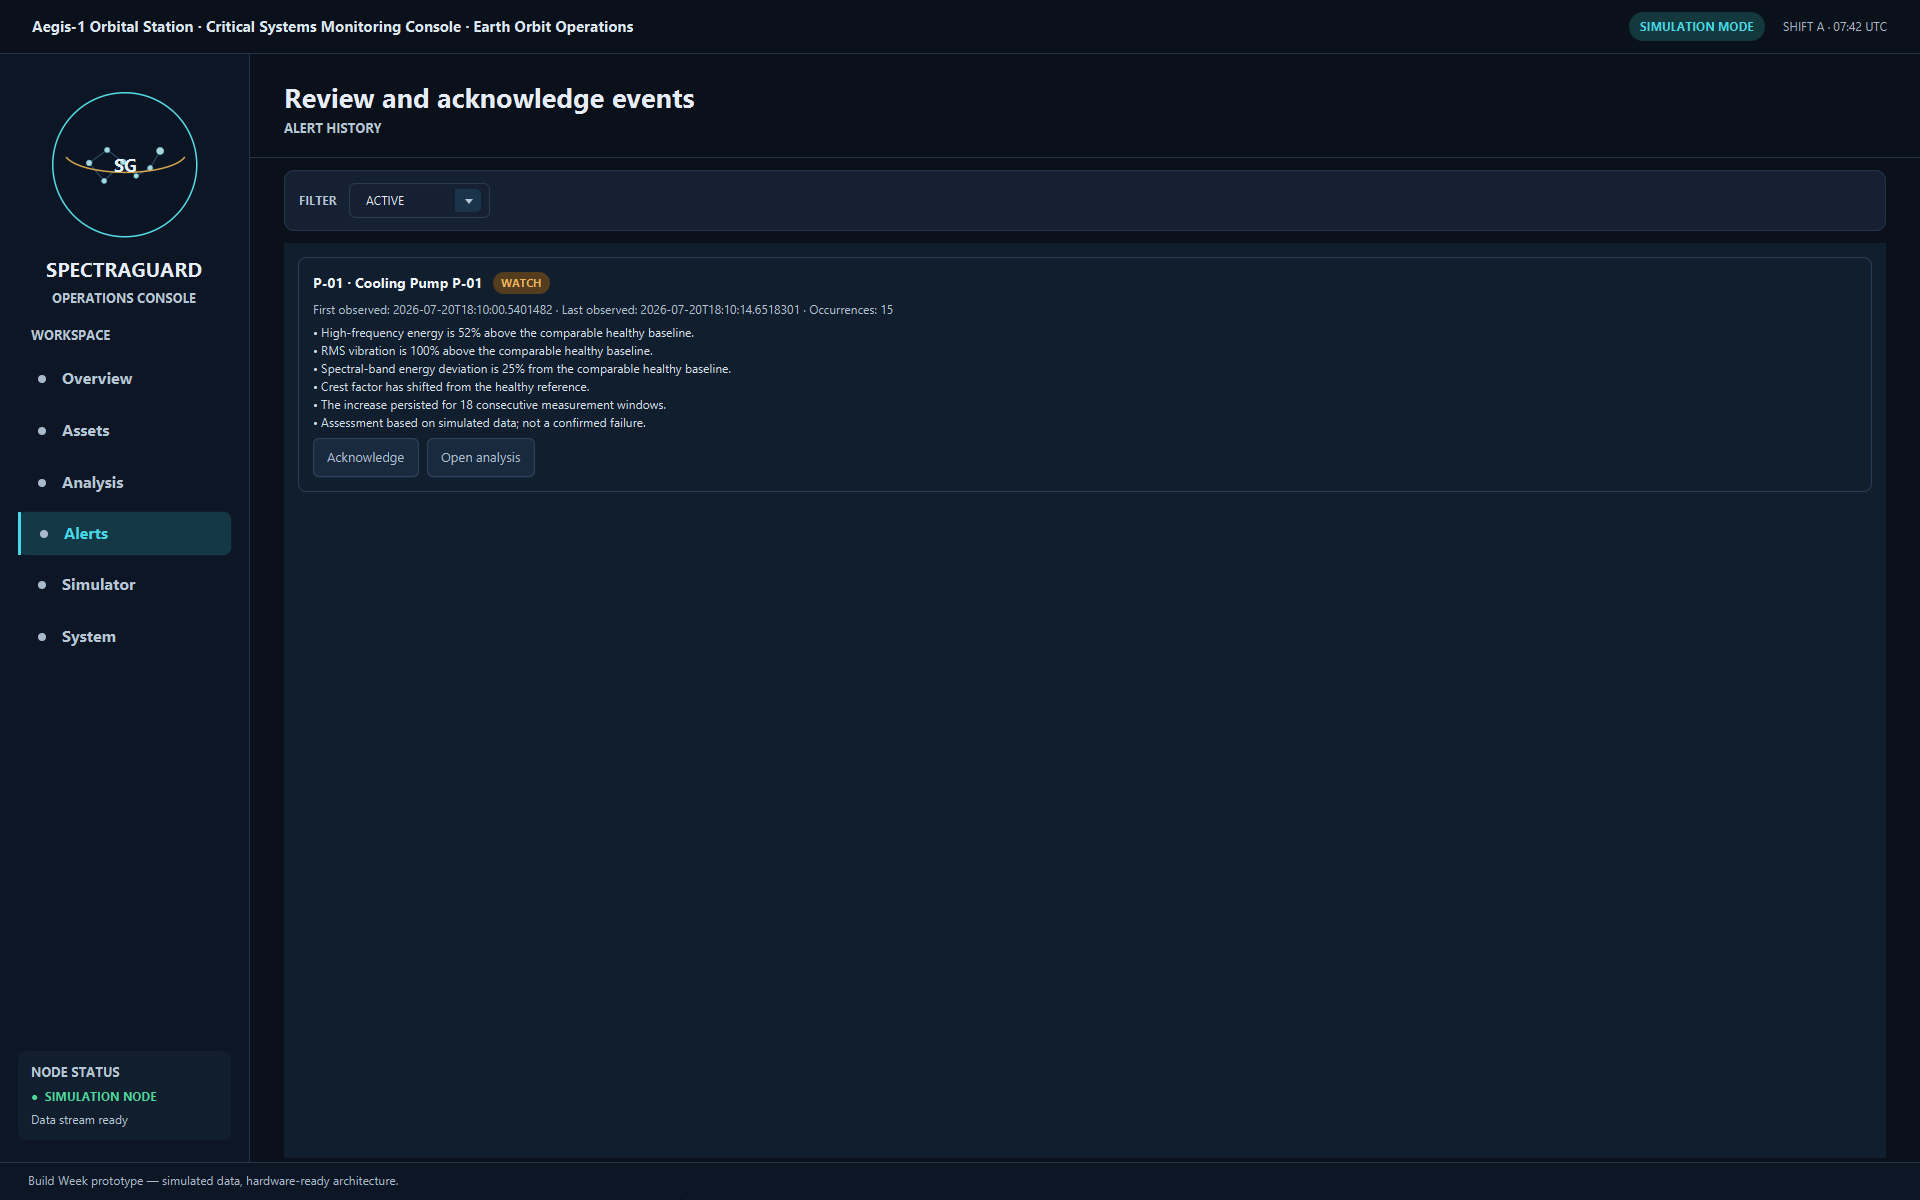
Review and Acknowledge Events
-
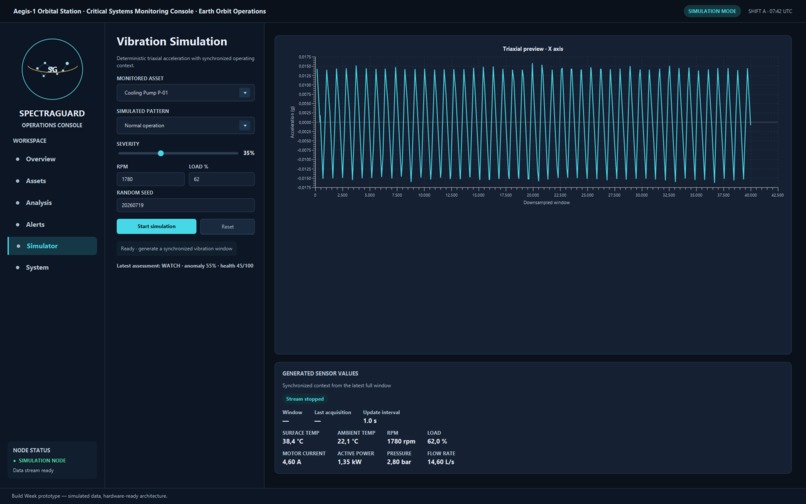
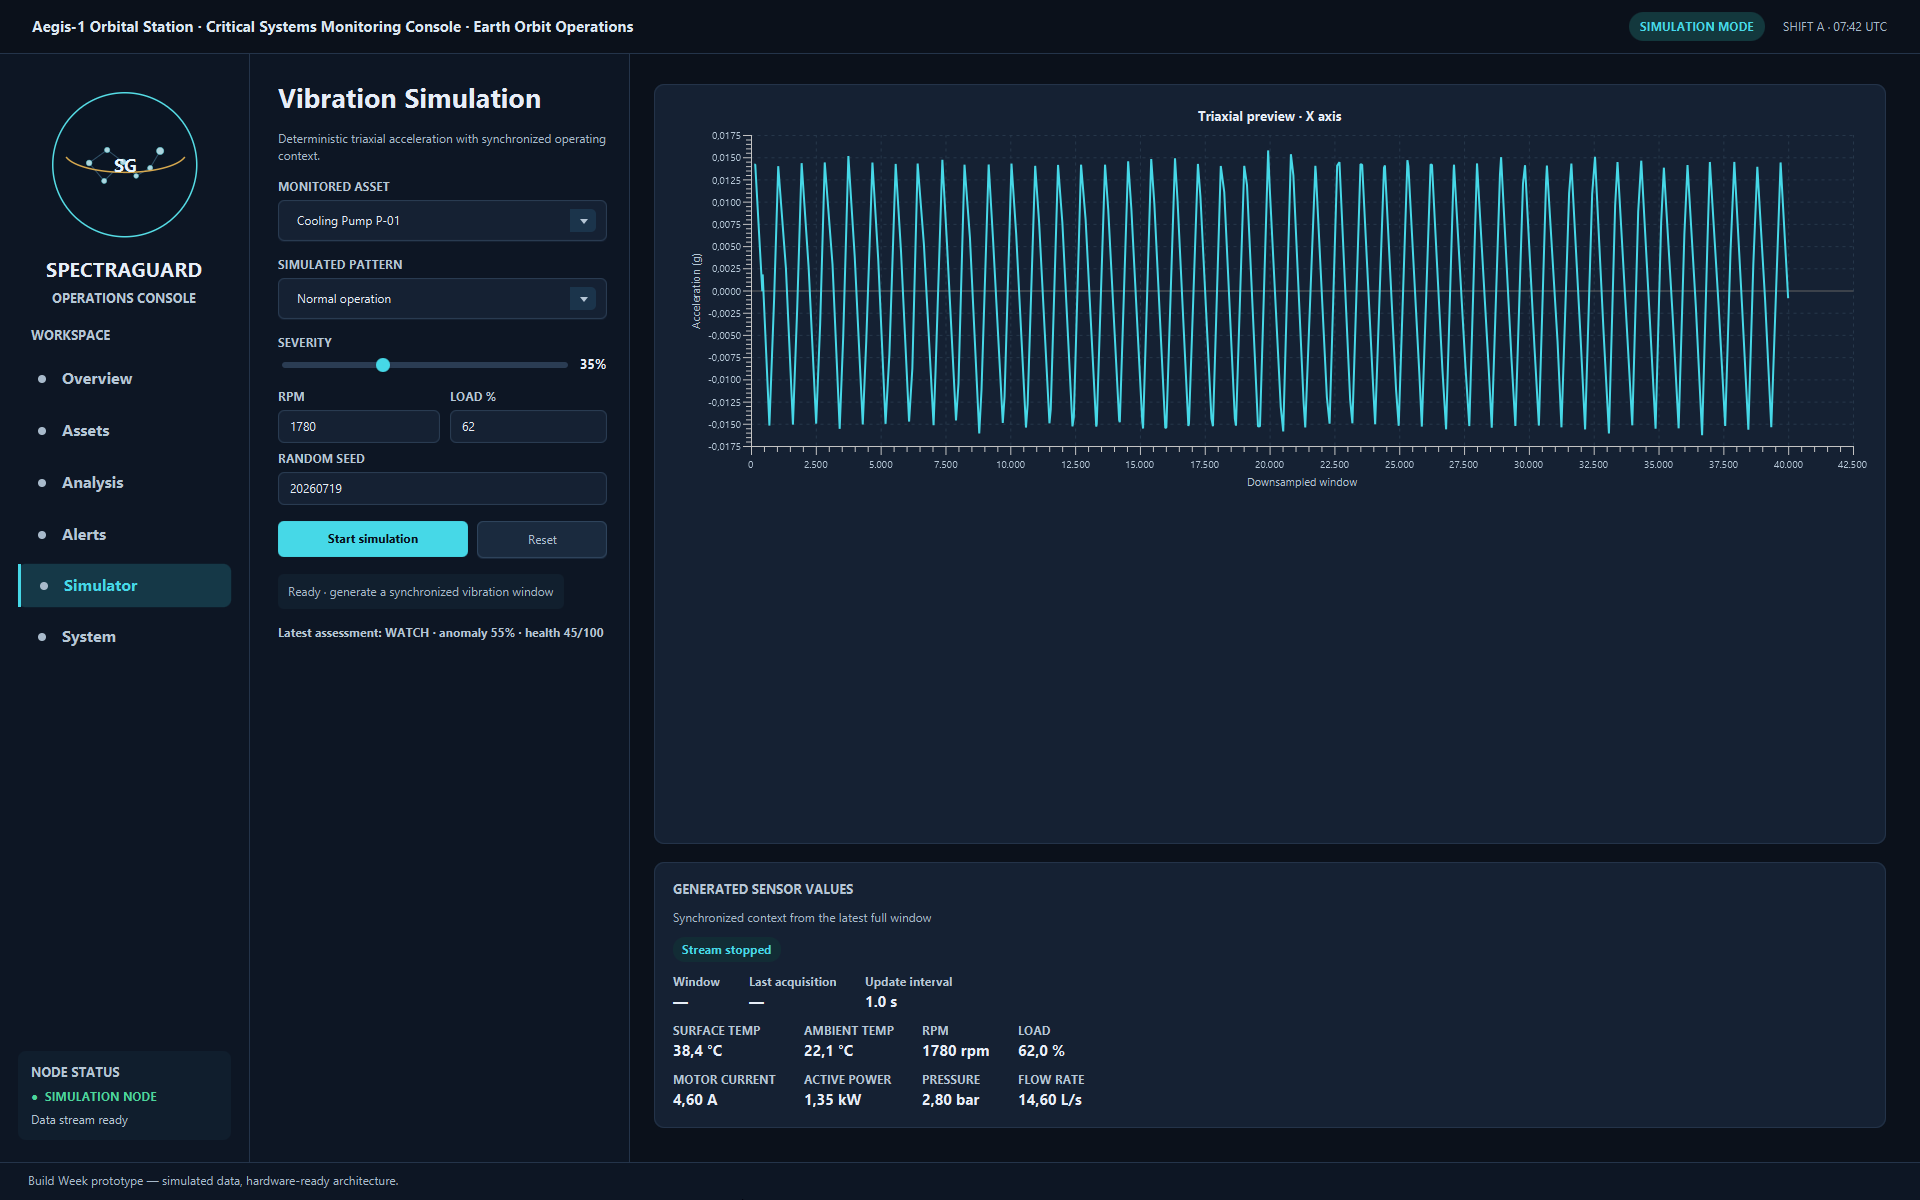
Vibration Simulation
-
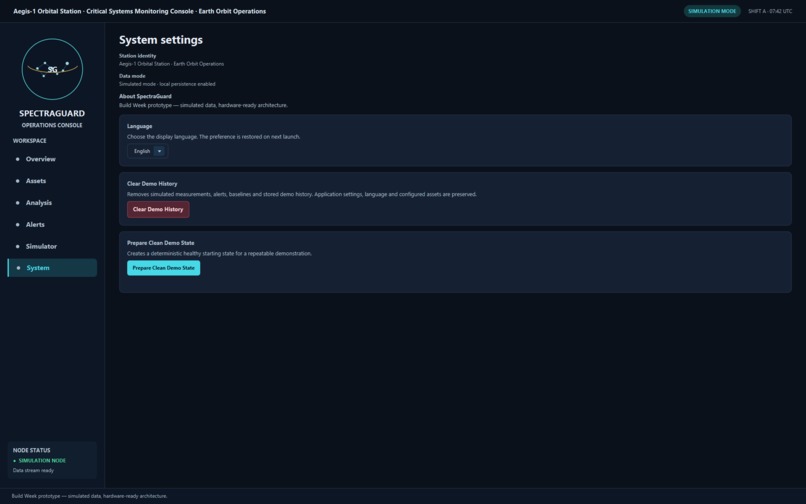
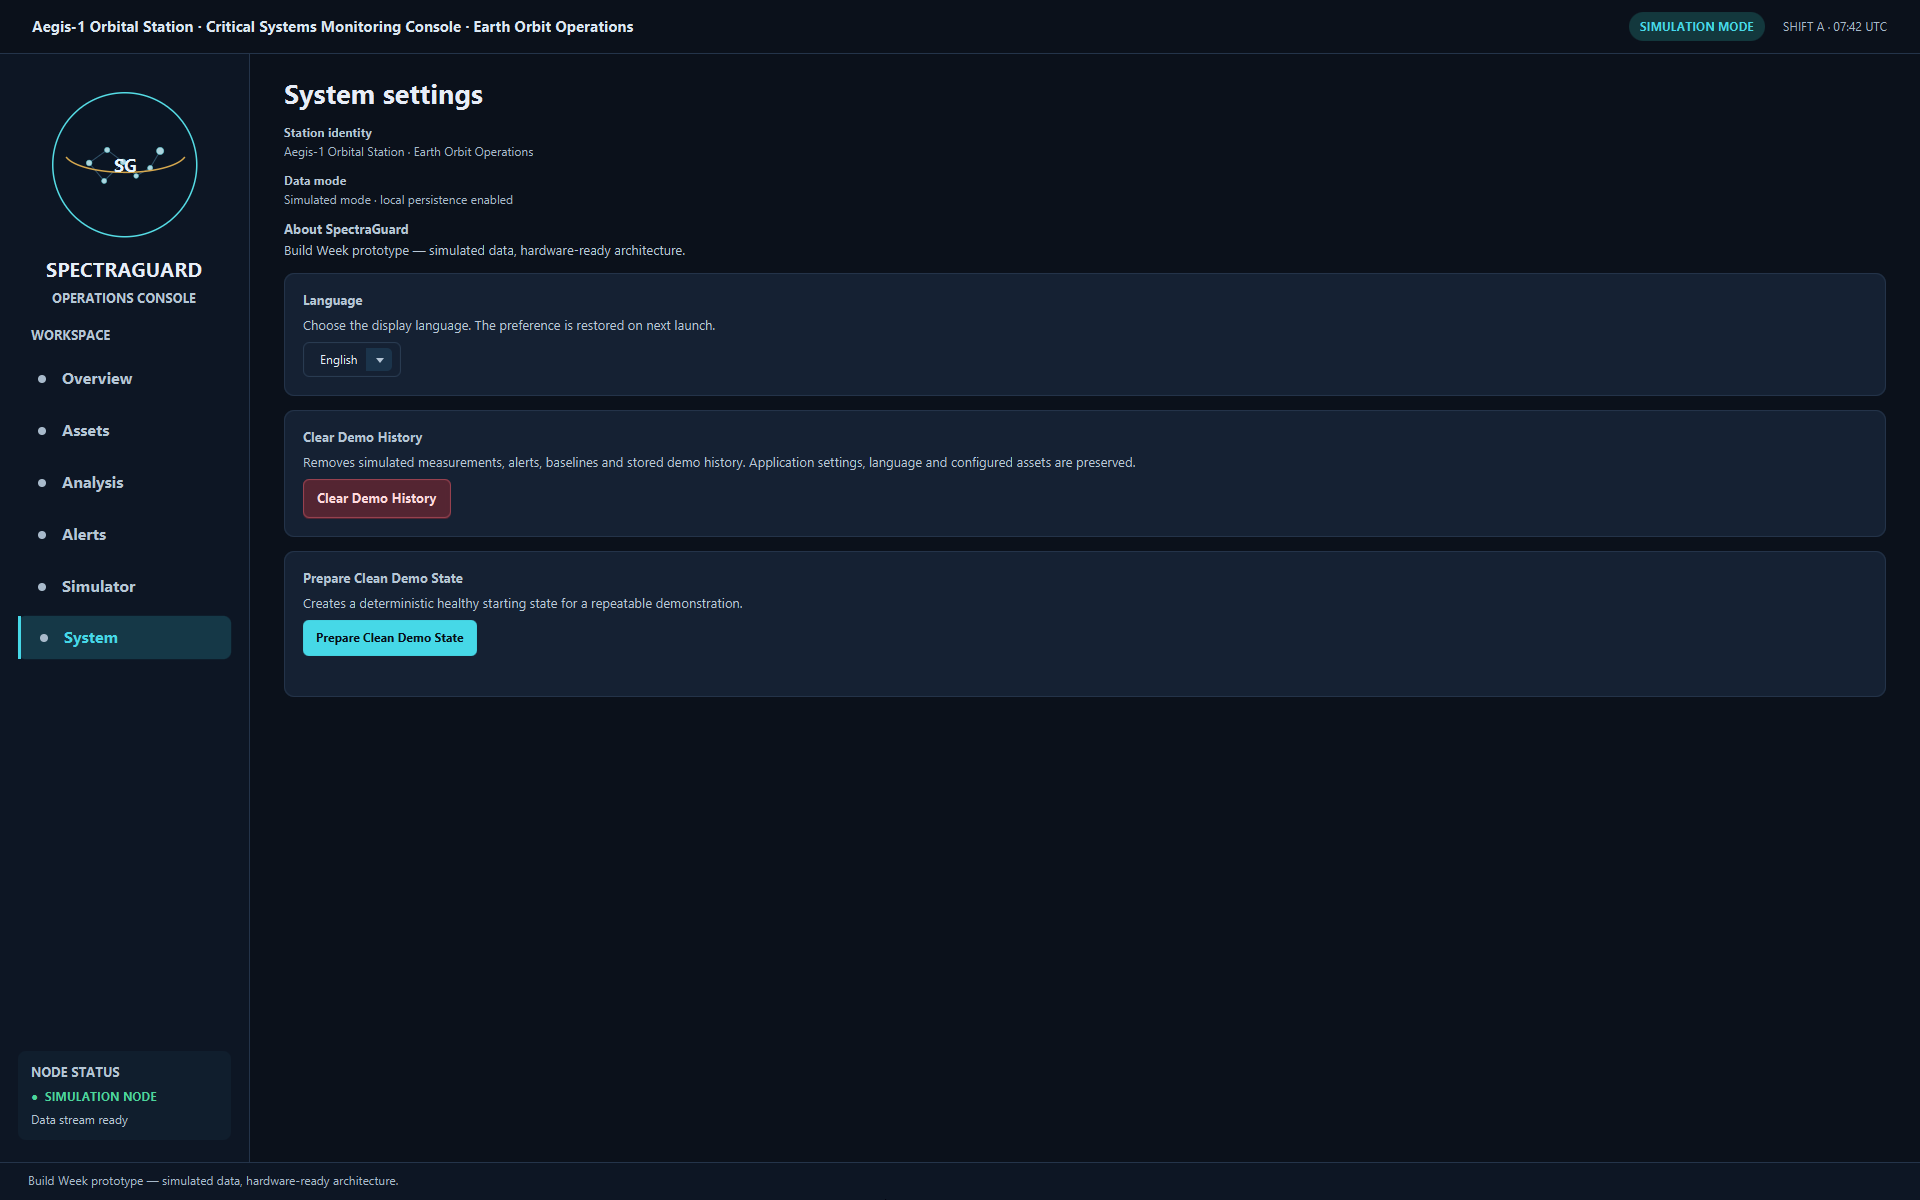
System Settings
Inspiration
SpectraGuard began with a very ordinary problem: the electronics in my refrigerator failed.
Living on an island, replacement parts, specialist support, and even basic technical information are not always immediately available. A failure that might be a minor inconvenience in a large city can become expensive, wasteful, and difficult to solve in a remote community.
Instead of replacing the entire appliance, I began developing my own software and control architecture to understand its behavior, bypass unreliable electronics, and keep it operating. During that process, I realized that the same sensor data used to diagnose a machine after a problem could also be used to identify changes before a complete failure occurred.
What started as a personal repair unexpectedly became the foundation of a predictive-maintenance concept.
For me, this represented something larger: technology helping people overcome cost, isolation, and the loss of practical knowledge. SpectraGuard is an exploration of how artificial intelligence and explainable signal analysis could make advanced maintenance tools more accessible—not only to large industrial organizations, but eventually to small workshops, schools, remote communities, and people trying to keep essential equipment alive.
What SpectraGuard does
SpectraGuard is a simulated predictive-maintenance and condition-monitoring console for critical rotating and electromechanical equipment aboard the fictional Aegis-1 Orbital Station.
The application monitors eight simulated assets:
Cooling Pump P-01 Drinking Water Pump P-02 Refrigerant Compressor C-01 Coolant Circulation Pump P-08 Air Revitalization Blower F-03 Oxygen Supply Compressor O-01 Ammonia Coolant Pump A-01 Airlock Door Actuator D-01
Each asset has its own deterministic operating profile, healthy reference baseline, vibration signature, temperature, RPM or cycle rate, load, current, pressure, and flow context where applicable.
The system processes simulated triaxial vibration windows and performs:
waveform inspection FFT spectral analysis feature extraction baseline comparison anomaly scoring health scoring persistent NORMAL → WATCH → ALERT state transitions explainable contributing observations alert lifecycle management historical trend visualization local SQLite persistence
The goal is not simply to display that something is wrong. SpectraGuard attempts to explain what changed—for example, elevated high-frequency energy, RMS deviation, spectral-band deviation, or a shifted crest factor—and whether the condition persisted across consecutive measurement windows.
How I built it
SpectraGuard was built as a Java desktop application using:
Java 21 JavaFX 21 Maven SQLite JTransforms for FFT processing Jackson JUnit
The application follows a service-oriented architecture.
A central measurement pipeline receives every completed simulated sensor window, performs FFT and feature extraction, loads the correct baseline for the selected asset, calculates the anomaly and health assessment, persists the result, updates the alert lifecycle, and publishes the completed analysis to the interface.
This pipeline is independent of whichever screen is currently open. That was an important architectural decision: the Simulator must continue processing data even when the Analysis screen is not visible.
The main workflow is:
Simulated sensor window → FFT and feature extraction → reference-baseline comparison → anomaly and health assessment → SQLite persistence → WATCH/ALERT lifecycle → Overview, Analysis, Assets, and Alerts updates
The prepared demo state is deterministic. It creates:
8 monitored assets 8 independent healthy baselines 48 processed measurements 48 health assessments 0 alerts all assets in NORMAL an overall health score near 99/100
From that clean state, a user can start the P-01 simulator in normal operation, introduce a high-severity bearing-like degradation pattern, and observe the assessment progress from WATCH to ALERT after several consecutive windows.
I built SpectraGuard as a JavaFX predictive-maintenance console for simulated critical equipment monitoring. I used Codex as my main development agent to implement and refine the application architecture, JavaFX interface, FFT signal-processing workflow, SQLite persistence, deterministic simulator, alert lifecycle, localization, and automated tests. I used GPT-5.6 to reason through the system design, validate technical decisions, identify inconsistencies, improve the explainability of the monitoring workflow, and help structure the documentation and final demonstration.
How I used Codex
Codex was used throughout the project as a development partner.
It helped with:
project architecture JavaFX implementation FFT and signal-processing integration SQLite schema and repositories central measurement-pipeline design deterministic simulation profiles baseline and anomaly logic alert lifecycle deduplication English and Greek localization automated testing debugging startup crashes and asynchronous state issues repository-wide refactoring documentation and release preparation
A major benefit was the ability to move between high-level architecture and very specific implementation details. For example, Codex helped trace a critical integration failure where the Simulator published measurements only to an in-memory service, while the Overview read exclusively from SQLite. The solution was a central processing pipeline that persists every simulator window regardless of which view is active.
Codex also helped build automated regression tests for deterministic preparation, rollback behavior, exactly-once processing, alert escalation, duplicate prevention, synchronized trend timestamps, and UI-readability policies.
Challenges Building a real end-to-end pipeline
The first version of the Simulator generated convincing waveforms but did not persist processed measurements, health assessments, or alerts. The interface looked alive, but the downstream system was disconnected.
Tracing the complete flow revealed that analysis was occurring only when the Analysis screen was open. Refactoring this into an application-level pipeline was one of the most important technical improvements in the project.
Creating meaningful alert behavior
Initially, every abnormal measurement created a new alert record. This produced alert flooding.
The system was redesigned around alert lifecycles:
NORMAL → WATCH creates one active event repeated WATCH observations update the same event WATCH → ALERT escalates the same lifecycle returning to NORMAL resolves it acknowledgement remains separate from resolution
This made the alert history much more realistic and understandable.
Deterministic demo behavior
For a competition demonstration, the same actions must produce predictable results.
The simulation therefore uses deterministic seeds and synchronized prepared baselines. A high-severity bearing fault now progresses consistently through several WATCH windows before reaching ALERT, rather than generating an arbitrary result.
User-interface readability
One of the most time-consuming challenges was not the signal processing—it was the human-machine interface.
Dark industrial interfaces can easily contain text that technically exists but is practically unreadable. Several iterations were required to correct low-contrast helper text, chart legends, ComboBox styling, empty states, alignment, spacing, dialogs, sidebar branding, and fullscreen presentation.
This reinforced an important lesson: passing static CSS tests is not the same as producing a readable rendered interface. Human visual inspection remains essential.
Representing uncertainty honestly
SpectraGuard does not claim to diagnose a real confirmed fault.
The interface explicitly states that:
the data are simulated Aegis-1 is fictional the assessment is based on deviation from a simulated healthy reference the scenarios are demonstration patterns, not universal industrial thresholds the project is not space-qualified or clinically/industrially validated
This distinction was important because explainable AI should communicate uncertainty rather than hide it.
What I learned
I learned that predictive maintenance is not one algorithm. It is a complete chain:
reliable acquisition synchronized context signal processing baseline quality asset-specific interpretation persistence over time alert lifecycle design explainability operator interface honest communication of limitations
I also learned how strongly architecture affects trust. A dashboard can look impressive while its underlying data flow is incomplete. The most valuable work was often not adding another feature, but proving that every measurement travelled through the full pipeline exactly once.
Finally, I learned that artificial intelligence is most powerful when it supports human persistence and curiosity. I did not begin this project as a space-systems engineer. I began as someone trying to repair a broken refrigerator. Codex helped turn that practical problem into a working software architecture, a tested simulation platform, and a broader idea about resilient technology.
What is next
The current version uses simulated data, but the architecture is designed to support real hardware.
A future prototype could connect:
an ESP32-S3 edge node an IIS3DWB wide-band vibration sensor PT1000 temperature sensing through MAX31865 RPM sensing current and power monitoring pressure and flow sensors
Future development would focus on:
real sensor acquisition asset-specific baseline training longer-term validation datasets configurable sampling and FFT windows more advanced feature engineering false-positive evaluation edge inference remote monitoring operator-defined alert policies deployment beyond the fictional station scenario
SpectraGuard is still a prototype, but its central idea is real:
Advanced maintenance intelligence should help people preserve essential machines before failure becomes waste, cost, or isolation.


Log in or sign up for Devpost to join the conversation.