-
-
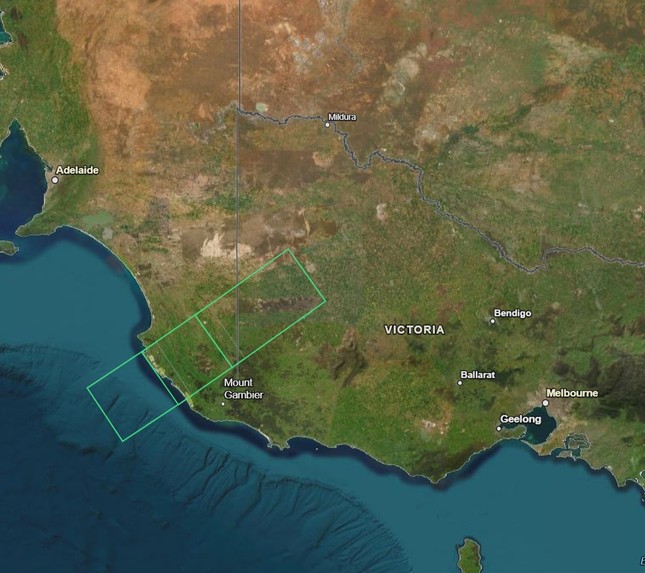
The Victorian Sites where NASA spectral data was used.
-
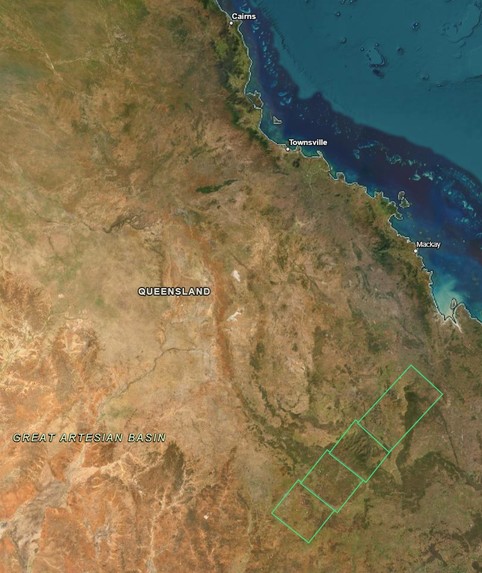
The Queensland Sites where NASA spectral data was used.
-

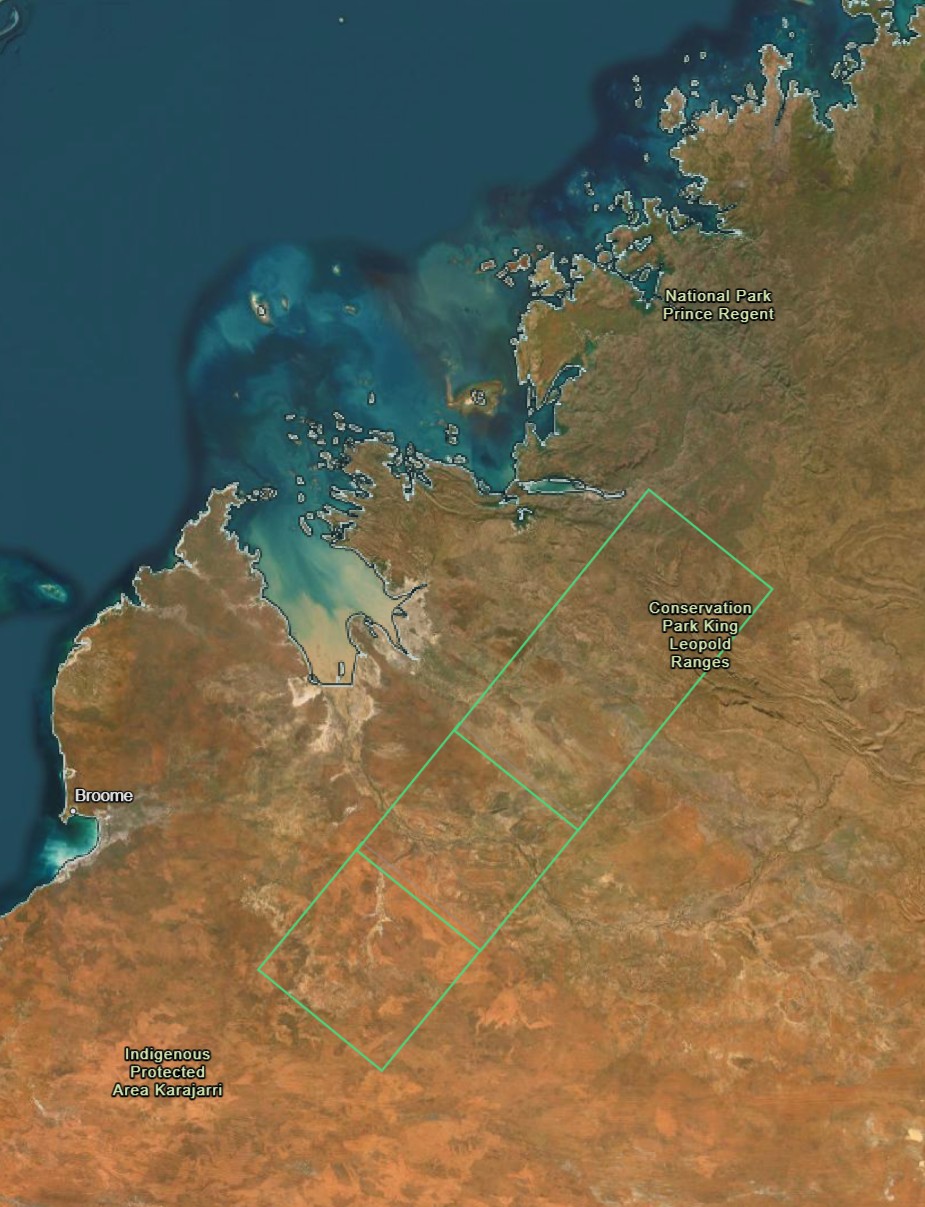
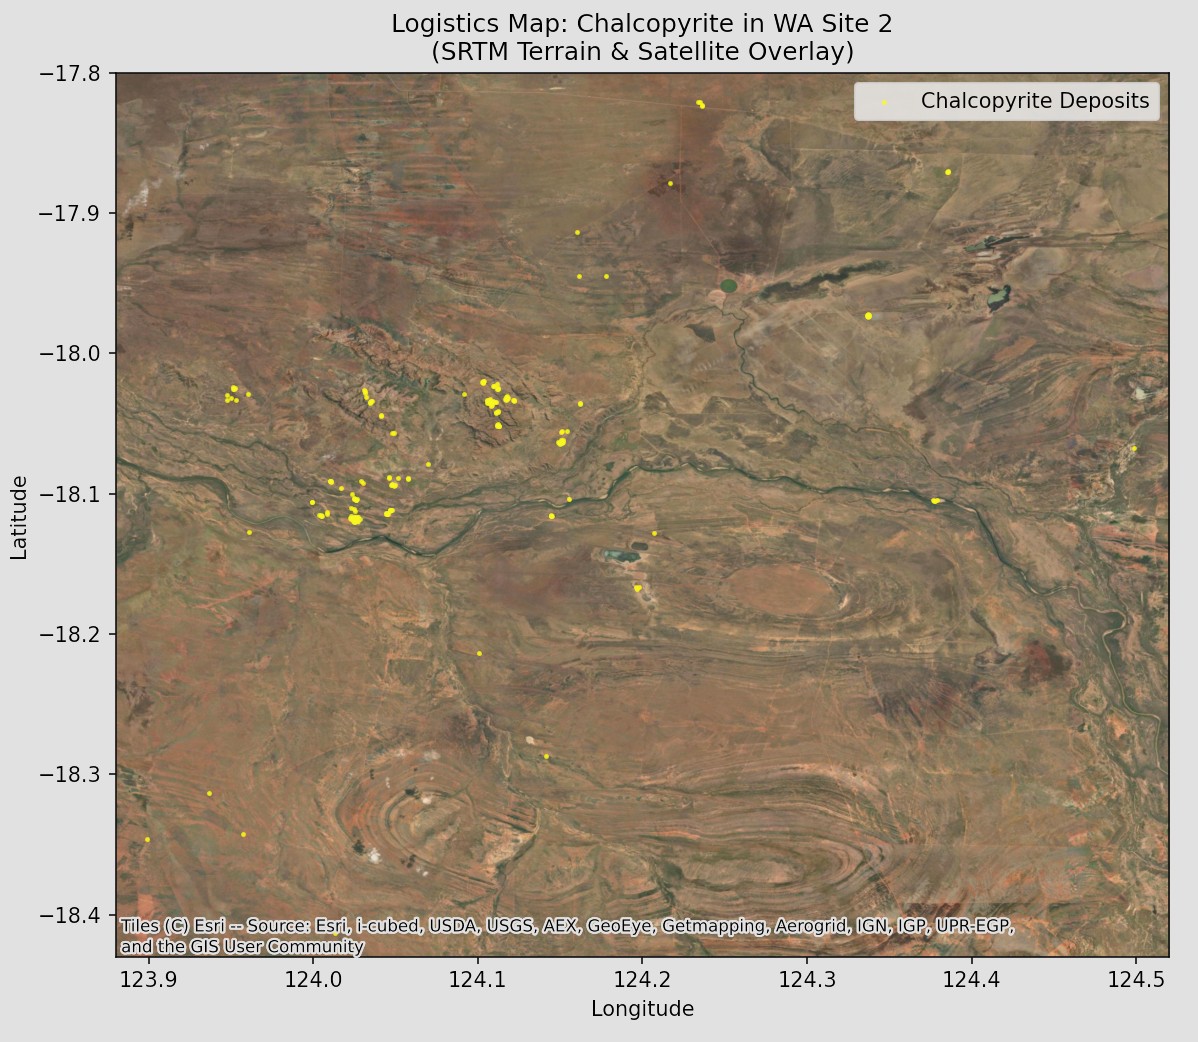
The Western Australia Sites where NASA spectral data was used.
-

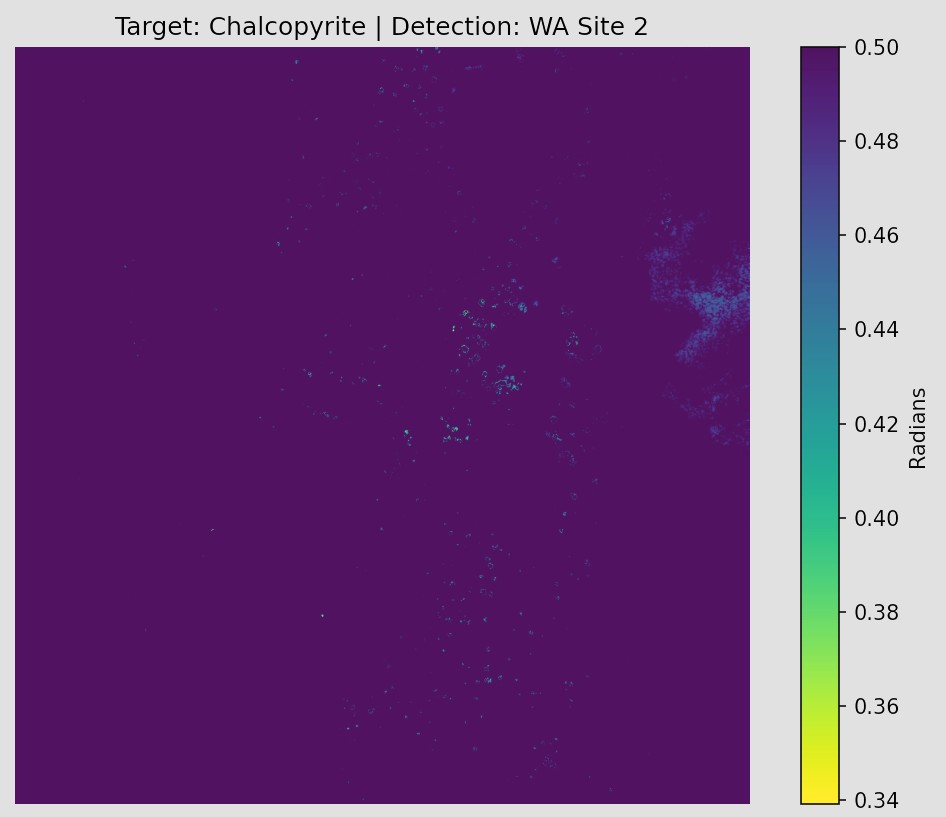
A Heatmap of minerals detected by spectral angel mapping.
-
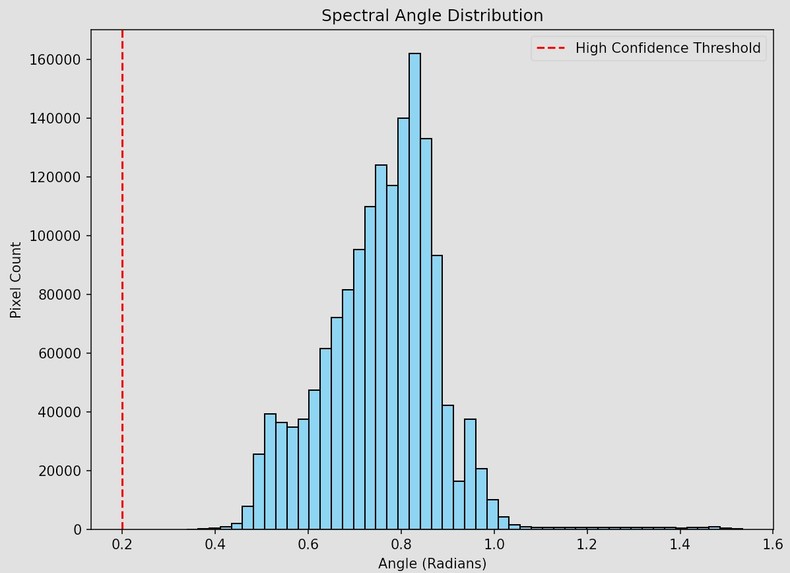
A Histogram of the spectral angel distribution, pixals past the confidence line are considered the detected mineral.
-

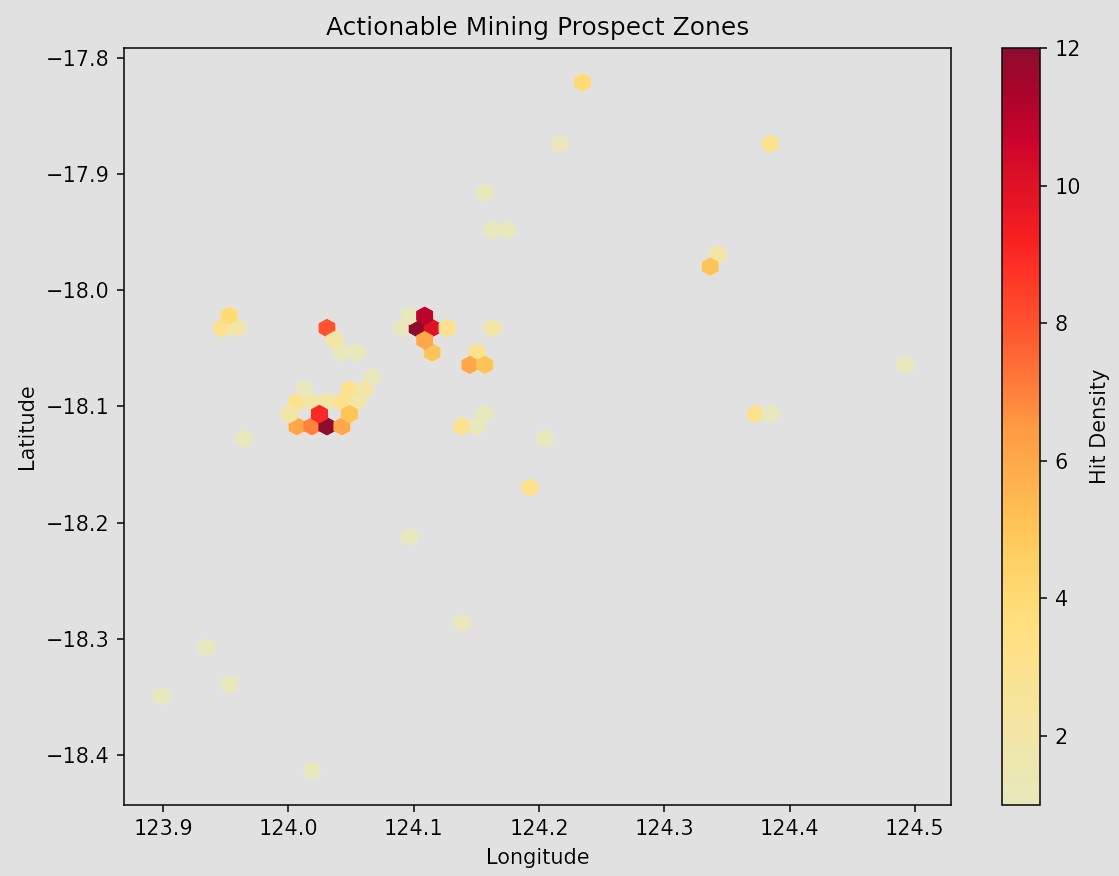
A Clustered Heatmap showing the largest concentrations of minerals.
-
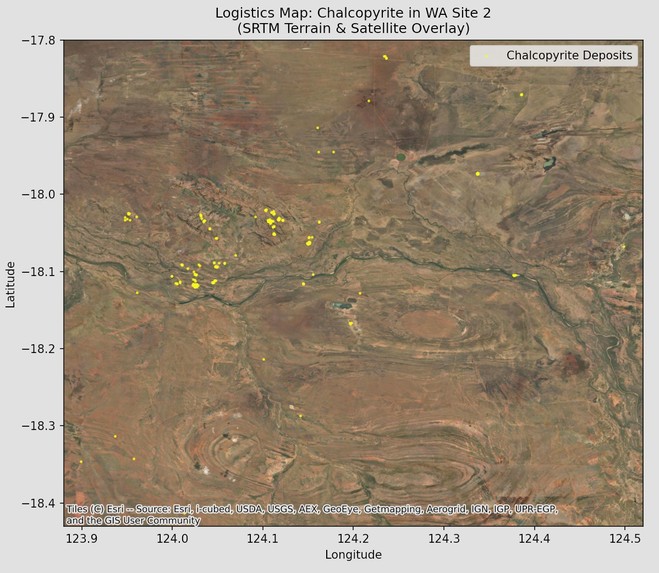
The Satellite Image of the area containing the detected minerals, yellow dots represent mineral clusters.
-
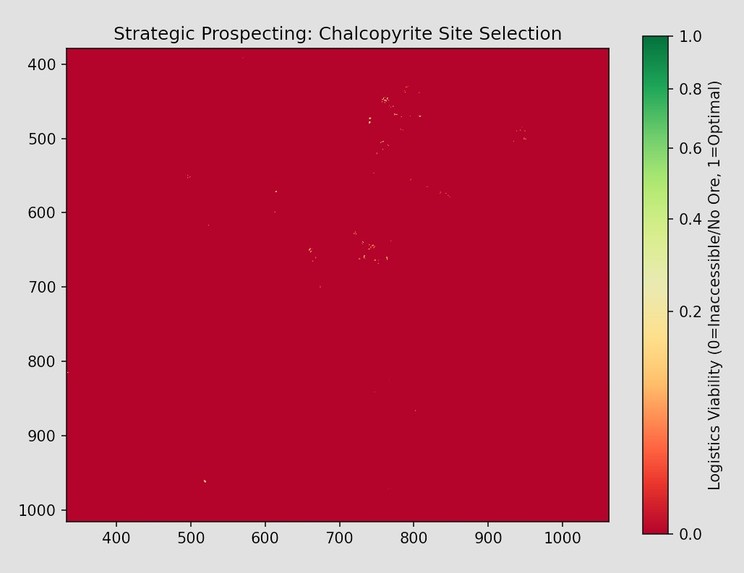
The Coloured Map showing the economically viable areas to access minerals: red means the ore is inaccessible or non-existant.


Inspiration
Our project was inspired by the Mars Reconnaissance Orbiter (MRO) and its CRISM instrument, which revolutionized our understanding of the Red Planet by mapping its chemical and mineralogical makeup from orbit. We realized that this same "galactic-scale" technology could be brought back to Earth to solve one of the most grounded problems in the Australian economy: the logistical and environmental uncertainty of mineral exploration. We wanted to harness the power of satellite technology to map the endless materials and chemistry that make up our own planet, providing a clear window into our natural resources.
What it does
Spectra-Logistics is an end-to-end decision engine that transforms raw hyperspectral data from the NASA EMIT mission into actionable economic intelligence. Our platform doesn't just identify "where" minerals like Hematite or Chalcopyrite are located; it calculates an Economic Viability Index. By fusing spectral signatures with high-resolution terrain data, we filter out inaccessible cliffs and low-yield zones to identify the Top Priority Extraction Targets in a given region, providing precise coordinates ready for immediate surveying.
Why we chose this project & its Impact
The motivation for Spectra-Logistics stems from a critical gap in the Australian resource sector: the "Discovery-to-Development" divide. While Australia is a global leader in mining, the traditional exploration process is resource-heavy, time-consuming, and often lacks transparency. We chose this project to democratize high-fidelity geological data, transforming it from a niche scientific output into a tool for broad economic and social empowerment.
Industrial & Economic Impact
For mining companies, the impact is a radical reduction in logistical risk. By identifying "Optimal Deployment Zones"—where high mineral grade overlaps with accessible terrain—we allow companies to bypass the millions of dollars usually spent on preliminary ground surveys in hostile or non-viable areas. This accelerates the timeline for bringing critical minerals (like those needed for the green energy transition) to market.
Community & Sovereign Impact
Beyond the industry, our tool provides a pathway for resource sovereignty. Governments and local communities often rely solely on data provided by private entities to understand the value of their land. Spectra-Logistics provides an independent, scientifically verifiable method for communities to know exactly what their resources are worth.
Environmental Stewardship
By integrating terrain analysis, our system naturally promotes a "lower-footprint" approach. By targeting the most accessible sites first, we reduce the need for extensive road-clearing and heavy-machinery disturbance in steep or sensitive environments. Furthermore, because the system is recalibratable, it offers the future ability to detect mineral leaks and track mining waste, ensuring that resource acquisition is as responsible as it is efficient.
How we built it
We developed a processing pipeline in Python that ingest NASA's NetCDF4 hyperspectral granules. We utilized Spectral Angle Mapping (SAM) algorithms to compare pixel-level reflectance data against the USGS Spectral Library. This was then integrated with SRTM (Shuttle Radar Topography Mission) data to calculate slope gradients. The frontend was built using Next.js and Tailwind CSS, featuring a custom dashboard that visualizes these data layers using Contextily for satellite overlays and Matplotlib for heatmaps, providing a seamless bridge between raw data and user-friendly logistics maps.
The Spectral Angle Mapper (SAM) Algorithm
To determine the mineral composition of a pixel, we treat the spectral data as vectors in \(n\)-dimensional space, where \(n\) represents the number of spectral bands. The algorithm calculates the spectral angle \(alpha\) between the pixel vector and the reference library vector. Because it measures the angle rather than the length, it is uniquely resistant to shadows and solar illumination differences—critical for the harsh lighting of the Australian Outback.The spectral angle $\alpha$ is calculated as: $$\alpha = \cos^{-1} \left( \frac{\sum_{i=1}^{n} t_i r_i}{\sqrt{\sum_{i=1}^{n} t_i^2} \sqrt{\sum_{i=1}^{n} r_i^2}} \right)$$ Where:
\(n\) is the number of spectral bands (wavelengths).
\(t\) is the spectral reflectance of the test pixel (the data from EMIT).
\(r\) is the spectral reflectance of the reference material (the USGS library signature).\
\(alpha\) is the spectral angle measured in radians.
Economic Viability Index (EVI)
To provide actionable logistics data, we then combined the spectral results with our terrain analysis to create a final score: $$\text{Viability Score} = \left( 1 - \frac{\alpha}{\alpha_{threshold}} \right) \times e^{-\left( \frac{\theta}{\theta_{scale}} \right)}$$ Where:
\(alpha\): The spectral angle from the SAM calculation.
\(theta\): The calculated slope of the terrain in degrees.
\(theta_{scale}\): A logistics decay constant (set to 15 based on standard modular loader constraints).
Challenges we ran into
One of the primary hurdles was the spatial alignment of disparate datasets. NASA EMIT data and SRTM terrain tiles operate at different resolutions and coordinate grids. We had to implement custom resampling and bilinear interpolation techniques to ensure our mineral "hits" lined up perfectly with the topographic ridges. We also faced significant "IndexErrors" and data-type mismatches when mapping 2D spectral grids back to real-world 1D coordinate vectors, requiring a robust, brute-force coordinate extraction logic to ensure GPS accuracy.
Accomplishments that we're proud of
We are incredibly proud of successfully bridging the gap between Remote Sensing and Economic Feasibility. Moving beyond simple "detection" to a weighted "Viability Score" means we have built a tool that speaks the language of both geologists and logistics managers. Additionally, the ability to extract high-precision GPS coordinates from millions of data points—and verify them against satellite imagery—is a major technical milestone for our team.
What we learned
This project gave us a deep dive into the complexities of Hyperspectral Imaging and the sheer scale of the data provided by missions like EMIT. We learned that data is only as good as its accessibility; high-fidelity science is useless to a community or a company if it isn't processed into a readable format. We also honed our skills in Full-Stack Data Science, learning how to handle large NumPy arrays in a way that remains performant within a web-based UI.
What's next for Spectra-Logistics
The next phase involves integrating Machine Learning models to automate the calibration of spectral thresholds, moving beyond manual SAM inputs. We plan to incorporate Vegetation Analysis (NDVI) to detect mineral leaks and environmental stress caused by mining waste. Moreover, we will incorporate AI to significantly improve the systems analysis and detection capability. Ultimately, we aim to build a "Smart Logistics" layer that considers nearby infrastructure, local weather patterns, and environmental protection zones, creating a comprehensive digital twin for responsible and efficient resource management.
Built With
- earth-surface-mineral-dust-source-investigation
- nasa-earthdata
- python
- shuttle-radar-topography-mission
- united-states-geological-survey


Log in or sign up for Devpost to join the conversation.