Inspiration
WebGL debugging is still a highly manual process. When a canvas turns black, a framebuffer becomes incomplete, a shader fails to compile, or rendering performance suddenly drops, developers usually have to move between browser console messages, source code, GPU captures, screenshots, and state inspection tools.
Spector.js already provides excellent low-level WebGL frame capture and inspection capabilities. However, its interface was designed primarily for humans. Code agents need a different abstraction: structured tools, concise evidence, deterministic diagnostics, reproducible workflows, and a reliable way to verify that a proposed fix actually worked.
That gap inspired spector-agent-mcp.
The goal was not to replace Chrome DevTools or rebuild browser automation. Instead, we wanted to connect Spector.js to AI coding agents through the Model Context Protocol and let it collaborate with Chrome DevTools MCP inside the same browser.
We imagined the debugging process as a closed loop:
[ \text{reproduce} \rightarrow \text{capture} \rightarrow \text{diagnose} \rightarrow \text{fix} \rightarrow \text{re-capture} \rightarrow \text{diff} ]
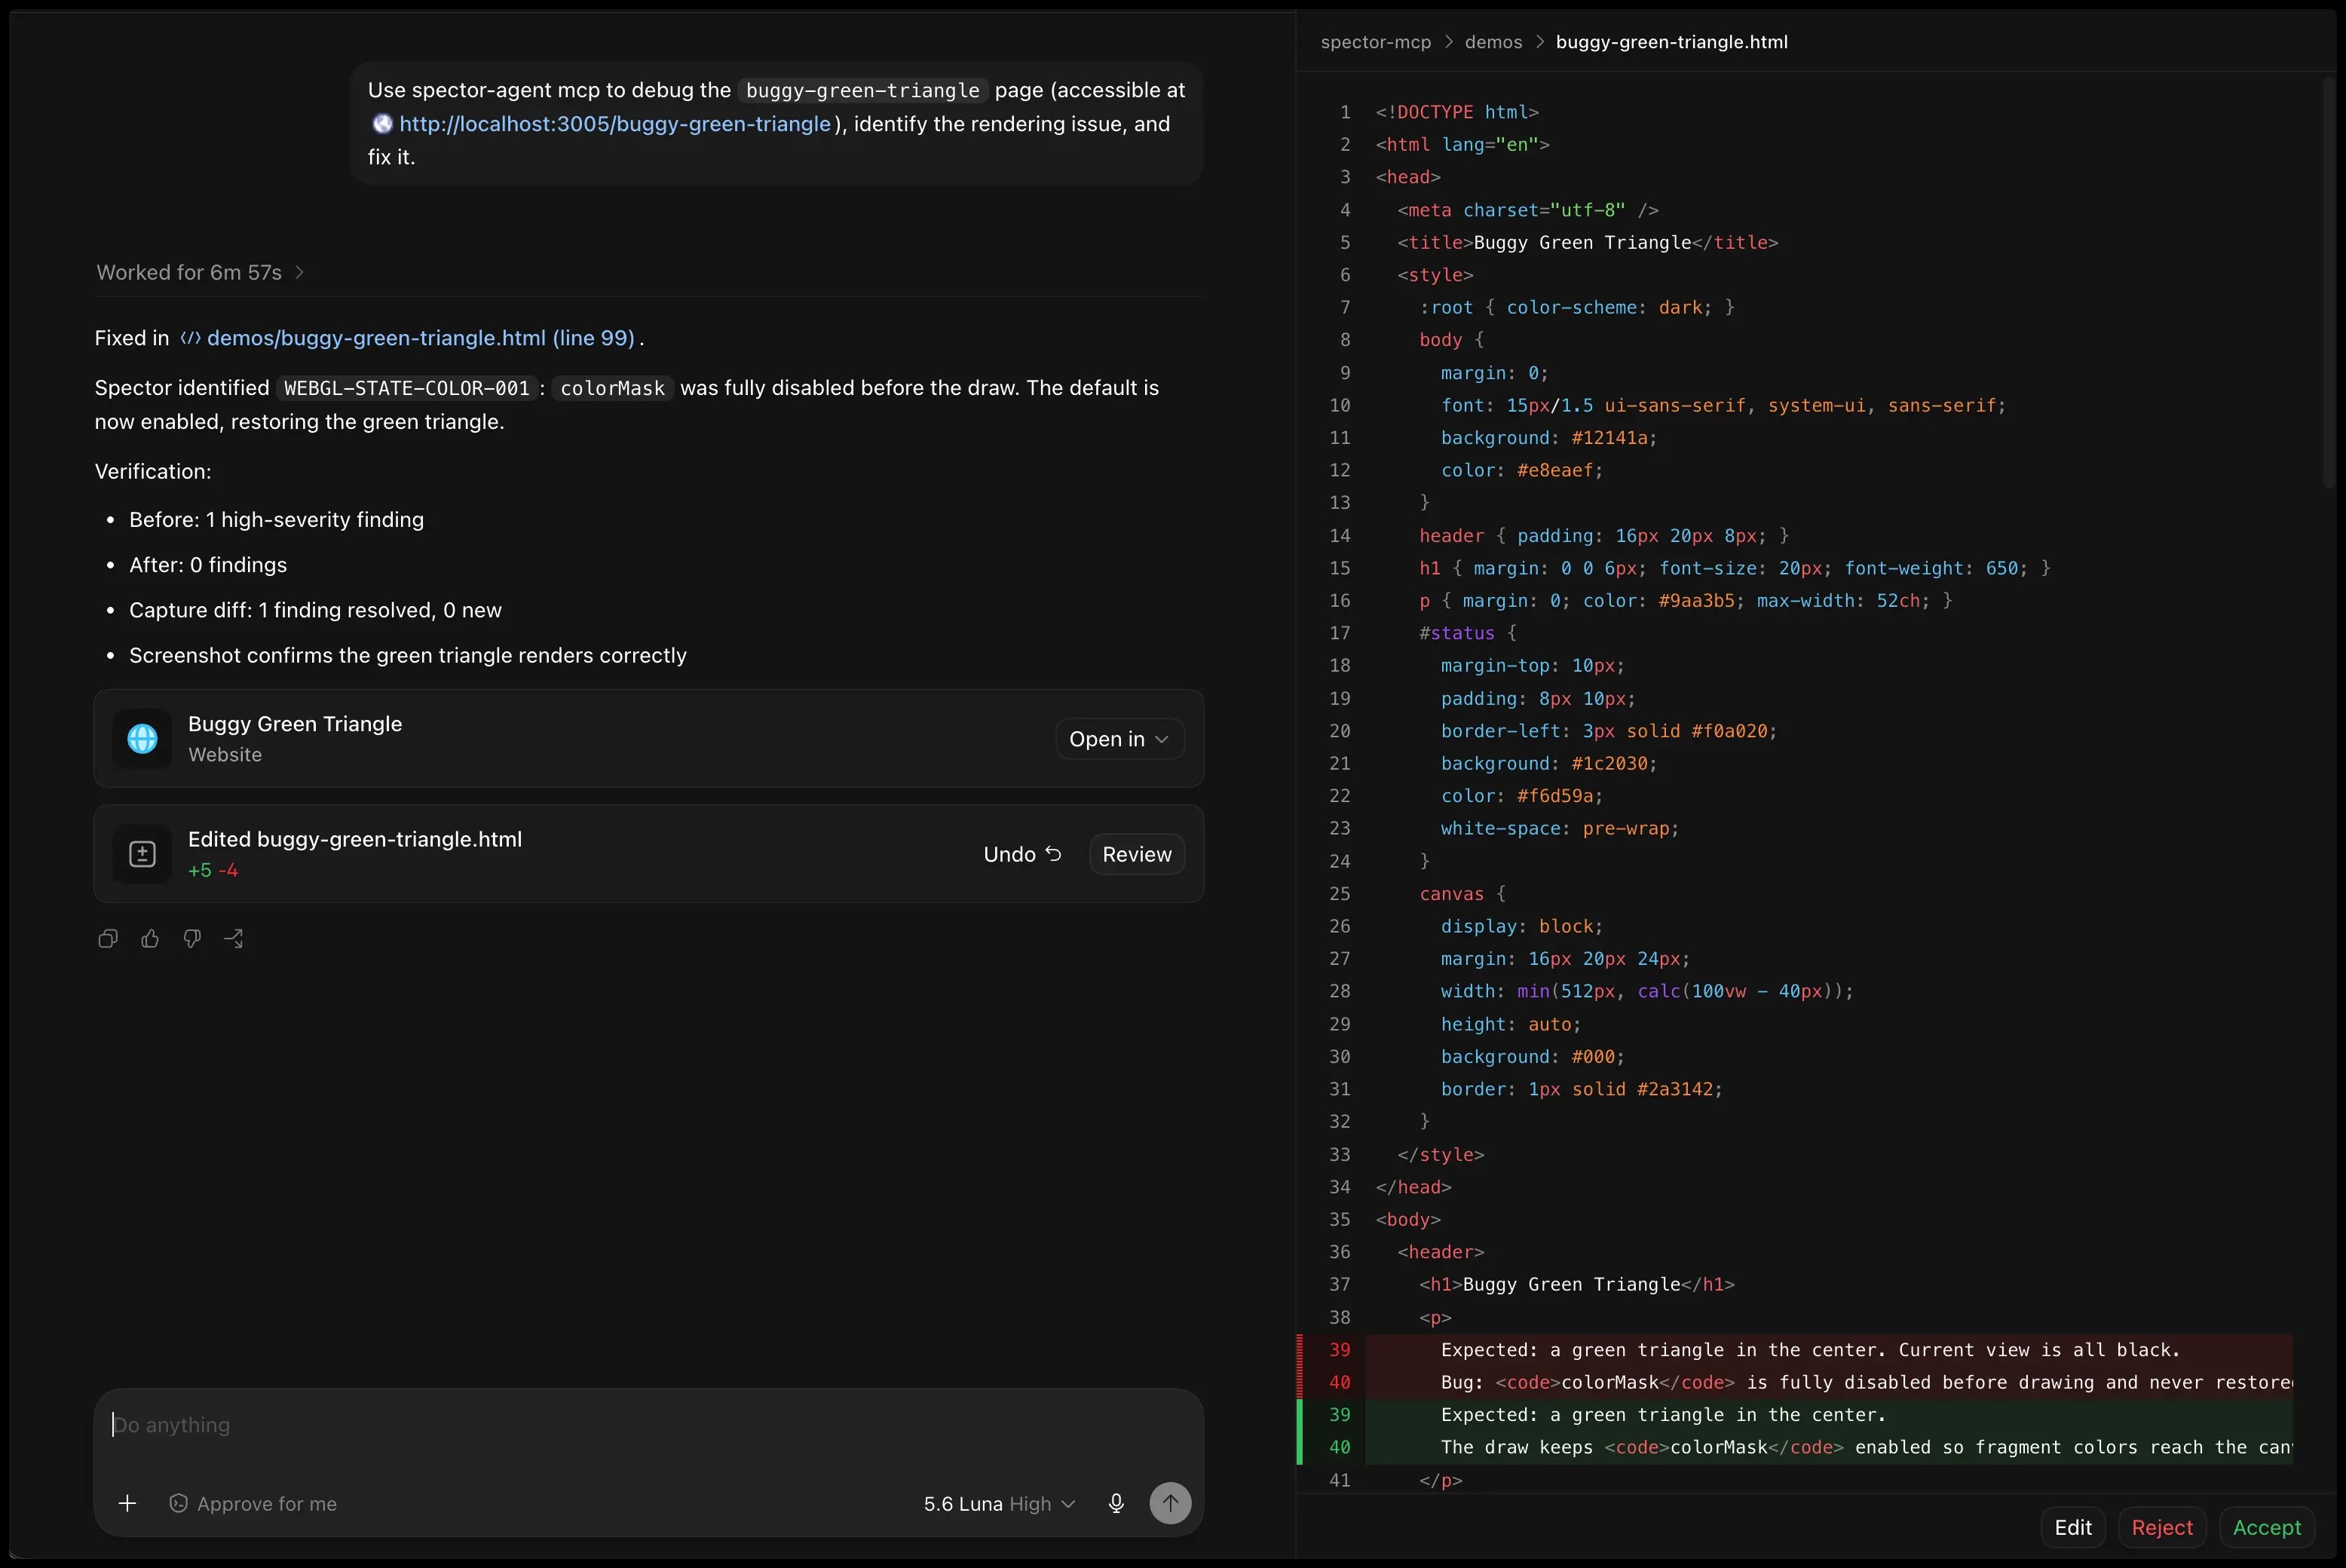
The agent should not merely suggest a possible fix. It should gather evidence, identify the relevant WebGL command or state, modify the workspace through its normal coding tools, and then verify the result with a second capture.
What it does
spector-agent-mcp is an AI-first MCP server for debugging WebGL 1 and WebGL 2 applications.
It attaches to a user-owned Chrome or Chromium instance through the Chrome DevTools Protocol, injects the Spector.js runtime into a selected page, captures WebGL frames, normalizes the capture data, runs diagnostic rules, and exposes the results through agent-friendly MCP tools.
The server supports several stages of the debugging workflow:
- Discovering browser targets and WebGL canvases
- Binding to the correct page using a shared
debugSessionId - Installing and checking the Spector.js runtime
- Capturing complete frames or a selected number of WebGL commands
- Adding markers and runtime logs around important rendering stages
- Reading buffered browser console output
- Inspecting draw calls, shaders, programs, textures, framebuffers, and state changes
- Persisting canvas and framebuffer attachment images
- Running deterministic
WEBGL-*diagnostic rules - Comparing captures before and after a code change
- Generating structured debugging reports
- Providing goal-driven debugging playbooks for coding agents
It includes rules for problems such as missing element array buffers, shader compilation failures, program linking failures, incomplete framebuffers, mismatched framebuffer dimensions, invalid viewports, illegal WebGL 1 texture configurations, disabled color masks, leaked depth state, empty scissor regions, redundant state changes, and large per-frame texture uploads.
The project is designed to work alongside Chrome DevTools MCP. Chrome DevTools handles navigation, interaction, screenshots, console inspection, and reproduction steps. spector-agent-mcp focuses on WebGL capture, GPU-state evidence, diagnostics, and verification.
How we built it
We built the project as a TypeScript and Node.js monorepo managed with pnpm.
The internal architecture is separated into focused packages:
- The CLI package provides stdio and Streamable HTTP MCP transports.
- The server package registers MCP tools, prompts, and resources.
- The CDP package manages browser connections, targets, stack parsing, and source-map extension points.
- The runtime package injects Spector.js and communicates with the page.
- The capture-model package converts raw Spector.js output into normalized types.
- The analyzer package generates summaries, executes rules, searches captures, and produces semantic diffs.
- The capture-store package persists captures, indexes, and visual attachments.
- The viewer package provides optional capture inspection.
- The test-fixtures package contains intentionally broken WebGL pages.
Although these boundaries remain separate during development, the root build bundles them into one publishable spector-agent-mcp CLI package.
For browser collaboration, both MCP servers attach to the same Chrome remote-debugging endpoint. To avoid selecting the wrong tab, Chrome DevTools MCP writes a generated debugSessionId into the page. spector-agent-mcp then searches for that marker and binds to the matching CDP target.
Target selection follows a conservative priority order: explicit target ID, shared debug-session marker, exact URL and title, URL pattern, or the only remaining page candidate. When multiple candidates remain, the server returns them instead of guessing.
Inside the page, Spector.js captures the WebGL command stream and visual state. Capture data is transferred back through the CDP bridge, normalized, summarized, and stored locally. Diagnostic rules then analyze this normalized model rather than relying on the language model to interpret an enormous raw JSON payload.
We also created a Skill Pack containing specialized workflows for black screens, shader failures, framebuffer and texture problems, state corruption, geometry issues, performance regressions, framework-specific debugging, and fix verification.
Finally, we added intentionally broken WebGL fixtures and evaluation scenarios. Each scenario maps a realistic debugging request to expected rule IDs and verification evidence, helping us test the complete agent workflow rather than only individual functions.
Challenges we ran into
One major challenge was coordinating two MCP servers without creating a fragile MCP-to-MCP communication layer. Both servers needed to operate on the same page, but URL-based target selection became ambiguous as soon as several tabs had similar addresses. The shared debugSessionId protocol solved this by using the page itself as the collaboration boundary.
Another challenge was capture fidelity. Spector.js has different quick and full capture modes, and quick captures do not include all visual-state screenshots. Late runtime injection can also miss information that was created before Spector began spying on the WebGL context. We had to connect thumbnail requests to the correct capture mode, persist visual attachments separately, and document where early injection is still required.
Raw captures can be extremely large. Sending complete command streams, shader sources, textures, stacks, and state objects directly into an AI conversation would be slow, expensive, and difficult for an agent to reason about. We therefore designed summary-first APIs that let agents begin with findings and overviews, then request specific draw calls, programs, resources, or state transitions only when necessary.
Diagnostic design was another challenge. Some WebGL failures are deterministic, while others require application-specific reasoning. We separated these responsibilities:
- Rules report observable facts.
- The agent forms hypotheses.
- Workspace tools apply code changes.
- Capture diffs verify the result.
Security also required careful attention because a CDP connection can control an entire browser. The server defaults to loopback-only endpoints, explicit host and origin allowlists, bounded capture storage, authenticated HTTP sessions, and no generic page-evaluation tool unless the user explicitly enables it.
Accomplishments that we're proud of
We are proud that the project provides an evidence-driven WebGL debugging loop instead of stopping at generic recommendations.
The same browser can now be used for normal DevTools interaction and low-level Spector.js capture without launching a second automated browser. Agents can reproduce a rendering problem, bind to the exact tab, capture the failing frame, inspect the relevant resources, apply a fix, and compare the result.
The diagnostic engine currently covers a broad range of WebGL correctness, state, resource, compatibility, and performance problems. These rules produce stable identifiers such as WEBGL-DRAW-002, WEBGL-FBO-001, and WEBGL-STATE-COLOR-001, making findings easier to test, document, and compare.
We are also proud of the project’s visual-evidence support. Canvas screenshots and framebuffer attachments can be persisted and inspected alongside command and state data, which is especially useful when the final image does not reveal where an offscreen rendering pass failed.
The fixture and evaluation system is another important accomplishment. It includes realistic failures such as missing index buffers, shader errors, framebuffer mismatches, incomplete mip chains, invalid non-power-of-two textures, leaked depth masks, empty scissor rectangles, context loss, redundant state changes, and repeated texture uploads.
Finally, the project is distributed as a single package that can run through npx, while still preserving a maintainable internal architecture. It supports both local stdio clients and isolated, bearer-authenticated Streamable HTTP sessions.
What we learned
We learned that AI debugging tools need different interfaces from human debugging tools. A human can explore a large graphical interface, but an agent works better with concise summaries, stable identifiers, explicit evidence, and progressively disclosed details.
We also learned that browser target identity is more important than browser target discovery. Finding a list of pages is easy; ensuring that multiple tools are operating on exactly the same page is the real coordination problem.
Capture timing matters as much as capture configuration. A perfectly designed analysis pipeline cannot recover data that was never observed because instrumentation was injected too late.
Another lesson was that deterministic analysis and probabilistic reasoning should complement each other rather than compete. Static rules are excellent at identifying concrete conditions such as a missing element buffer or a disabled color mask. Agents are better at connecting those findings to application architecture and deciding how the source code should change.
Most importantly, we learned that verification must be part of the debugging workflow. A plausible patch is not enough. The agent should reproduce the same scenario, create another capture, and demonstrate that the original finding disappeared without introducing new regressions.
What's next for spector-agent-mcp
The next phase will focus on deeper capture fidelity, stronger source mapping, and broader runtime support.
Planned improvements include:
- Persisting screenshots for draw-call input textures more reliably
- Supporting raw visual pixels in addition to encoded attachment images
- Automatically discovering and resolving source maps under safe allowlist rules
- Adding proactive WebGL error sampling through mechanisms such as
getErrorinstrumentation orKHR_debug - Improving early-injection detection
- Supporting Worker, OffscreenCanvas, and WebXR rendering scenarios
- Adding pixel-level before-and-after comparison, potentially including metrics such as SSIM
- Expanding framework-specific adapters and diagnostic rules
- Adding dedicated CLI subcommands for capture and diff workflows
- Growing the fixture library and regression evaluation suite
The long-term vision is for WebGL debugging to become a repeatable engineering workflow that an agent can execute with the same discipline as a developer: collect evidence, isolate the failure, make the smallest justified change, and prove that the rendering result improved.


Log in or sign up for Devpost to join the conversation.