Inspiration
I watch a lot of esports but it always feels a bit alien when the casters start talking through what they expect the next pick or ban to be. I wanted to actually see the stats behind that to understand who is picking what and the common synergies so it makes more sense.
I also thought trying to find common patterns in Valorant setups sounded really cool. Knowing exactly where someone is going to be or how they use their abilities completely changes how I would play the game, so I wanted to build something that makes those patterns visible.
What it does
Spector is a scouting tool for Valorant and League of Legends that turns match data into visual strategy.
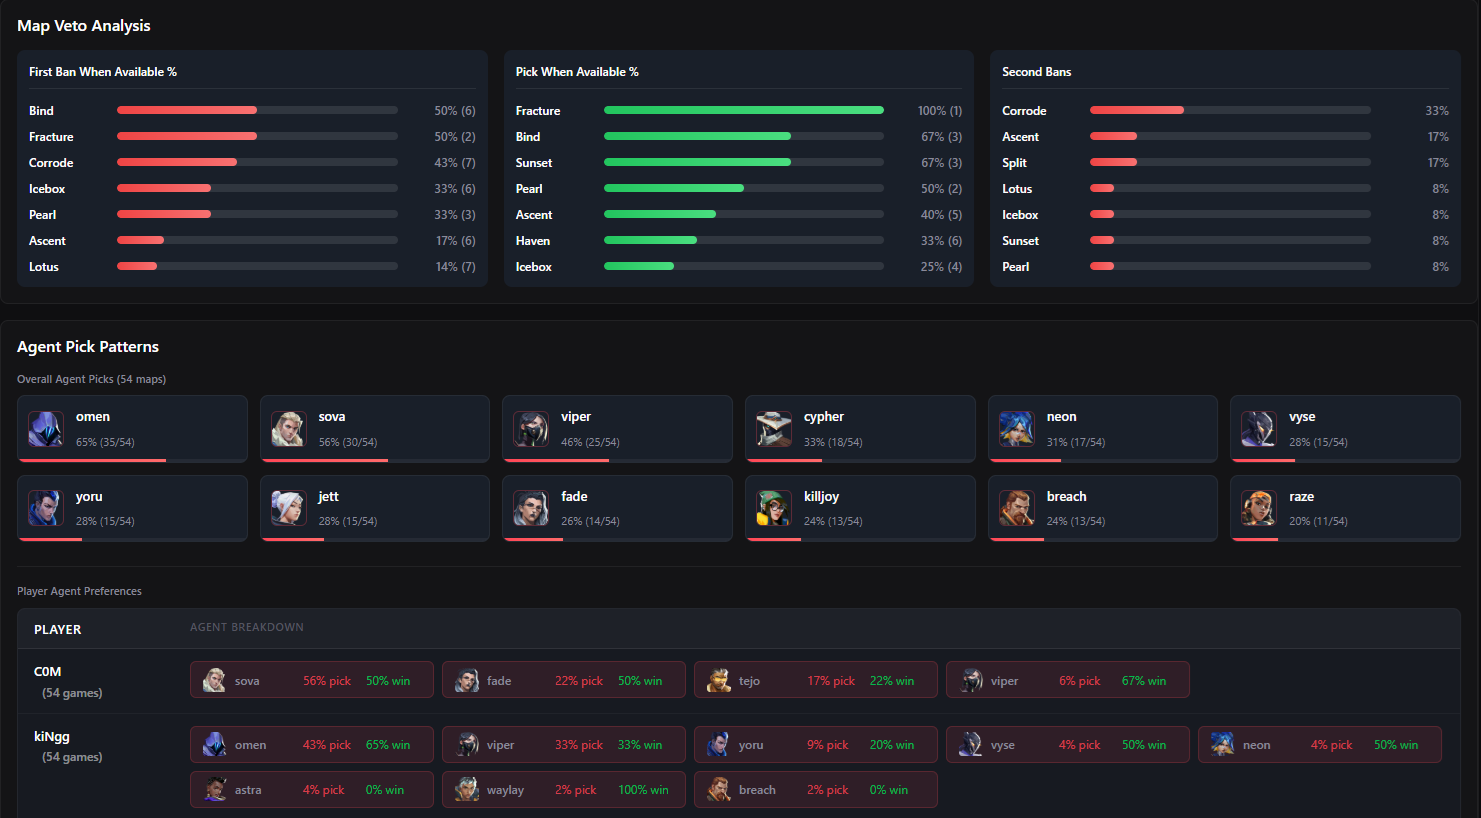
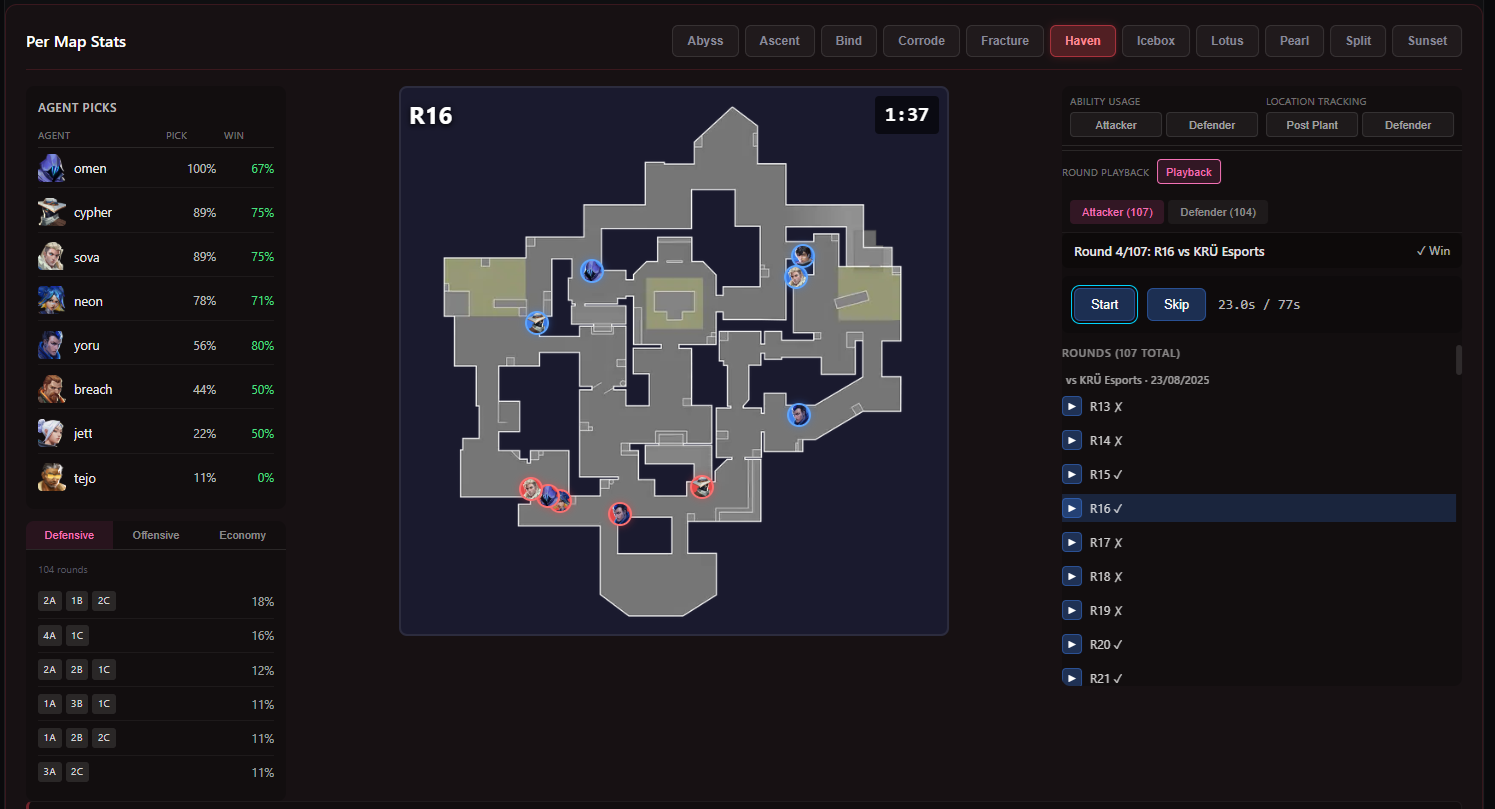
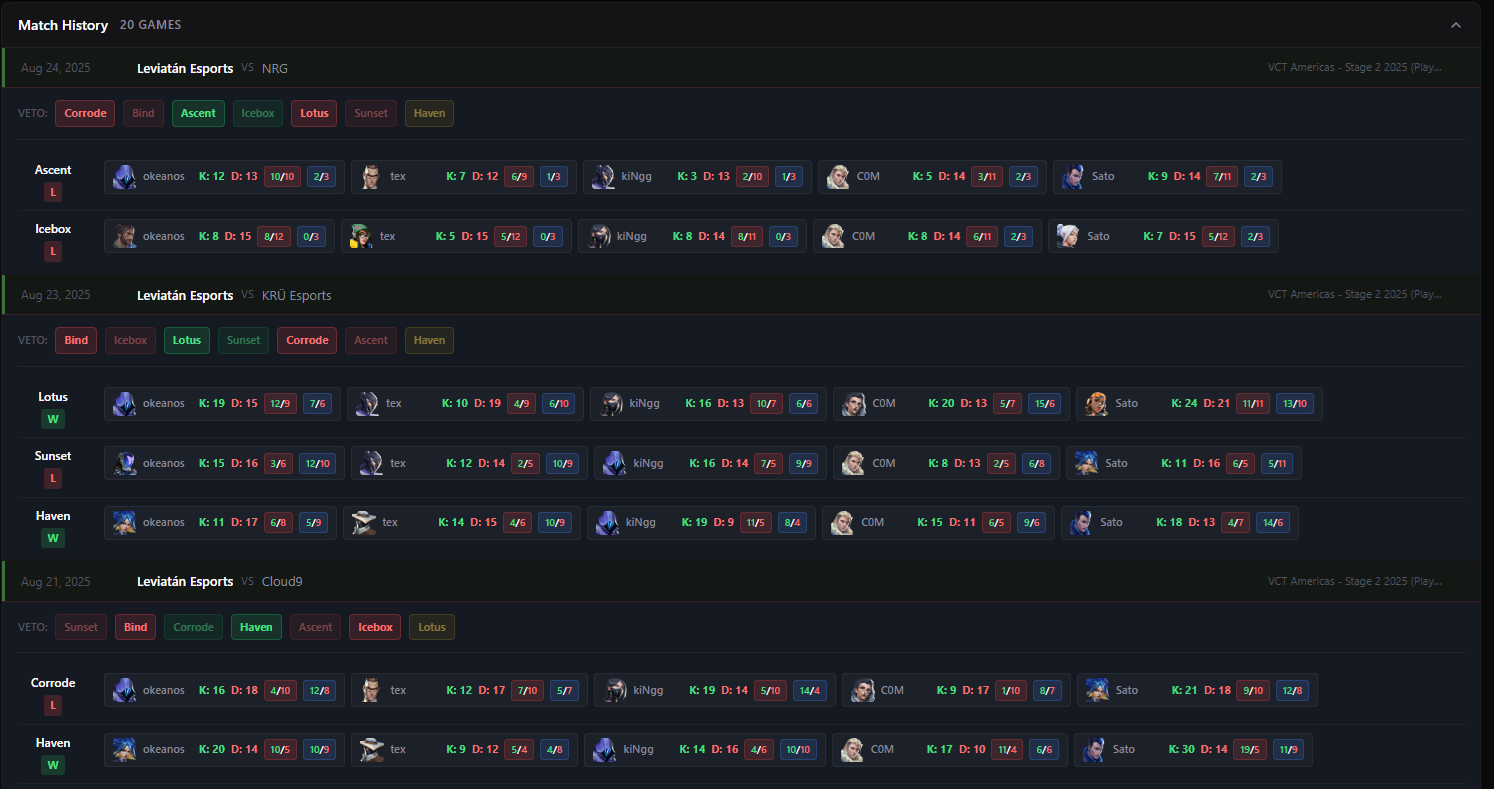
For Valorant, it is all about the map. Instead of just showing a list of kills, it visualizes the actual gameplay. You can see heatmaps of where teams hold sites, where they plant the spike, and catch patterns like lurkers. It also simplifies the map veto process because you can immediately see what maps a team prioritizes or bans, and exactly what agent composition they are likely to run on those maps. You can even track common ability usage patterns so you know exactly where to watch out for incoming utility.
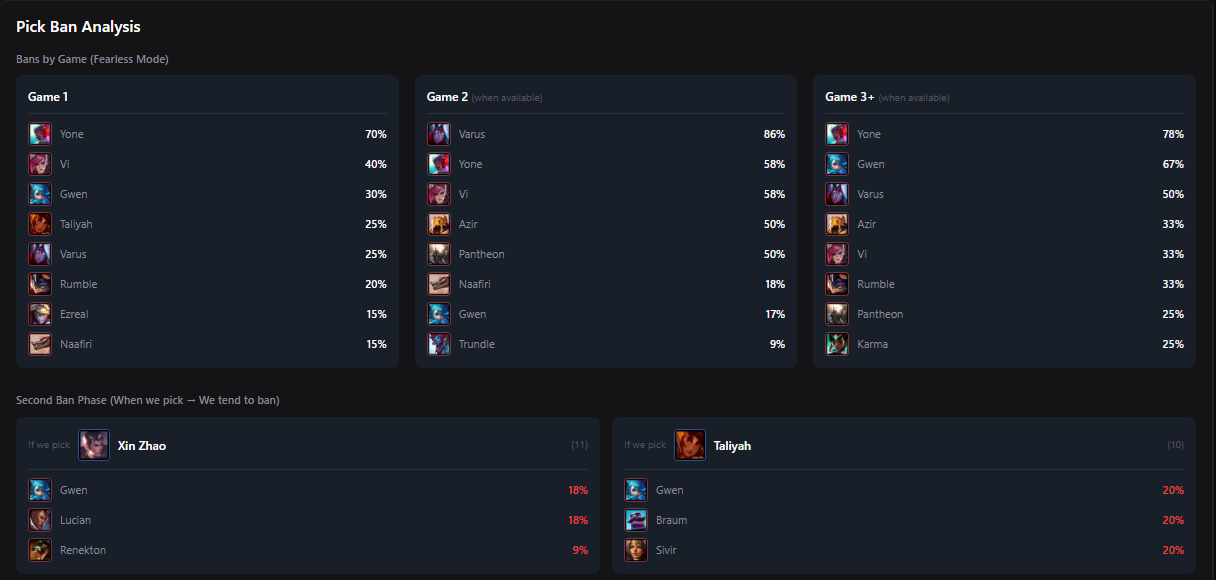
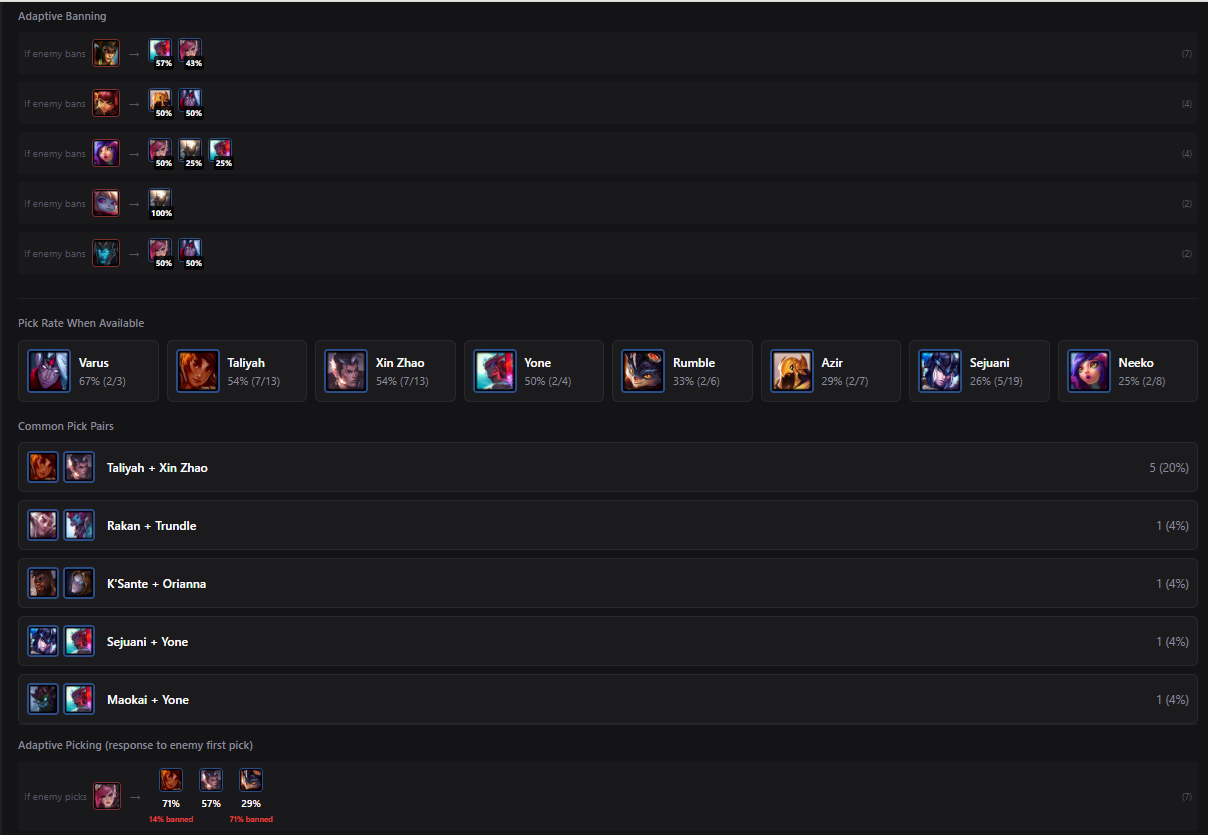
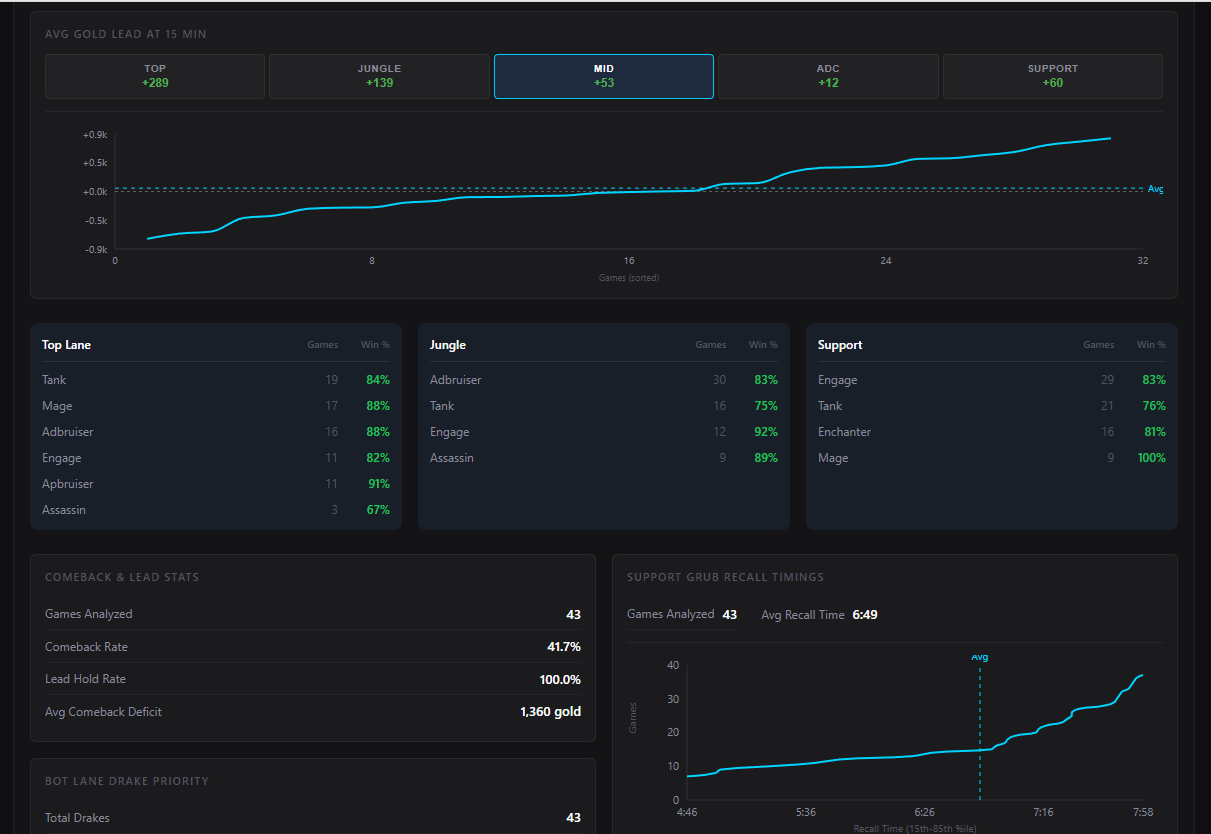
For League, it focuses on the draft and tracks pick and ban habits to show a team's playbook. It also breaks down the match history to show stats on who commonly gets ahead and why, along with how the team prioritizes early objectives like dragons or void grubs.
The coolest part is definitely the Round Playback where you can watch a 2D replay of the dots moving around the map to see exactly how a team rotates in real time.
How we built it
I built the app using Next.js 14 and TypeScript. The core data comes from the GRID Esports API which sends over super granular details like player location every few milliseconds.
I wrote a bunch of custom scripts to parse that massive amount of data into actual game concepts, like grouping up similar coordinates to determine they're in a common position. For the visualization, I had to build custom React components that overlay the data onto the game map images. I actually used JetBrains Junie to help come up with the complex algorithms needed to convert the raw coordinates into accurate positions on top of the 2D map where every map is scaled slightly differently. Vercel Blob handles the storage so the reports load fast.
Challenges we ran into
The biggest headache was definitely the coordinate mapping. The API gives you raw x and y coordinates from the game engine, but getting those to line up perfectly on a flat 2D image in the browser was surprisingly hard. I had to do a lot of calibration to make sure a player standing at Long A actually showed up on Long A on the screen.
It was also really hard to parse the huge data objects I got from the API. I had to figure out how to break down massive JSON files into much smaller, usable data snippets that the frontend could actually use without crashing.
Accomplishments that we're proud of
Getting the Interactive Map Player to work was the highlight for me. It was really satisfying to write the logic that takes static numbers and turns them into moving dots that represent a real match.
Seeing it actually work for the first time and watching the dots rotate and react just like the pro players did was a really cool moment. It went from being a fun experiment to something that could actually be useful.
What we learned
I learned that working with raw data is surprisingly hard. The API gives you absolutely everything, so a huge part of the project was figuring out how to convert that massive stream of information into a simpler format that is actually useful for a human to read.
I also learned a lot about how to present data. It is a really difficult balance to make the interface dense enough to show everything important without being overwhelming. I had to figure out how to make the stats actually useful for a player rather than just showing a confusing wall of numbers.
What's next for Spector - A Valorant and League of Legends Scouting Tool
I want to come up with more predictive patterns. For Valorant, the goal is to figure out how opponents will play future rounds based on common patterns they showed in earlier rounds. For League, I want to find more useful patterns in how players play the game to identify opportunities to win, like calculating the best win conditions based on team comps or figuring out the specific win conditions needed to beat certain teams.
Built With
- nextjs
- typescript

Log in or sign up for Devpost to join the conversation.