-
 GIF
GIF
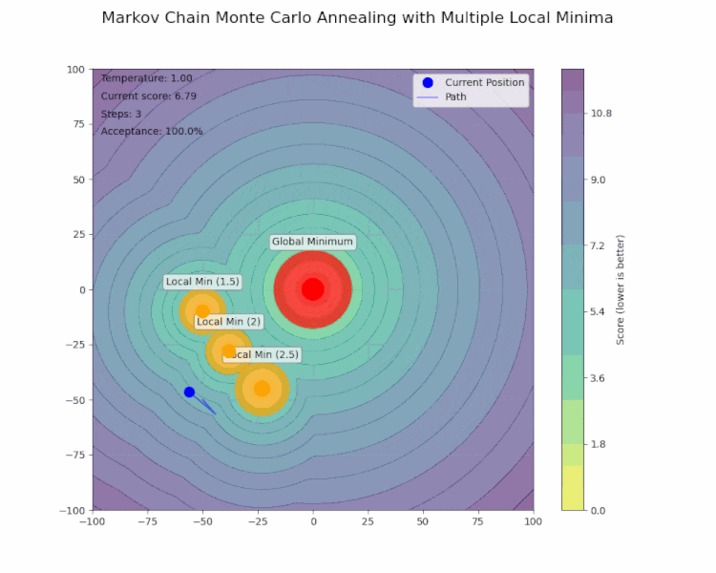
Basic Example of Markov Chain Monte Carlo Annealing
-

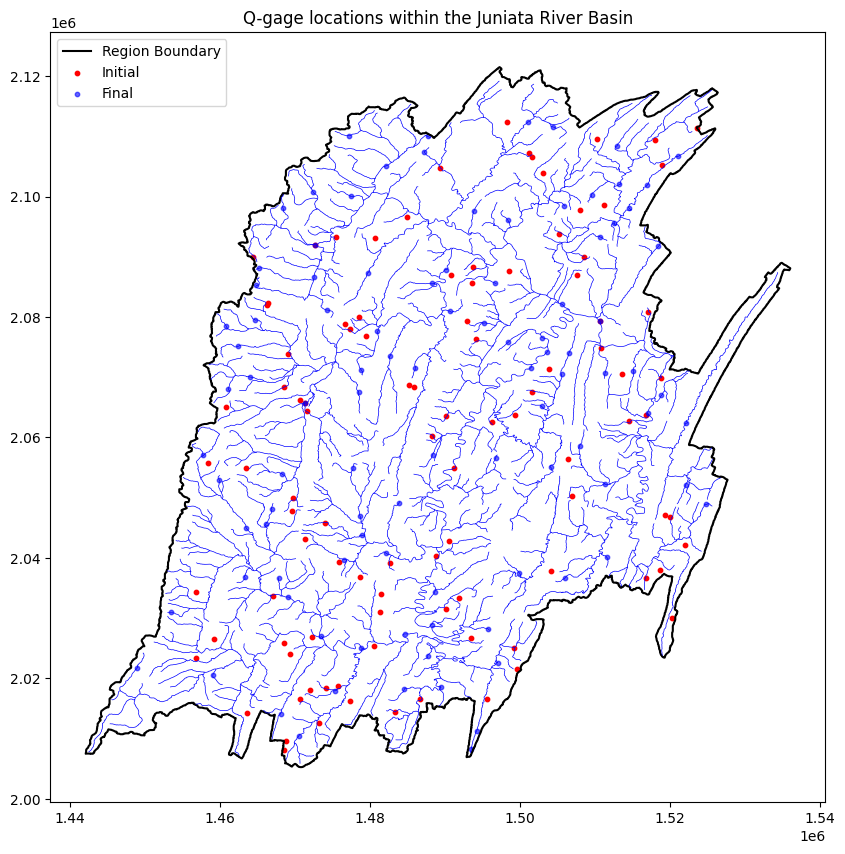
Before and After Gauge Optimization (initial gauges are placed randomly)
-

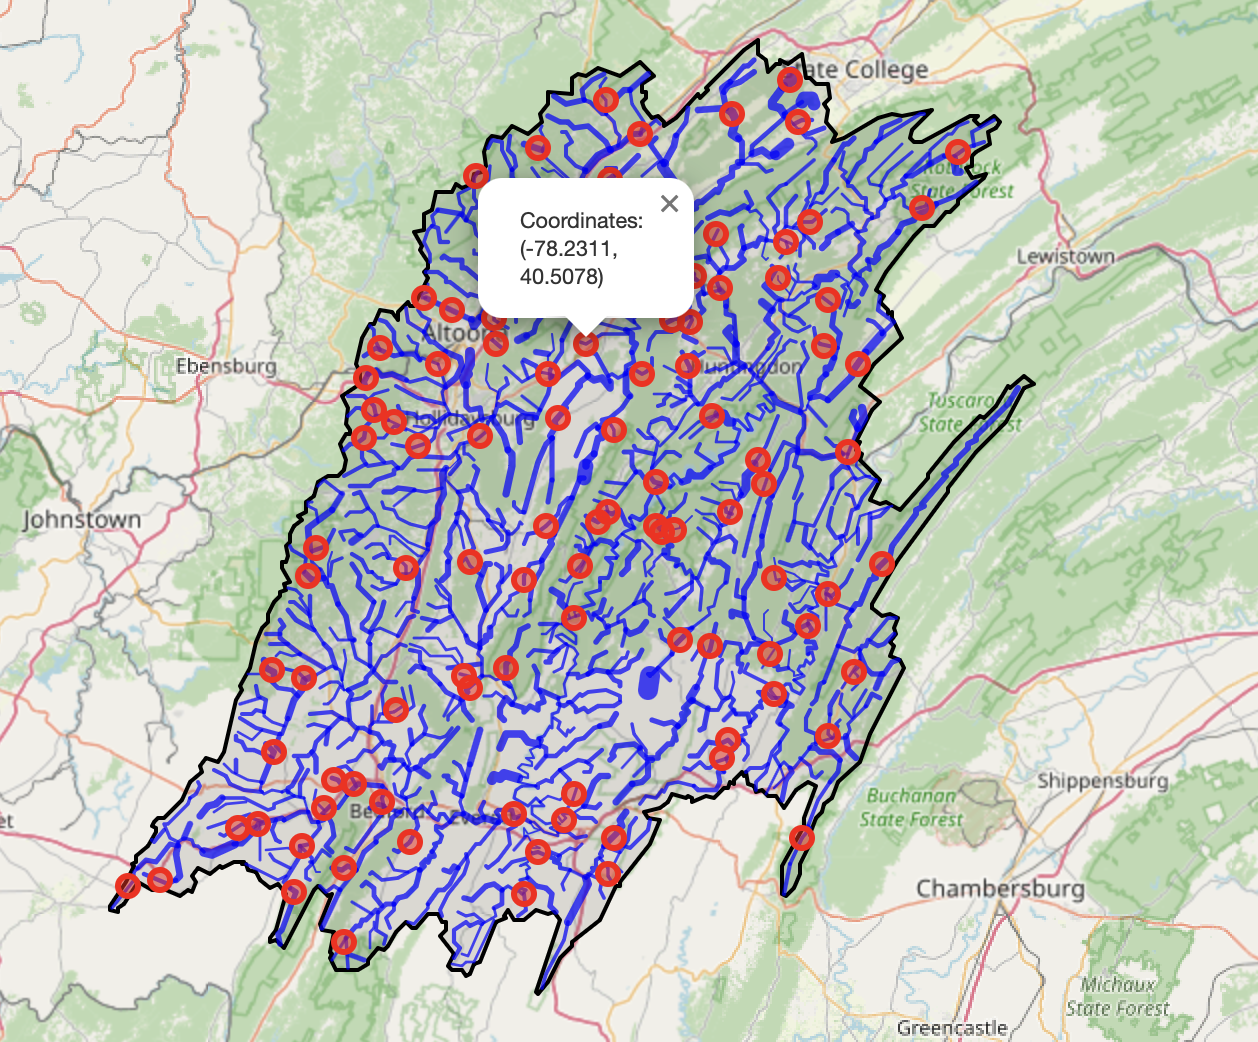
Optimal Gauge Placement
-

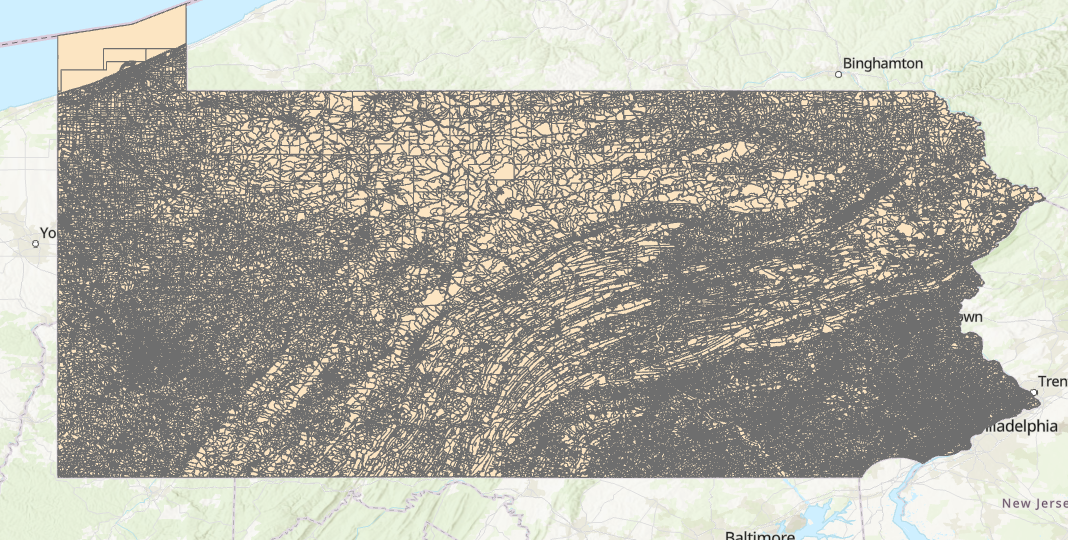
Census Block Data used for redistricting example
-
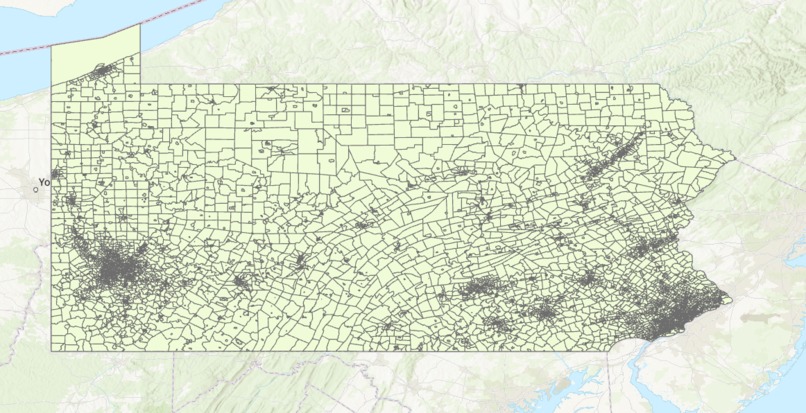
Voting Precinct Data used for redistricting example
-
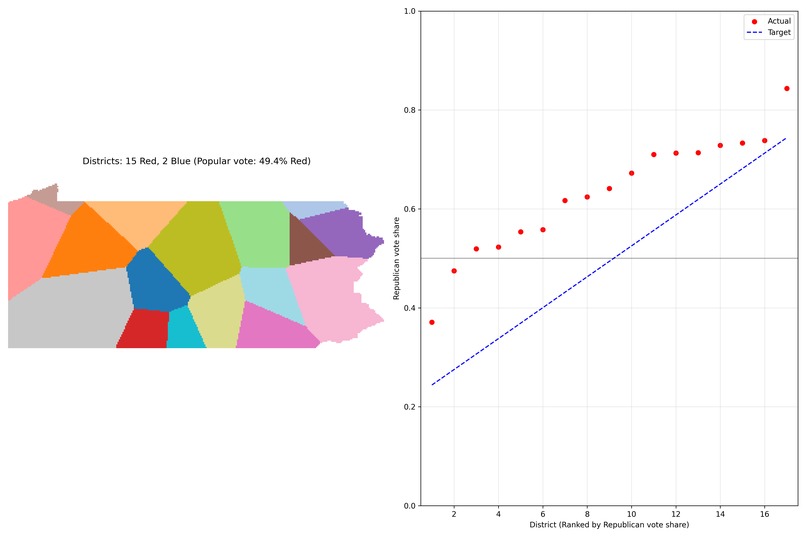
Before Redistricting Fair Metric
-
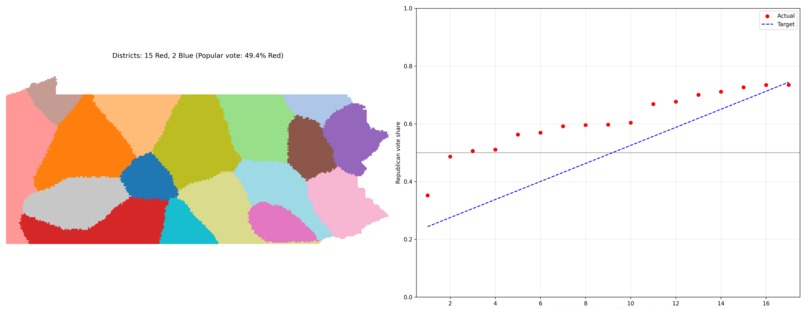
After Redistricting Fair Metric


Inspiration
We wanted to demonstrate that simple, clever ideas still have their place in a world increasingly focused on complex, powerful, and expensive AI solutions. Markov Chain Monte Carlo Annealing (MCMCA) isn't new or incredibly complex, but it remains powerful and effective.
We demonstrate this with two examples.
(1) In hydrology, streamflow gauge placement has long been considered more art than science. Our example demonstrates a basin-scale solution for determining the appropriate locations for gauges using quantitative methods rather than subjective judgment.
(2)Redistricting is often a politically fraught activity. Using a simple and fair algorithm could both produce more equitable results and remove opportunities for political manipulation, bringing transparency to a process that affects democratic representation.
What it does
We've created a generic package that aids in the construction and implementation of MCMCA methods. It works with simple algorithms (like our bullseye animation example) as well as complex implementations. The package features a staging mechanism making it easy to optimize multi-dimensional cases.
We built two example applications:
- A hydrology gauge placement optimizer that uses various geophysical metrics to optimally locate any desired number of gauges across the 8,800 square-kilometer Juniata river basin.
- A redistricting optimization tool that balances compactness, parameter-area ratio, and equal population distribution.
How we built it
The package incorporates several high-level optimizations to ensure efficient performance across a variety of applications. One key example is the mathematical modeling of temperature, which leverages a nonlinear exponential function. This approach enables non-linear Gaussian sampling to produce results that are relatively linear in behavior, while avoiding the computational overhead of fully linear optimization. As a result, the scaling remains consistent, providing both accuracy and efficiency in diverse scenarios.
For the redistricting application, we obtained precinct shapefiles from Harvard's political database for 2020 along with 2020 census data. We applied a downscaling method that assumes uniform distribution across small precincts and census blocks to produce a square grid mesh of Pennsylvania, which serves as the foundation for our optimization.
Challenges we ran into
Time constraints presented our biggest challenge. When an algorithm needs 2 hours to run for testing, development becomes extremely difficult within a 24-hour hackathon timeframe.
Some of the major problems came from the complexity of the optimization of redistricting and gage placement, and the need to speed up the algorithm it became clear early on Numba optimization need to be able to run enough simulations which met we only ever knew the state of the single pixel and its neighbors. So, for this means detecting if a pixel is disconnected or in fractal is incredibly difficult. We ended using a two-prong approach of small branching BFS tree of neighboring pixel and a front-end optimization to pixel selection by weight pixels with more neighbor higher.
Accomplishments that we're proud of
We were able to demonstrate a better method for placement of river streamflow gauges on a basin scale. Both coming from a hydrology background, we are acutely aware of the importance of streamflow gauges for flood detection, hydropower production and river management. The USGS places roughly 100 new gauges every year, and optimal gauge placement can be the difference between almost a day of warning for floods and just a few hours. Yet methods for placement are often determined by antiquated approaches.
Although the redistricting example is not fully optimized to produce ideal results, the current version of the algorithm is working toward an optimal solution and is very efficient given the immensity of the data.
What we learned
We developed skills for creating Python packages and integrating animations. We learned to simplify our problem goals and discovered that simple solutions can be powerful when implemented thoughtfully.
What's next for SpatialForge
We plan to expand the functionality of the package and further develop our examples. We're considering writing a white paper and pitching our gauge selection implementation to the USGS to improve and inform their placement methodology.
Note: Many of our animated gifs couldn't be compressed to under 5 MB, so we'll be showcasing more of our algorithms during the judging expo.


Log in or sign up for Devpost to join the conversation.