Inspiration
Global supply chains are notoriously complex non-linear systems where a minor bottleneck in one corridor can trigger catastrophic cascading failures worldwide. Recent geopolitical events and maritime route disruptions have made it clear that existing static modeling tools are insufficient. We were inspired to build a high-performance, real-time spatial simulator that can predict port congestion, bottleneck propagation, and trade route re-routing dynamics as disruptions unfold across the globe.
What It Does
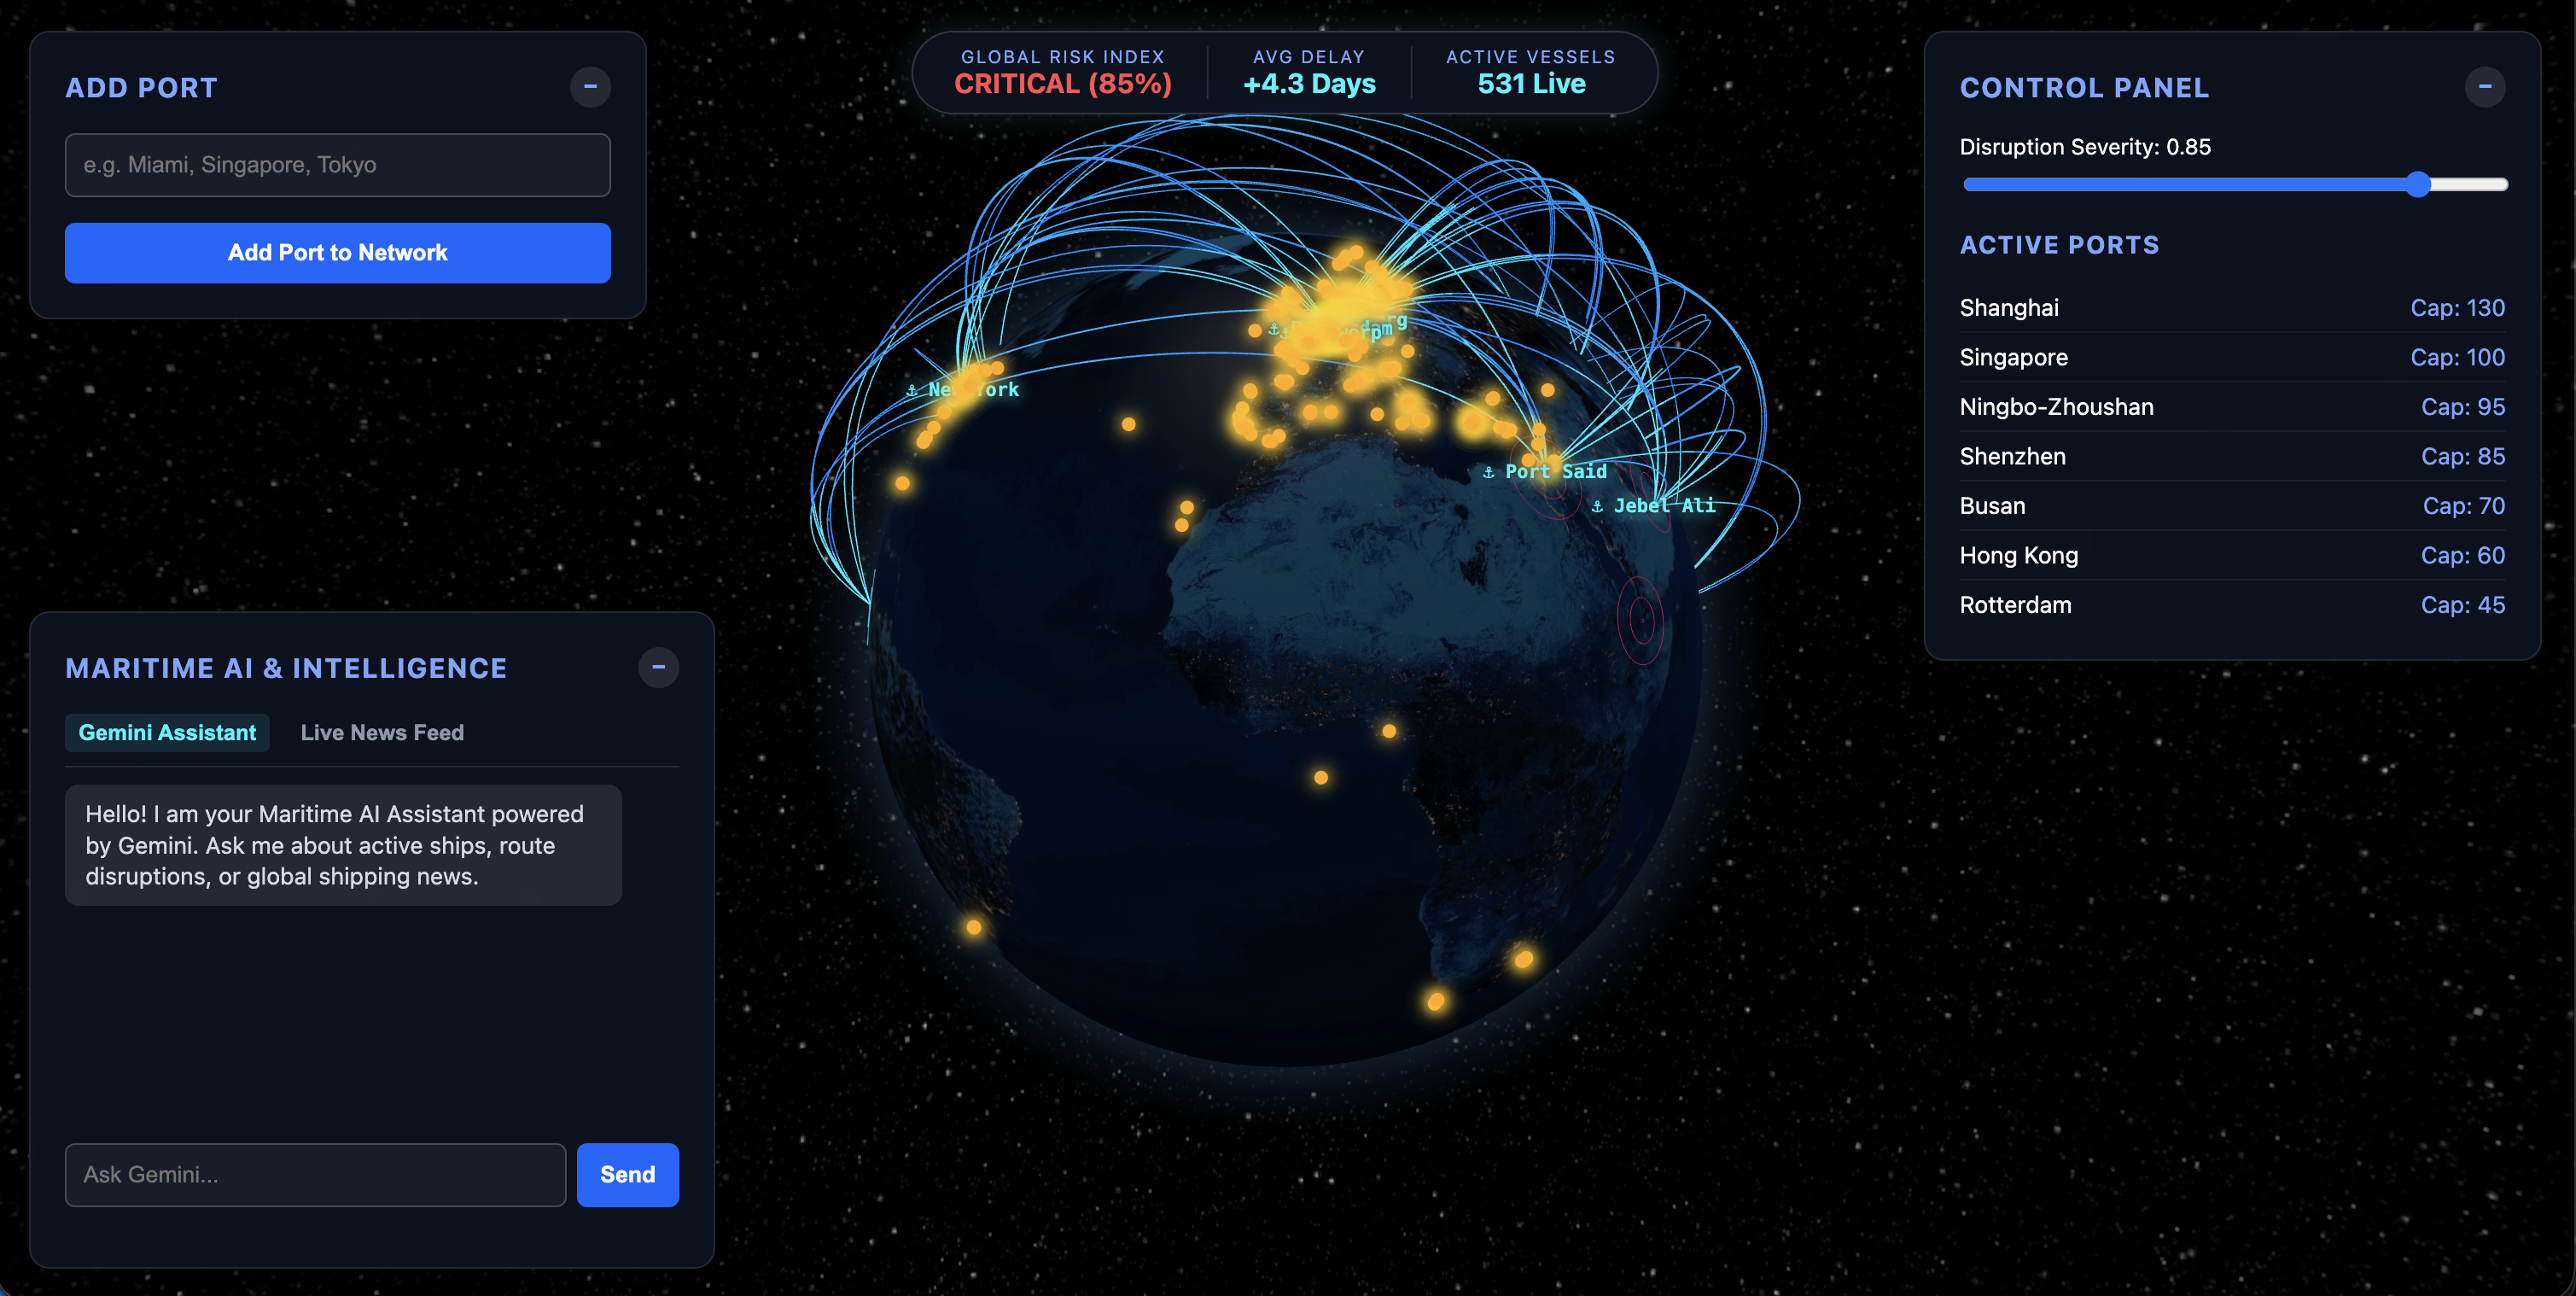
Maritime Supply Chain Simulator is an interactive 3D spatial logistics platform powered by a high-performance differential equation backend.
- Interactive 3D Globe: Visualizes active shipping arcs, port processing capacity, and dynamic bottleneck queues across key global maritime nodes (Shanghai, Singapore, Rotterdam, Los Angeles, Hamburg).
- Real-time Disruption Modeling: Simulates severe corridor shocks (e.g., an 85% capacity reduction in the Shanghai Corridor) and computes time-series queue accumulation over a 90-day horizon across 180 time steps.
- Scrubber Controls: Allows users to step through time frame-by-frame or adjust disruption severity on the fly to observe queue propagation and flow redistribution dynamics.
How I Built It
- Backend: Built with Python, FastAPI, and JAX. I formulated the spatial logistics network as a system of continuous-time differential equations solved over $T = 90.0$ days with $N = 180$ spatial discretization steps. JAX allows us to execute vectorized tensor operations directly over node capacities and mobility flow matrices $M$.
- Frontend: Developed using Globe.gl (built on Three.js and WebGL) to render 3D arc flows and dynamic port ring indicators that scale relative to queue-to-capacity ratios.
- API Integration: Asynchronous REST endpoints deliver simulated spatial trajectory tensors directly to the browser for sub-millisecond client-side interpolation.
Mathematical Formulation
The rate of change of queue build-up $Q_i(t)$ at port $i$ with capacity $C_i$ and mobility flow matrix $M_{ij}$ under a disruption mask matrix $D_{ij}$ is modeled by:
$$\frac{dQ_i}{dt} = \sum_{j \neq i} M_{ji} \cdot D_{ji} - C_i \cdot \sigma(Q_i)$$
Where $\sigma(Q_i)$ represents a non-linear processing rate function that saturates as queue length exceeds design throughput limits.
Challenges I Faced
- High-Performance ODE Vectorization: Ensuring continuous differential solvers ran fast enough to feed real-time user slider inputs required careful structuring of JAX array transformations (
jnp.ones,.at[].set()) to avoid unneeded re-compilations. - WebGL Dynamic Data Binding: Mapping multi-dimensional time-series arrays ($180 \text{ steps} \times 5 \text{ ports}$) smoothly to 3D spatial render loops without introducing frame drops or memory leaks on scrub events.
- CORS & Asynchronous State Synchronization: Coordinating asynchronous API calls with static file serving under Uvicorn so frontend state unlocked cleanly once the mathematical payload resolved.
What We Learned
- JAX for Domain Simulation: JAX isn't just for deep learning, its functional immutable array design makes it exceptionally effective for scientific differential equation models and matrix-based network physics.
- Spatial UI/UX Design: Abstracting dense numerical trajectories into clear visual cues (color-coded flow arcs and expanding dynamic rings) makes complex systemic risk intelligible at a glance.
What's Next
- Dynamic Route Auto-Rerouting: Implementing differentiable shortest-path optimization so vessel vectors dynamically divert away from high-congestion nodes in real time.
- Real-world AIS Integration: Ingesting live AIS vessel tracking telemetry to initialize simulation baselines with real-world port positions and current maritime congestion.

Log in or sign up for Devpost to join the conversation.