-
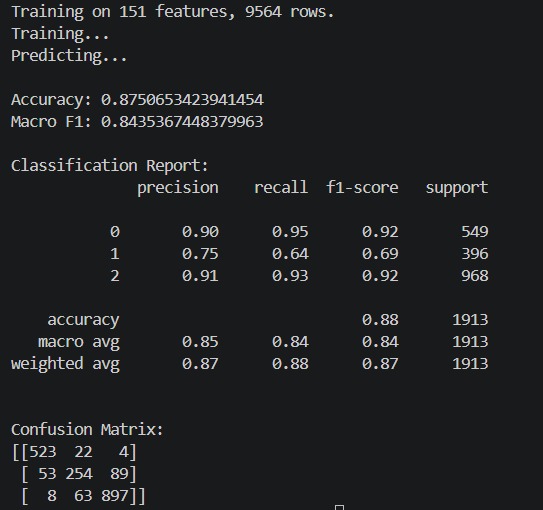
TabPFN results
-
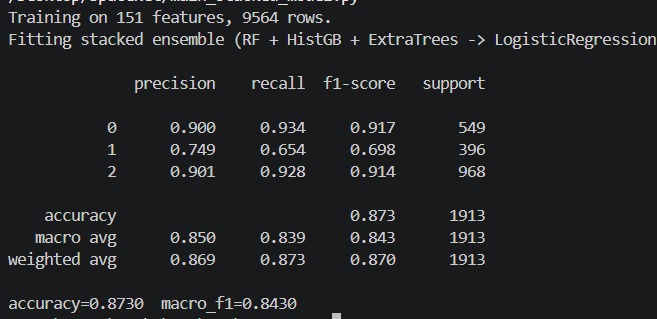
Stacked Model results
Classifying Kepler Objects of Interest: Exoplanet, Candidate, or False Positive
The Initial Challenge
NASA's Kepler mission left behind a catalog of roughly 9,500 Kepler Objects of Interest, or KOIs, each one a signal in stellar brightness data that looked like it could be a transiting planet. NASA had already sorted each object into one of three buckets: CONFIRMED planet, CANDIDATE still under review, or FALSE POSITIVE, meaning an eclipsing binary, background blend, or instrumental artifact. The goal was to build a machine learning model that could predict this three-way label from physical measurements alone, using things like transit depth, duration, stellar properties, orbital parameters, and photometric colors, well enough to be useful for triaging new candidates.
This meant a multi-class classification problem with about 9,500 rows and over 100 raw physical and astrometric features per object, drawn from real astronomical data rather than a clean textbook dataset, full of missing values, redundant columns, and columns that did not mean what they appeared to mean.
The Issues We Ran Into
The dataset we started from still contained NASA's own automated vetting outputs. koi_pdisposition, the pipeline's pre-vetting verdict, matched the final label on 99.9 percent of rows. Four koi_fpflag columns, where any single one being set to 1 identified FALSE POSITIVE with about 98 percent precision. And kepler_name, which was only ever populated for CONFIRMED planets, meaning it was effectively the label in disguise. Training on these columns pushed accuracy to 100 percent, which sounds impressive but is meaningless, since the model would just be reading NASA's own answer key back instead of learning anything from the underlying physics.
There was also real class imbalance. FALSE POSITIVE outnumbered CANDIDATE by roughly 2.4 to 1, which biases a naive model toward the majority class and specifically hurts recall on CANDIDATE, the class we would most want to catch correctly.
CANDIDATE versus CONFIRMED turned out to be a genuinely hard, possibly unsolvable problem given this data alone. Unlike FALSE POSITIVE, which has real physical signatures such as grazing transits or eclipsing binaries, the CANDIDATE and CONFIRMED split partly reflects how much follow-up telescope time an object has received, something that is not, and cannot be, captured in a table of physical measurements.
On top of that, there were junk and noise columns to deal with. ID columns, free text comments, near unique URL fields, constant columns, and 18 columns that were entirely null all needed to be identified and removed before they added noise or accidentally broke the pipeline. And working without GPU or cluster access meant every technique had to be evaluated on realistic hardware, favoring approaches that generalize rather than ones that only work with unlimited compute.
What We Did to Face Them
We rebuilt the cleaning pipeline from scratch rather than trusting a file simply labeled clean. This meant removing all three leakage sources described above, along with ID columns, constant columns, free text, and fully null columns. The high cardinality koi_quarters observing window bitstring was converted into a compact numeric feature instead of being one hot encoded into roughly 200 sparse columns.
We engineered physically motivated features, several of which mirror real Kepler vetting checks. This included a depth to radius ratio consistency check, since transit depth should equal the square of the planet to star radius ratio, and mismatches flag bad fits or blended stars. An impact parameter to inclination consistency check, since the impact parameter should equal orbital distance ratio times the cosine of inclination, and mismatches flag inconsistent transit shape fits. A stellar density consistency check, since density from the transit fit should equal stellar mass over stellar radius cubed, and mismatches flag bad stellar parameters. Signal to noise ratios for every key physical quantity, centroid and flux weighted motion significance ratios that catch background star blends, photometric color indices between adjacent bands, and log transforms of the most skewed quantities so tree splits were not wasted chasing a handful of extreme outliers.
We tested class imbalance techniques properly, always splitting train and test before resampling so no test set information leaked into the resampling step. We tried random undersampling, SMOTE, and SMOTE combined with Tomek link cleaning, all compared against simple balanced class weighting. Class weighting alone won on overall accuracy and macro F1, while resampling techniques traded some accuracy for higher CANDIDATE recall, a real tradeoff rather than a free win.
We ran RandomizedSearchCV instead of an exhaustive grid search to tune hyperparameters efficiently across a wide search space without the combinatorial cost of a full grid. We tested multiple model architectures, including flat single models, two stage cascades that separated FALSE POSITIVE first and then CANDIDATE from CONFIRMED, voting ensembles, and stacking. Two stage cascades consistently underperformed the flat model, because errors made at the first stage propagated and compounded into the second.
Our first strong result came from a stacked ensemble combining RandomForest, HistGradientBoosting, and ExtraTrees, joined by a logistic regression meta model trained on each base model's out of fold predictions. This combination outperformed every single model or voting variant we tried, since no single tweak got there alone, it was the combination that mattered.
We then tested a second, very different approach: TabPFN, a pretrained transformer based tabular foundation model, run as a single model with no custom stacking and no hand built feature engineering, just the strongest 75 raw features by importance, median imputed and fed directly into the model. This let us compare a heavily engineered multi model ensemble against a single pretrained model working with far less preprocessing effort.
Final Results
The stacked ensemble of RandomForest, HistGradientBoosting, and ExtraTrees reached an accuracy of 87.7 percent and a macro F1 of 0.848 on an 80 20 stratified train test split, with CANDIDATE recall at 0.662, the weakest class throughout every architecture tried.
TabPFN, run as a single model on only the top 75 raw features with no engineering, reached an accuracy of 87.9 percent and a macro F1 of 0.847 on the same style of split, essentially matching the stacked ensemble despite far less preprocessing and only one model instead of three. Its CANDIDATE recall came in at 0.65, close to but slightly below the stacked ensemble, while its CANDIDATE precision was noticeably higher, meaning it raised fewer false CANDIDATE alarms at the cost of missing a couple more real ones.
To make sure this was a fair comparison and not an artifact of feature count, we also ran a single RandomForest on the full 151 engineered features used by the stacked ensemble. That single model reached only 86.1 percent accuracy and a macro F1 of 0.827, meaningfully behind both TabPFN and the full stacked ensemble. In other words, TabPFN with fewer, unengineered features already beat a single tree based model given every engineered feature we built, and tied the entire three model stacked ensemble.
CANDIDATE remained the weakest class across every model and architecture tried, which is itself the most useful finding of the whole project. The ceiling here comes from the data and labels themselves, not from a missing model trick or insufficient feature engineering. Datasets that report accuracy above 95 percent on this exact task almost always include NASA's own fpflag vetting columns, which are close enough to encoding the label directly that using them is arguably closer to leakage than to a genuine feature. Our results are the more honest numbers for a model meant to work on genuinely new, unvetted candidates.
What the Models Actually Do
The stacked ensemble takes a KOI's physical and astrometric measurements, passes the engineered feature set through three independently trained base learners, bagged trees, boosted trees, and extremely randomized trees, each of which sees the data slightly differently, then feeds each base learner's out of fold class probabilities into a logistic regression meta model that learns how to best combine the three opinions. The result is a final label that matches NASA's own vetting closely on the two well separated classes and does meaningfully better than chance, though not perfectly, on the genuinely ambiguous CANDIDATE class.
TabPFN takes a different route entirely. Instead of training decision trees from scratch on this specific dataset, it uses a transformer model pretrained on a huge number of synthetic tabular problems, and adapts to this particular classification task in context, without traditional gradient based training on our data at all. Given only the strongest 75 features, it reaches essentially the same overall accuracy as the full stacked ensemble, which suggests that a large part of the remaining difficulty in this problem is not something more feature engineering or more model complexity can solve, reinforcing the conclusion that the real ceiling here is set by the data itself, particularly the ambiguity between CANDIDATE and CONFIRMED.
Taken together, the two models tell a consistent story from two very different directions. One built through careful, hand engineered feature construction and ensemble stacking, the other through a pretrained foundation model requiring almost no custom pipeline, and both arrive at nearly the same ceiling, around 87 to 88 percent accuracy, with CANDIDATE as the persistent weak point in every version tested.
Other Approaches We Tried That Did Not Pan Out
Not every avenue we explored improved on the flat stacked ensemble, and two of them are worth describing honestly rather than leaving out.
The first was synthetic data augmentation using CTGAN, a generative model that learns the statistical structure of a tabular dataset and produces new synthetic rows with similar properties. We generated a CTGAN version of the training data that preserved the original class proportions rather than rebalancing them, then ran the same RandomForest, HistGradientBoosting, ExtraTrees stacked ensemble on it. The result was essentially indistinguishable from training on the real data, an accuracy around 86.2 percent with CANDIDATE recall still sitting around 0.61, no real gain and if anything a very slight step down. In hindsight this makes sense. CTGAN is built to reproduce the value distributions already present in the training data, not to somehow clarify which of the ambiguous CANDIDATE and CONFIRMED cases belong where. Generating more rows that look statistically like the original ambiguous cases does not teach a model anything new about how to resolve that ambiguity, it just adds more of the same difficulty rather than more information.
The second was a heavier three model stacking architecture using TabPFN, XGBoost, and CatBoost as base learners, each given its own tuned feature subset, 85 features for TabPFN, 90 for XGBoost, 80 for CatBoost, combined through 5 fold out of fold predictions and enriched with confidence, entropy, and margin features describing how certain each base model was, before a logistic regression meta model made the final call. This was a more elaborate version of the approach that worked well for the tree based stack, so it seemed like a reasonable next step to try. In practice it underperformed the simpler stacked ensemble on the two metrics that matter most, reaching 85.7 percent accuracy and a macro F1 of 0.836, both behind the RandomForest, HistGradientBoosting, ExtraTrees stack's 87.7 percent and 0.848. It did lift CANDIDATE recall up to 0.75, but that came directly at the cost of FALSE POSITIVE recall dropping to around 85 percent, since the meta model became more willing to call things CANDIDATE across the board, including a meaningful number of true FALSE POSITIVEs. That is a real precision and recall trade rather than a genuine improvement, and it was not even a trade made on purpose, it fell out as a side effect of mixing a different set of base models rather than a deliberate design choice. On closer inspection, the script also included a threshold optimization step meant to search for the decision threshold that best balanced minority class recall, but the threshold value was never actually applied to the probabilities before the final class was chosen, so every value in the search loop produced the same result. The reported best threshold was not doing anything, and the CANDIDATE recall gain came entirely from how the meta model's own decision boundary happened to land, not from any real threshold tuning.
Taken together, the extra complexity in this second approach, a GPU dependent model, three separate feature subsets to maintain, and a threshold search that turned out to be a no op, was not justified by the results it produced. It is included here as a useful negative result rather than a hidden failure. More moving parts did not automatically translate into a better model, and in this case the added complexity introduced its own new problems without solving the one problem, CANDIDATE classification, that actually needed solving.
Possible Future Directions
One result worth being honest about is that feature engineering had a smaller effect than the effort behind it might suggest. A single RandomForest trained on all 151 engineered features reached 86.1 percent accuracy, only a small step up from the roughly 85.7 to 86.3 percent a plain RandomForest got on the cleaned data before any of the depth to radius consistency checks, signal to noise ratios, or color indices were added. Meanwhile TabPFN reached 87.9 percent using only 75 raw, unengineered features. A likely explanation is that tree based models can already approximate many of these ratios on their own by splitting repeatedly on the two raw columns involved, so a hand built ratio feature like depth over radius squared is often redundant with information the trees could extract anyway given enough splits. Future work here would mean running a proper ablation, dropping one engineered feature group at a time, such as the consistency checks alone, the signal to noise ratios alone, and the color indices alone, and comparing accuracy and macro F1 against the full feature set and against no engineering at all, rather than assuming the whole batch of engineered features helped just because the final number went up slightly. Permutation importance or SHAP values on the trained models would also show directly whether the engineered columns are pulling real weight or sitting near the bottom of the importance ranking.
The choice of 75 features for TabPFN also deserves more scrutiny than it got. That number was carried over from an earlier stacking script that split 100 top features across three models, giving TabPFN the smallest slice on the assumption that it performs better with fewer, stronger features rather than many weaker or redundant ones, which lines up with how TabPFN was designed. It is built as an in context transformer that reasons over a full training set inside a single forward pass rather than learning through gradient descent, and its documented behavior favors a compact, high signal feature set over a large, noisy one, unlike tree ensembles, which can shrug off weak features by mostly ignoring them across many splits. That said, 75 was never actually tuned for this specific dataset, it was inherited from a different setup. A clear next step would be running TabPFN across a range of feature counts, for example 50, 75, 100, and the full 151 engineered set, to see where its accuracy actually peaks here rather than assuming the borrowed number was optimal. Running the equal footing script with the full engineered feature set, which was prepared but not yet executed due to lacking GPU access in this environment, would answer directly whether TabPFN holds steady, improves, or degrades once it is given everything the stacked ensemble sees.
Beyond those two points, a few other directions are worth pursuing. Testing whether KOIs from the same host star ever end up split across the training and test sets would check for a subtler, second order leakage risk, since sibling candidates around one star share identical stellar parameters, and a grouped split by star would give a cleaner read on generalization. A combined stack of TabPFN alongside XGBoost and CatBoost, similar to the earlier attempt at this, is worth revisiting properly, including fixing the threshold optimization step that turned out not to be doing anything in that version. Full hyperparameter tuning with real compute, rather than the reduced search budget used here due to a single CPU core, would confirm whether the current settings are actually close to optimal or just the best that time allowed. And since CANDIDATE recall and precision are the real bottleneck across every model tried, it may be worth testing approaches aimed specifically at that class, such as anomaly or uncertainty based flagging of borderline CANDIDATE and CONFIRMED cases for manual follow up, rather than expecting any single model to fully resolve a distinction that partly depends on information, like follow up telescope time, that simply is not present in this table.
Built With
- csv
- data-cleaning
- feature-engineering
- python
- randomforest
- stacked-model
- tabpfn
- xgboost


Log in or sign up for Devpost to join the conversation.