Inspiration
During floods and other disasters, roads, bridges, and communication networks can become unusable, leaving rescue teams uncertain about which areas are damaged and which settlements are isolated. We were inspired by the potential of freely available satellite data to reveal what is happening on the ground, even when direct access is difficult. Our goal was to turn complex geospatial data into practical information that could support better-informed disaster-response decisions.
What it does
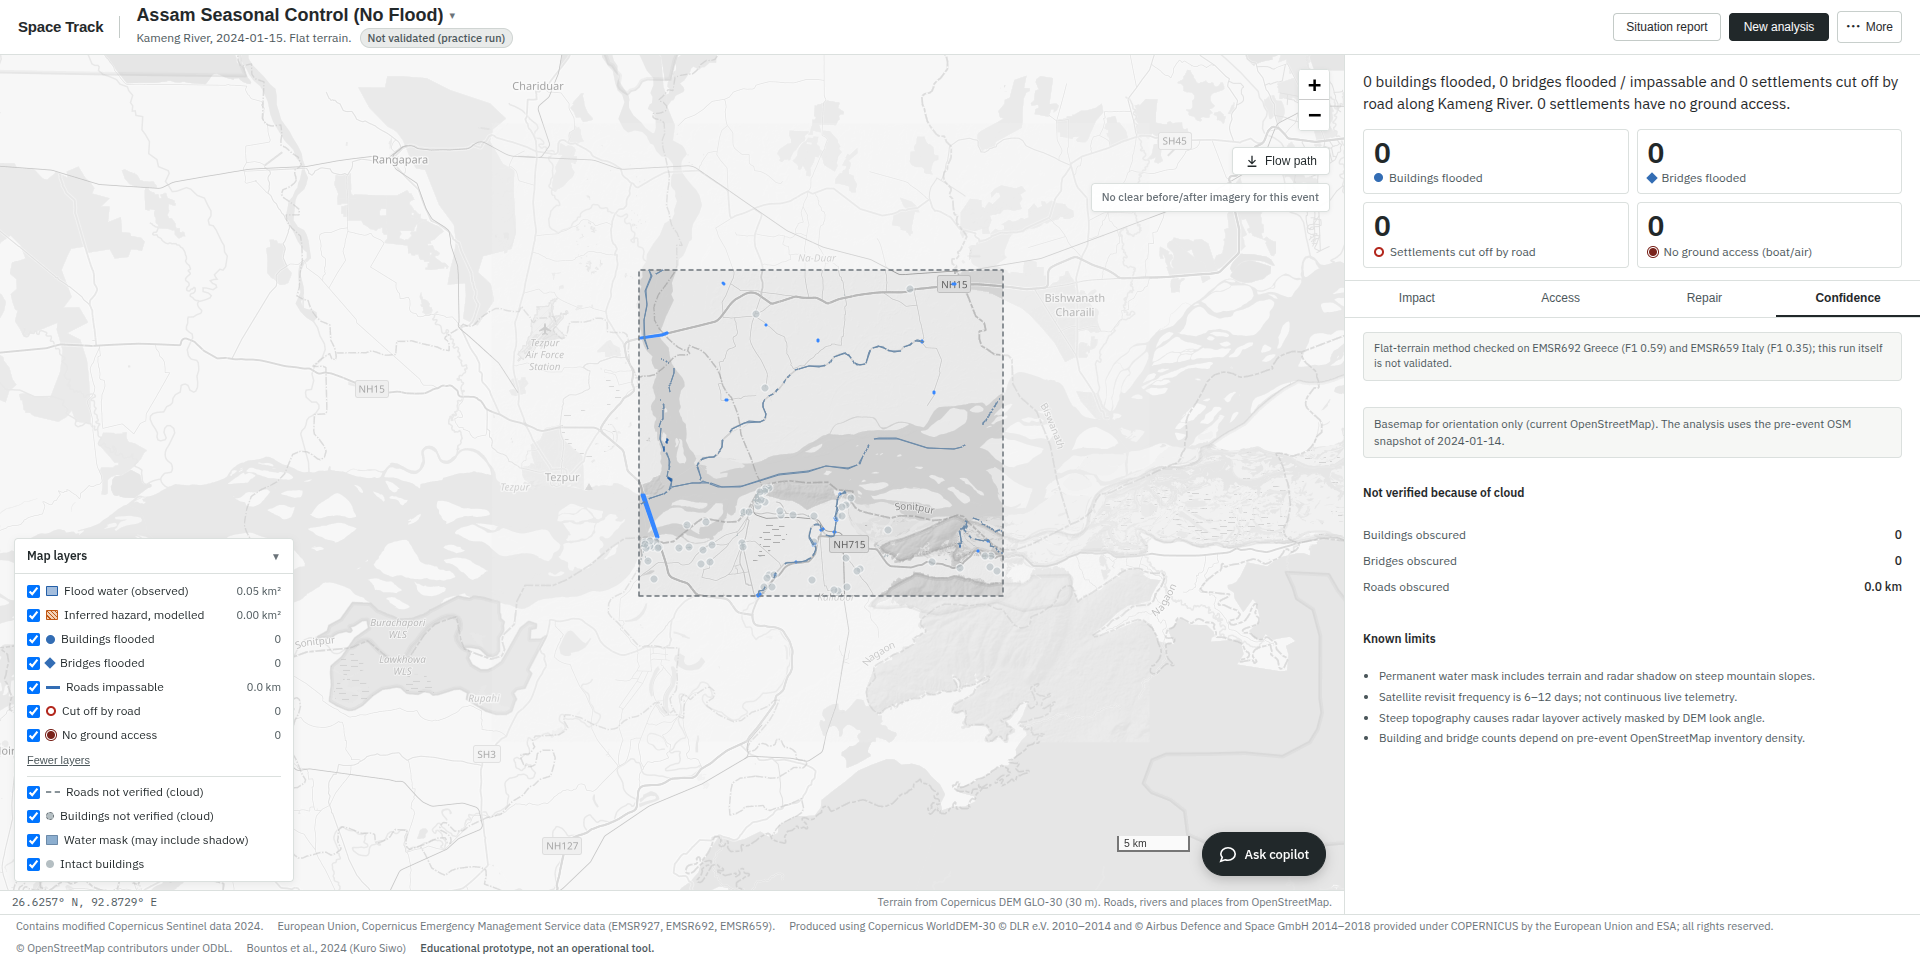
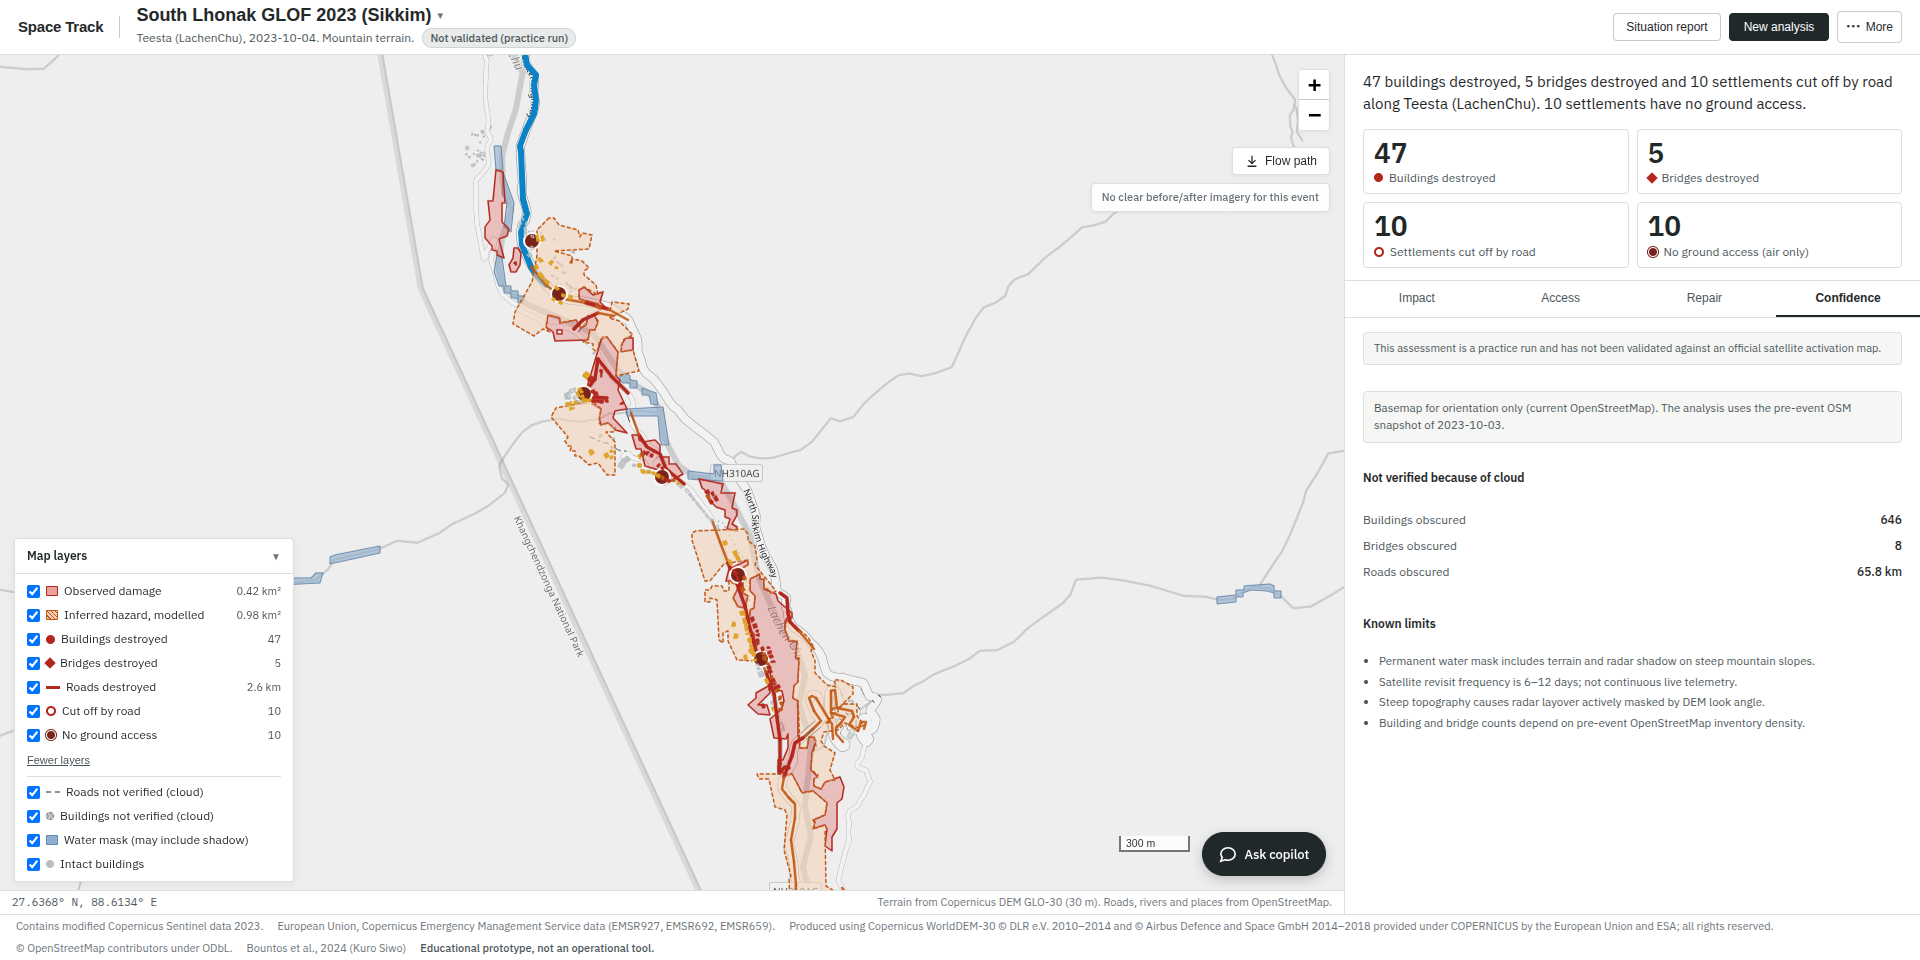
Space Track — “When the Ground Goes Silent, Space Speaks.” is a satellite-powered flood-mapping and disaster-intelligence application. It analyses an area and an event date to answer three critical questions: Where did the flood hit? What infrastructure was damaged? Who is cut off?
The application identifies potentially affected areas, assesses damage to buildings, bridges, and roads, and detects settlements that have lost road connectivity to towns or healthcare facilities. It also ranks road-repair packages according to the settlements and buildings they could reconnect. An interactive dashboard presents the results, while an AI-powered copilot answers questions in English, Nepali, and Hindi and provides access to concise situation reports.
How we built it
We built Space Track using freely available Sentinel-1 radar imagery, Sentinel-2 optical imagery, Copernicus Digital Elevation Model (DEM) data, and pre-event OpenStreetMap data. The system compares satellite observations from before and after a flood, using terrain characteristics, vegetation changes, surface changes, and drainage information to identify potential flood and debris impacts.
We developed a geospatial analysis pipeline that classifies terrain, grades infrastructure damage, analyses road-network connectivity, and identifies settlements that may have lost access to essential destinations. The dashboard brings these outputs together through impact, access, repair, and confidence views, including satellite-image comparisons and flood-path tracing.
For the AI component, we implemented a situation-report copilot designed to answer questions using the system's actual outputs. Guardrails ensure that reported numbers, place names, and road references are grounded in the retrieved data rather than invented by the language model.
Challenges we ran into
One of our main challenges was distinguishing actual flood damage from normal seasonal changes, particularly in areas with vegetation, agricultural water, and complex terrain. Mountain valleys presented additional difficulties because steep slopes, radar shadows, clouds, and limited image resolution can obscure damage.
We also had to determine which settlements had genuinely lost road connectivity while accounting for uncertain road conditions beneath clouds. Another challenge was making the AI copilot reliable: it needed to use the correct event data and avoid generating unsupported numbers or misleading recommendations. We addressed these issues through control-image comparisons, terrain-aware detection, separate optimistic and pessimistic access scenarios, and data-grounded response safeguards. However, some damage remains undetected, and uncertain areas must be interpreted cautiously.
Accomplishments that we're proud of
We developed an end-to-end prototype that combines satellite-based damage mapping, infrastructure assessment, settlement-access analysis, repair prioritisation, and AI-assisted reporting in one application.
In the Trishuli flood case study, the system identified 1.08 km² of observed affected area, with an additional 1.07 km² inferred from terrain. It identified 107 buildings as destroyed, 225 as affected, and 12 bridges as destroyed. The analysis found 44 settlements cut off by road, including four with no ground access. Our prioritised repair package showed that four road links, covering approximately 1 km, could reconnect 19 settlements and 939 buildings.
We are also proud that the system produced no damage or settlement cut-off detections on six no-event test dates and reproduced the Trishuli outputs consistently in a fresh run. These results demonstrate the potential of combining geospatial analysis with carefully constrained AI assistance.
What we learned
We learned that effective disaster mapping requires more than identifying water in satellite images. Terrain, seasonal variation, image availability, infrastructure data quality, and road-network connectivity all influence the reliability of the results.
We also learned that AI is most useful in this context when it explains verified system outputs rather than independently inventing facts. Testing across different disaster events showed us that a method that works well in one geographical setting may not transfer reliably to another. Finally, we recognised the importance of communicating uncertainty honestly: an educational prototype can support disaster assessment, but it cannot replace field verification or guarantee real-time information.
What's next for Space Track
Our next steps are to improve detection of narrow flood channels and damage hidden by clouds or terrain shadows, strengthen validation across more geographical regions and disaster events, and improve the reliability of infrastructure-damage estimates. We also aim to enhance the dashboard's usability, expand multilingual reporting, and make repair-prioritisation results easier for emergency-response teams to interpret.
In the longer term, we hope to explore more frequent data updates, field-verification workflows, and collaboration with disaster-management professionals. Space Track is currently an educational prototype that maps damage after an event, not an early-warning system. Our vision is to develop it into a more reliable decision-support platform that helps responders identify affected areas, understand access constraints, and prioritise recovery efforts using transparent, evidence-based information.

Log in or sign up for Devpost to join the conversation.