Inspiration
Most people think of space as empty. But once I started looking at real satellite positions and operating environments, it became clear that space behaves more like a traffic system with repeated corridors, pressure zones, and unequal operating conditions. I wanted to build something that could communicate that idea visually, but also back it up with real analysis instead of stopping at a pretty globe.
What it does
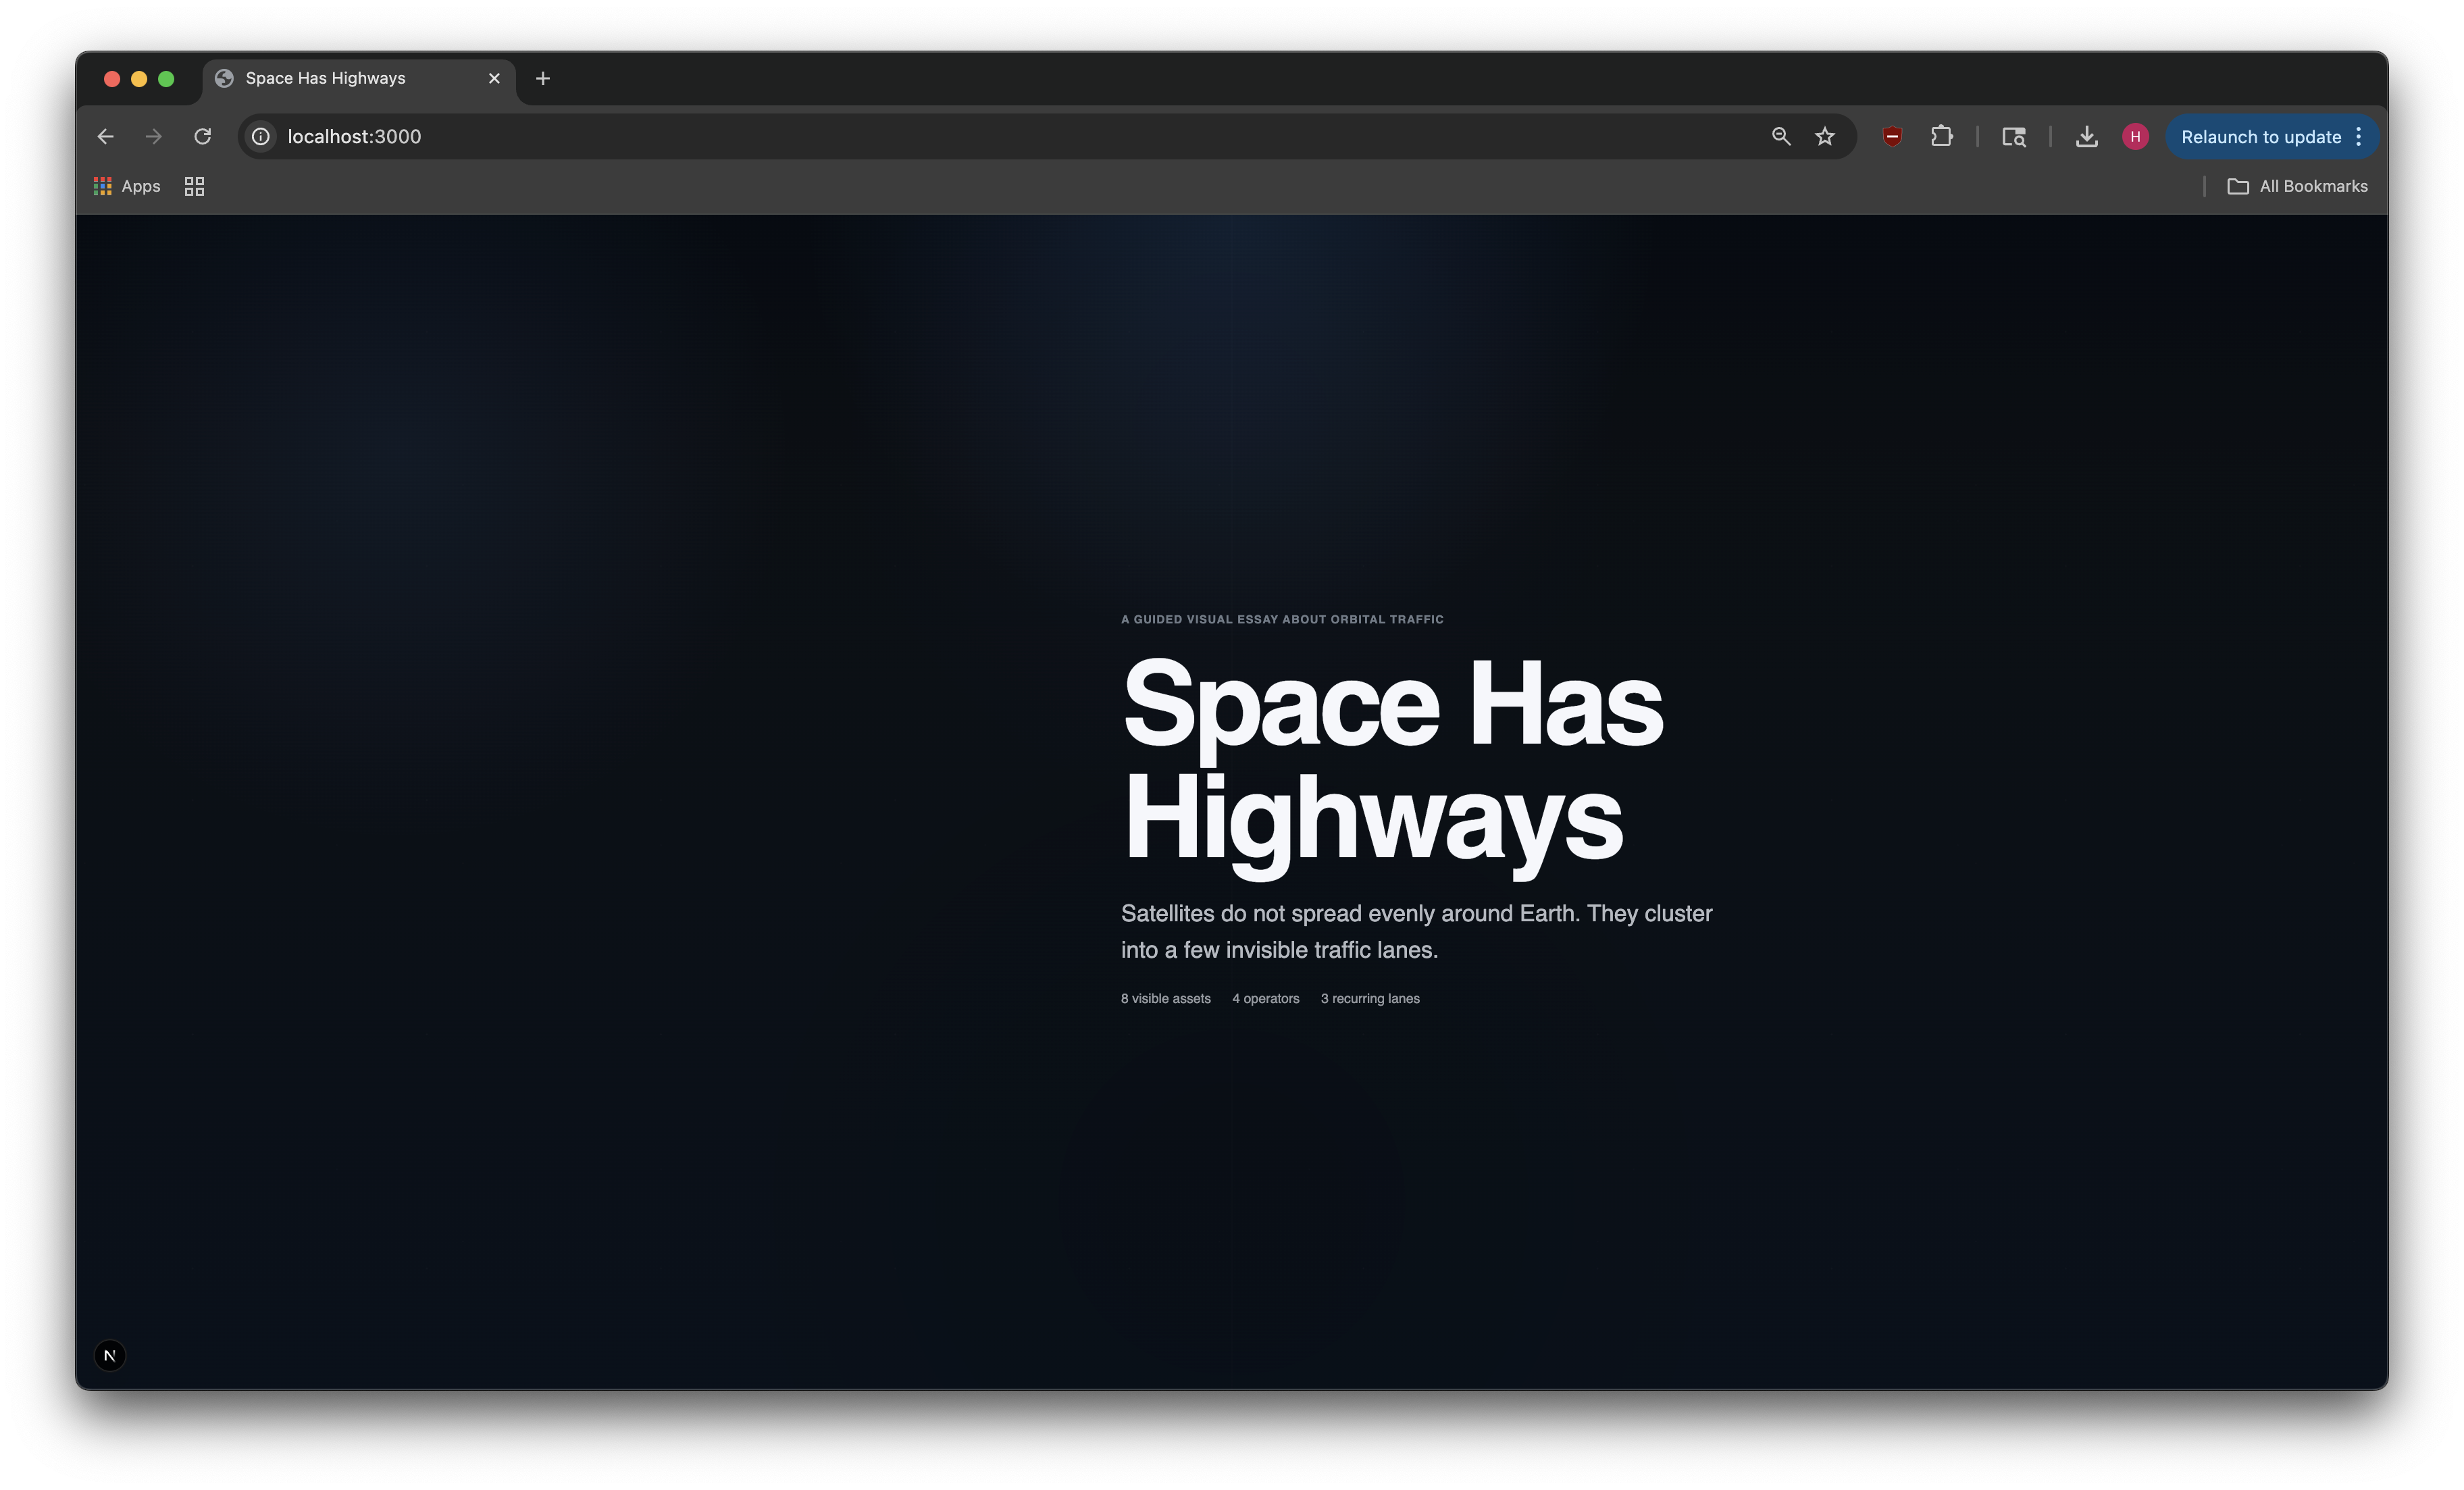
Space Highways is an interactive visual essay and research-backed analysis system for orbital traffic.
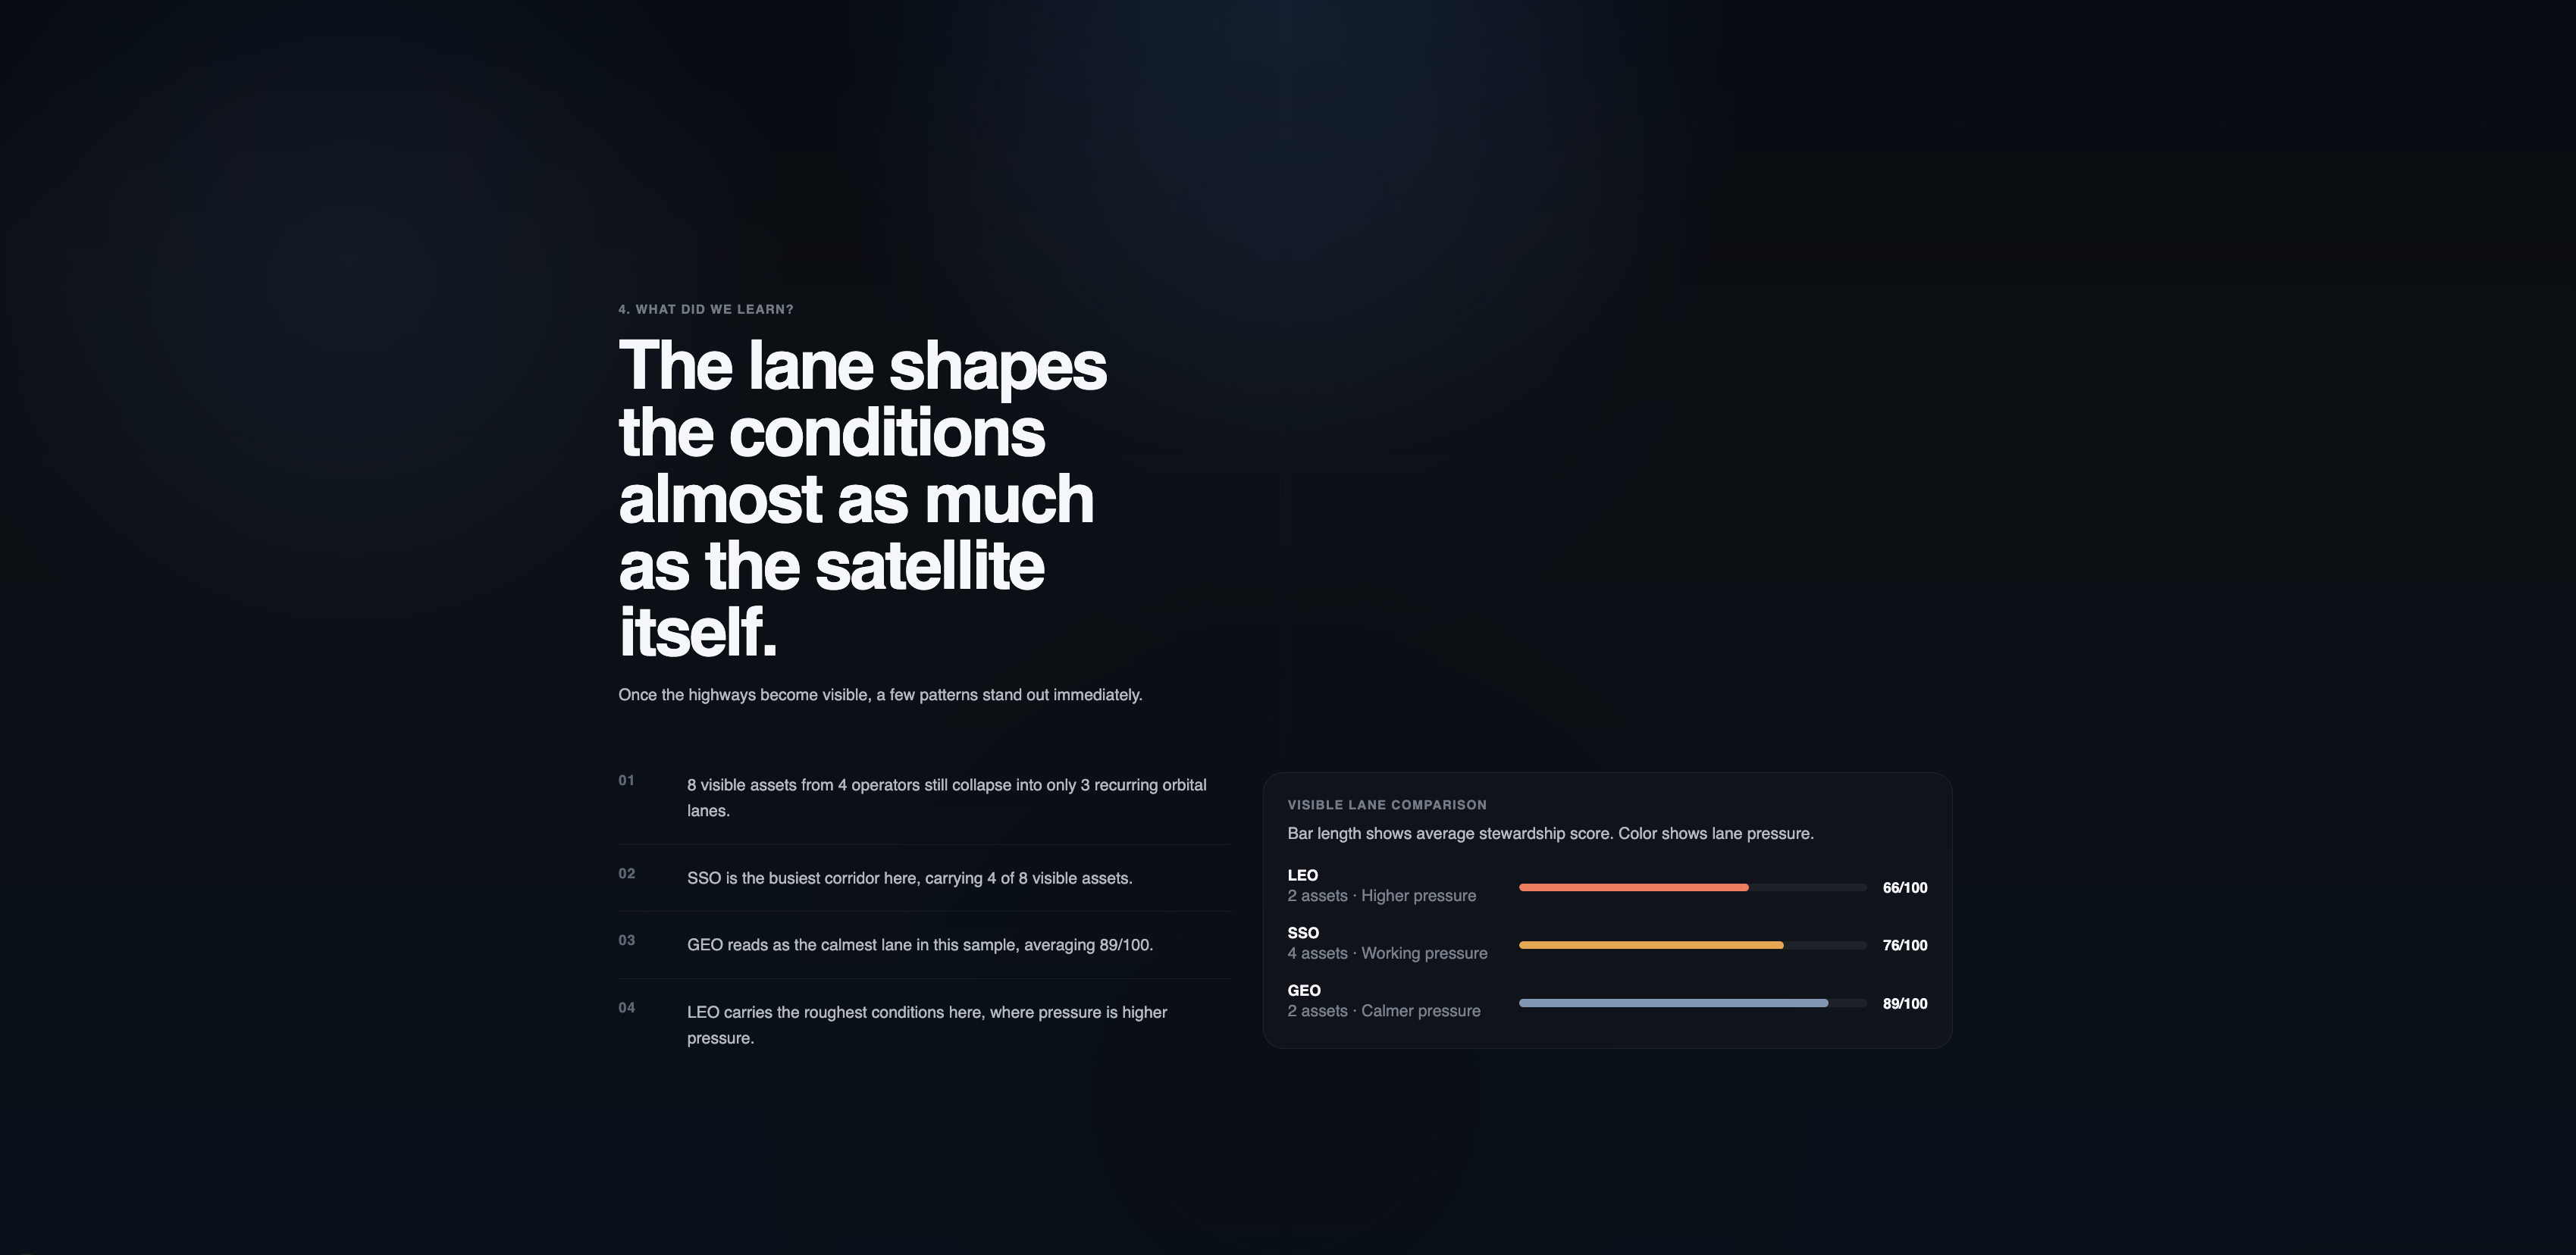
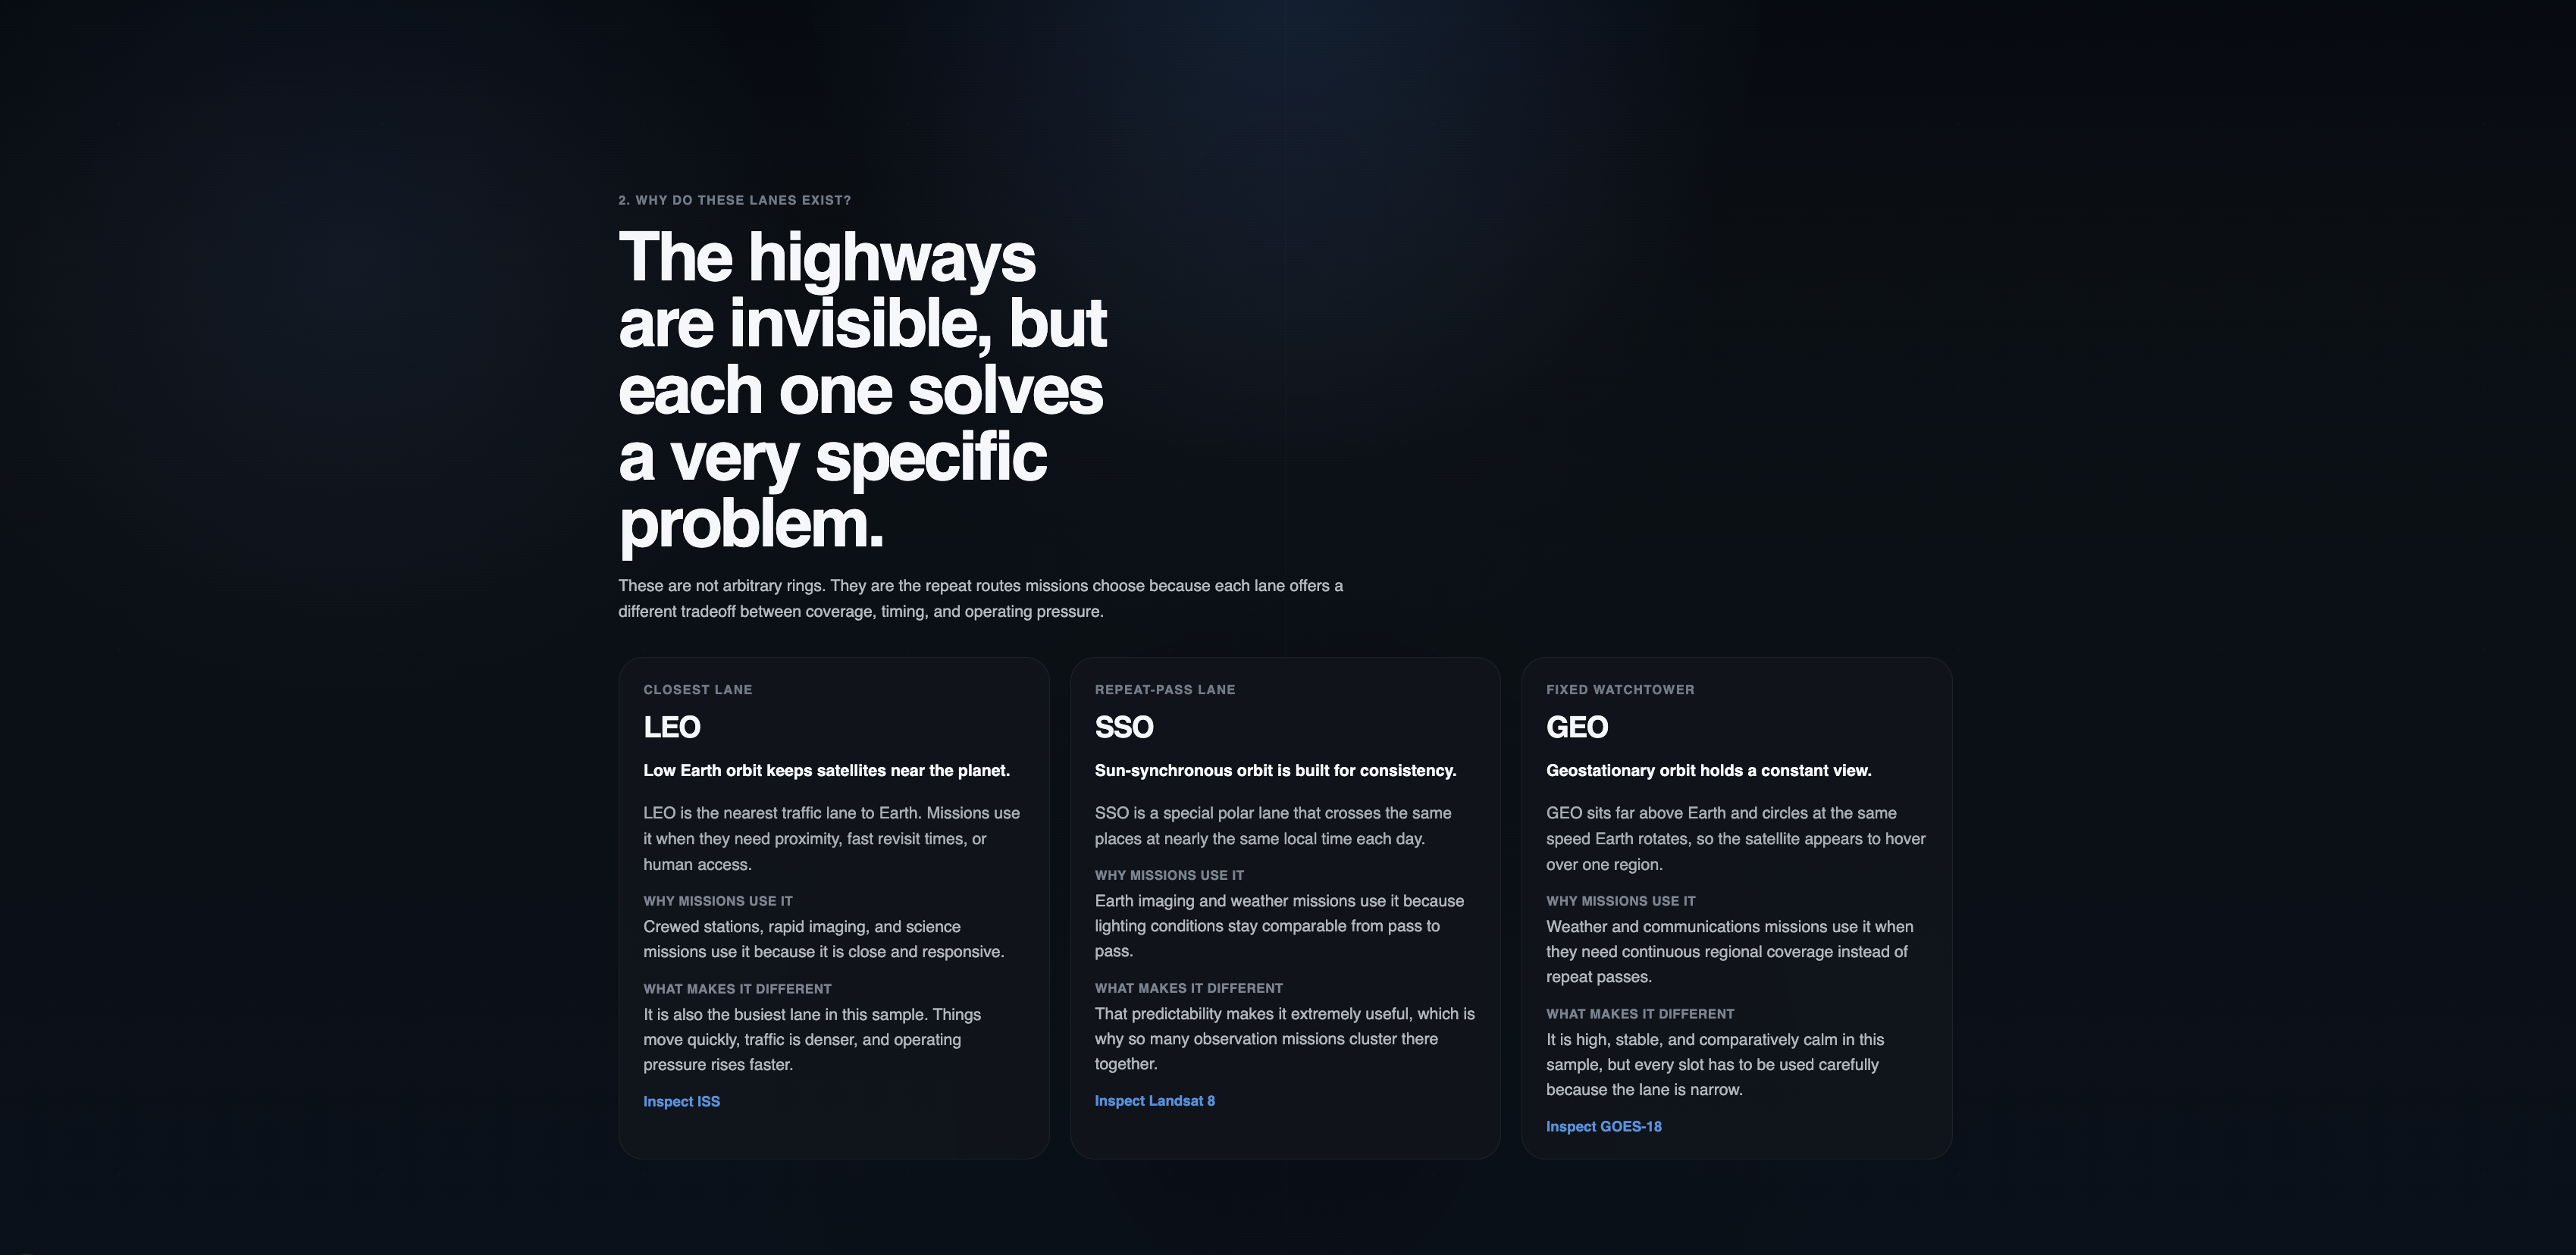
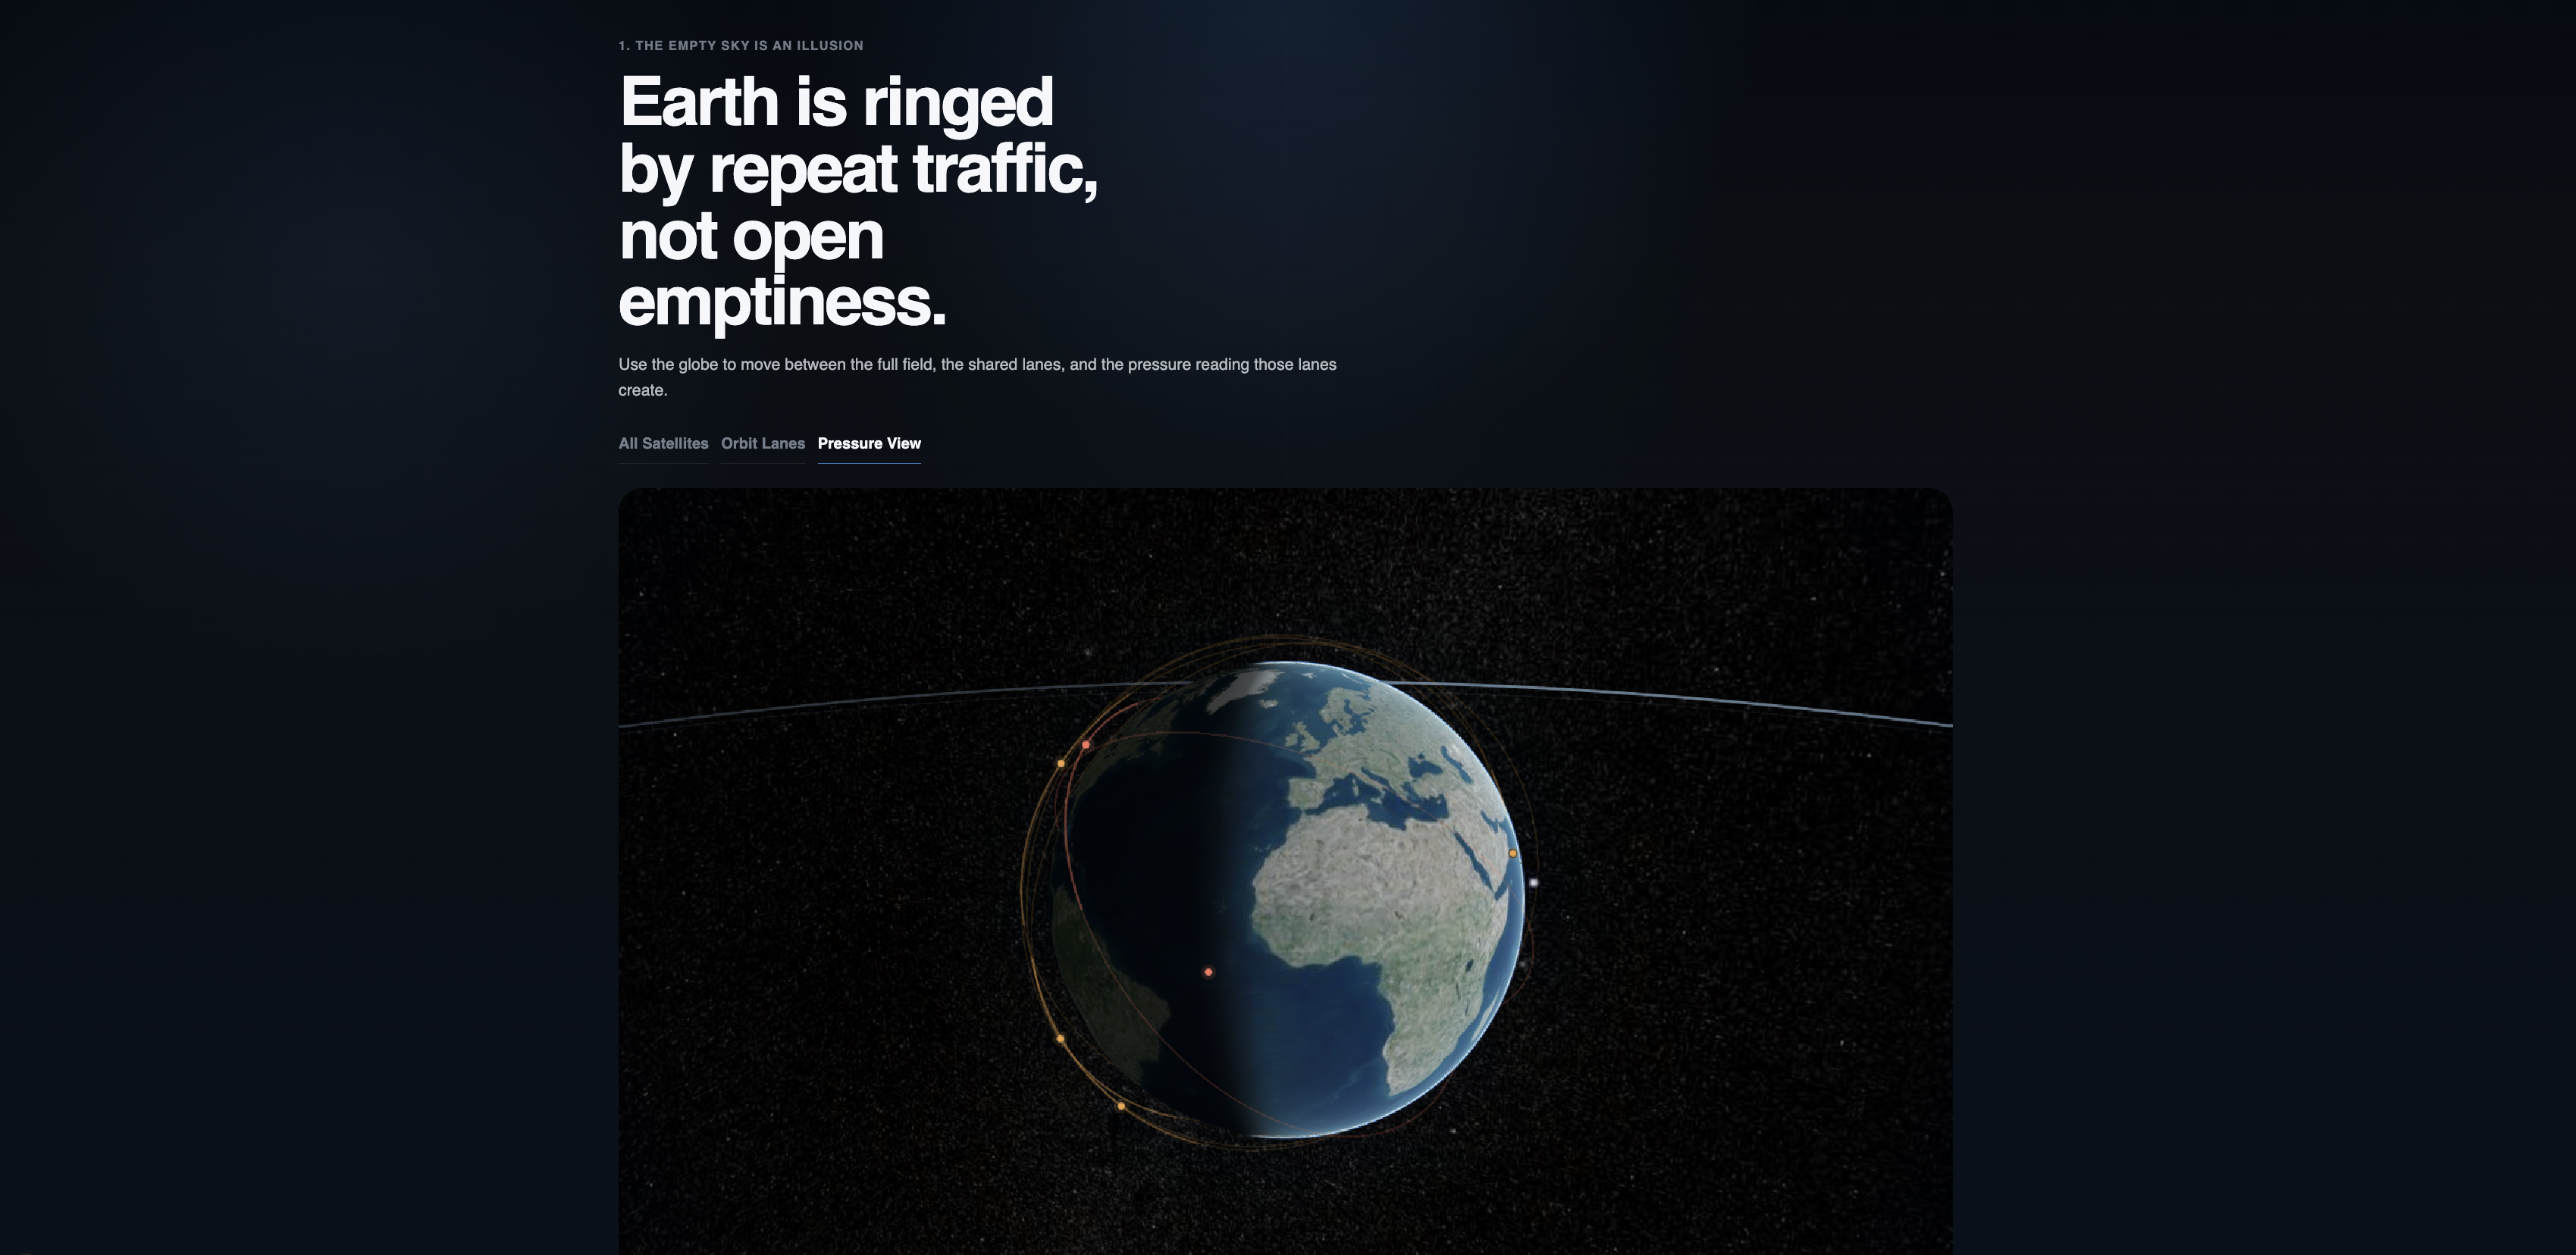
The experience shows that active satellites do not spread evenly around Earth. They cluster into recurring orbital lanes like LEO, SSO, and GEO, and those lanes create very different congestion, debris, and stewardship conditions.
The front end guides the viewer through that story visually:
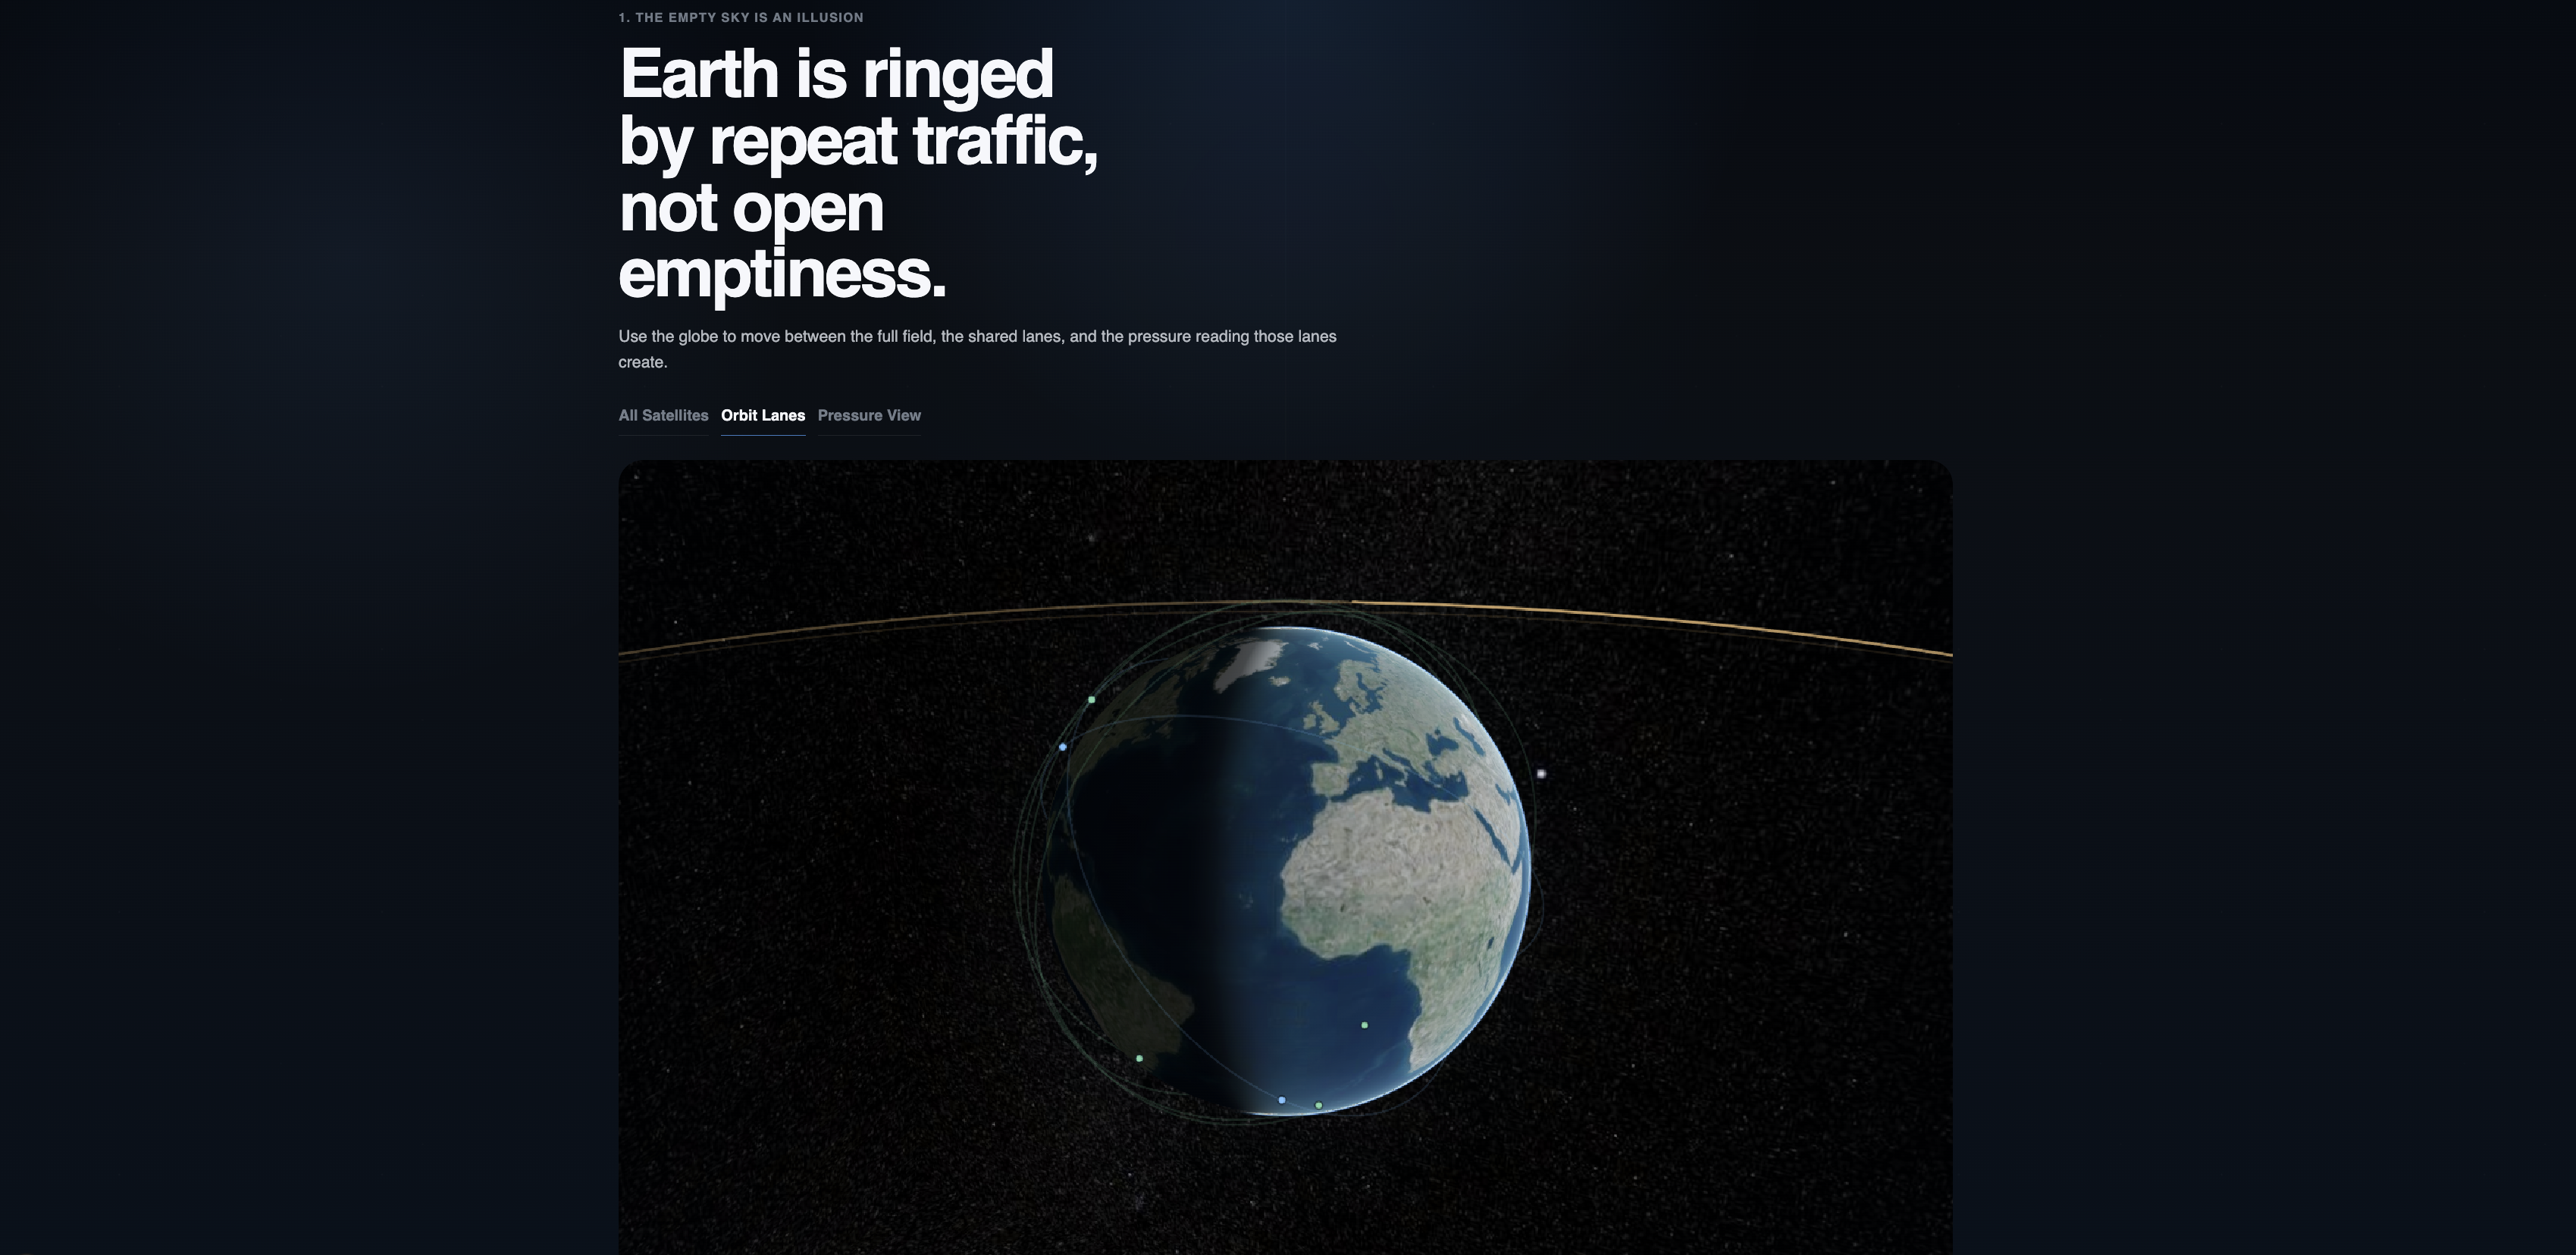
- first by revealing the hidden orbital “highways”
- then by explaining why those lanes exist
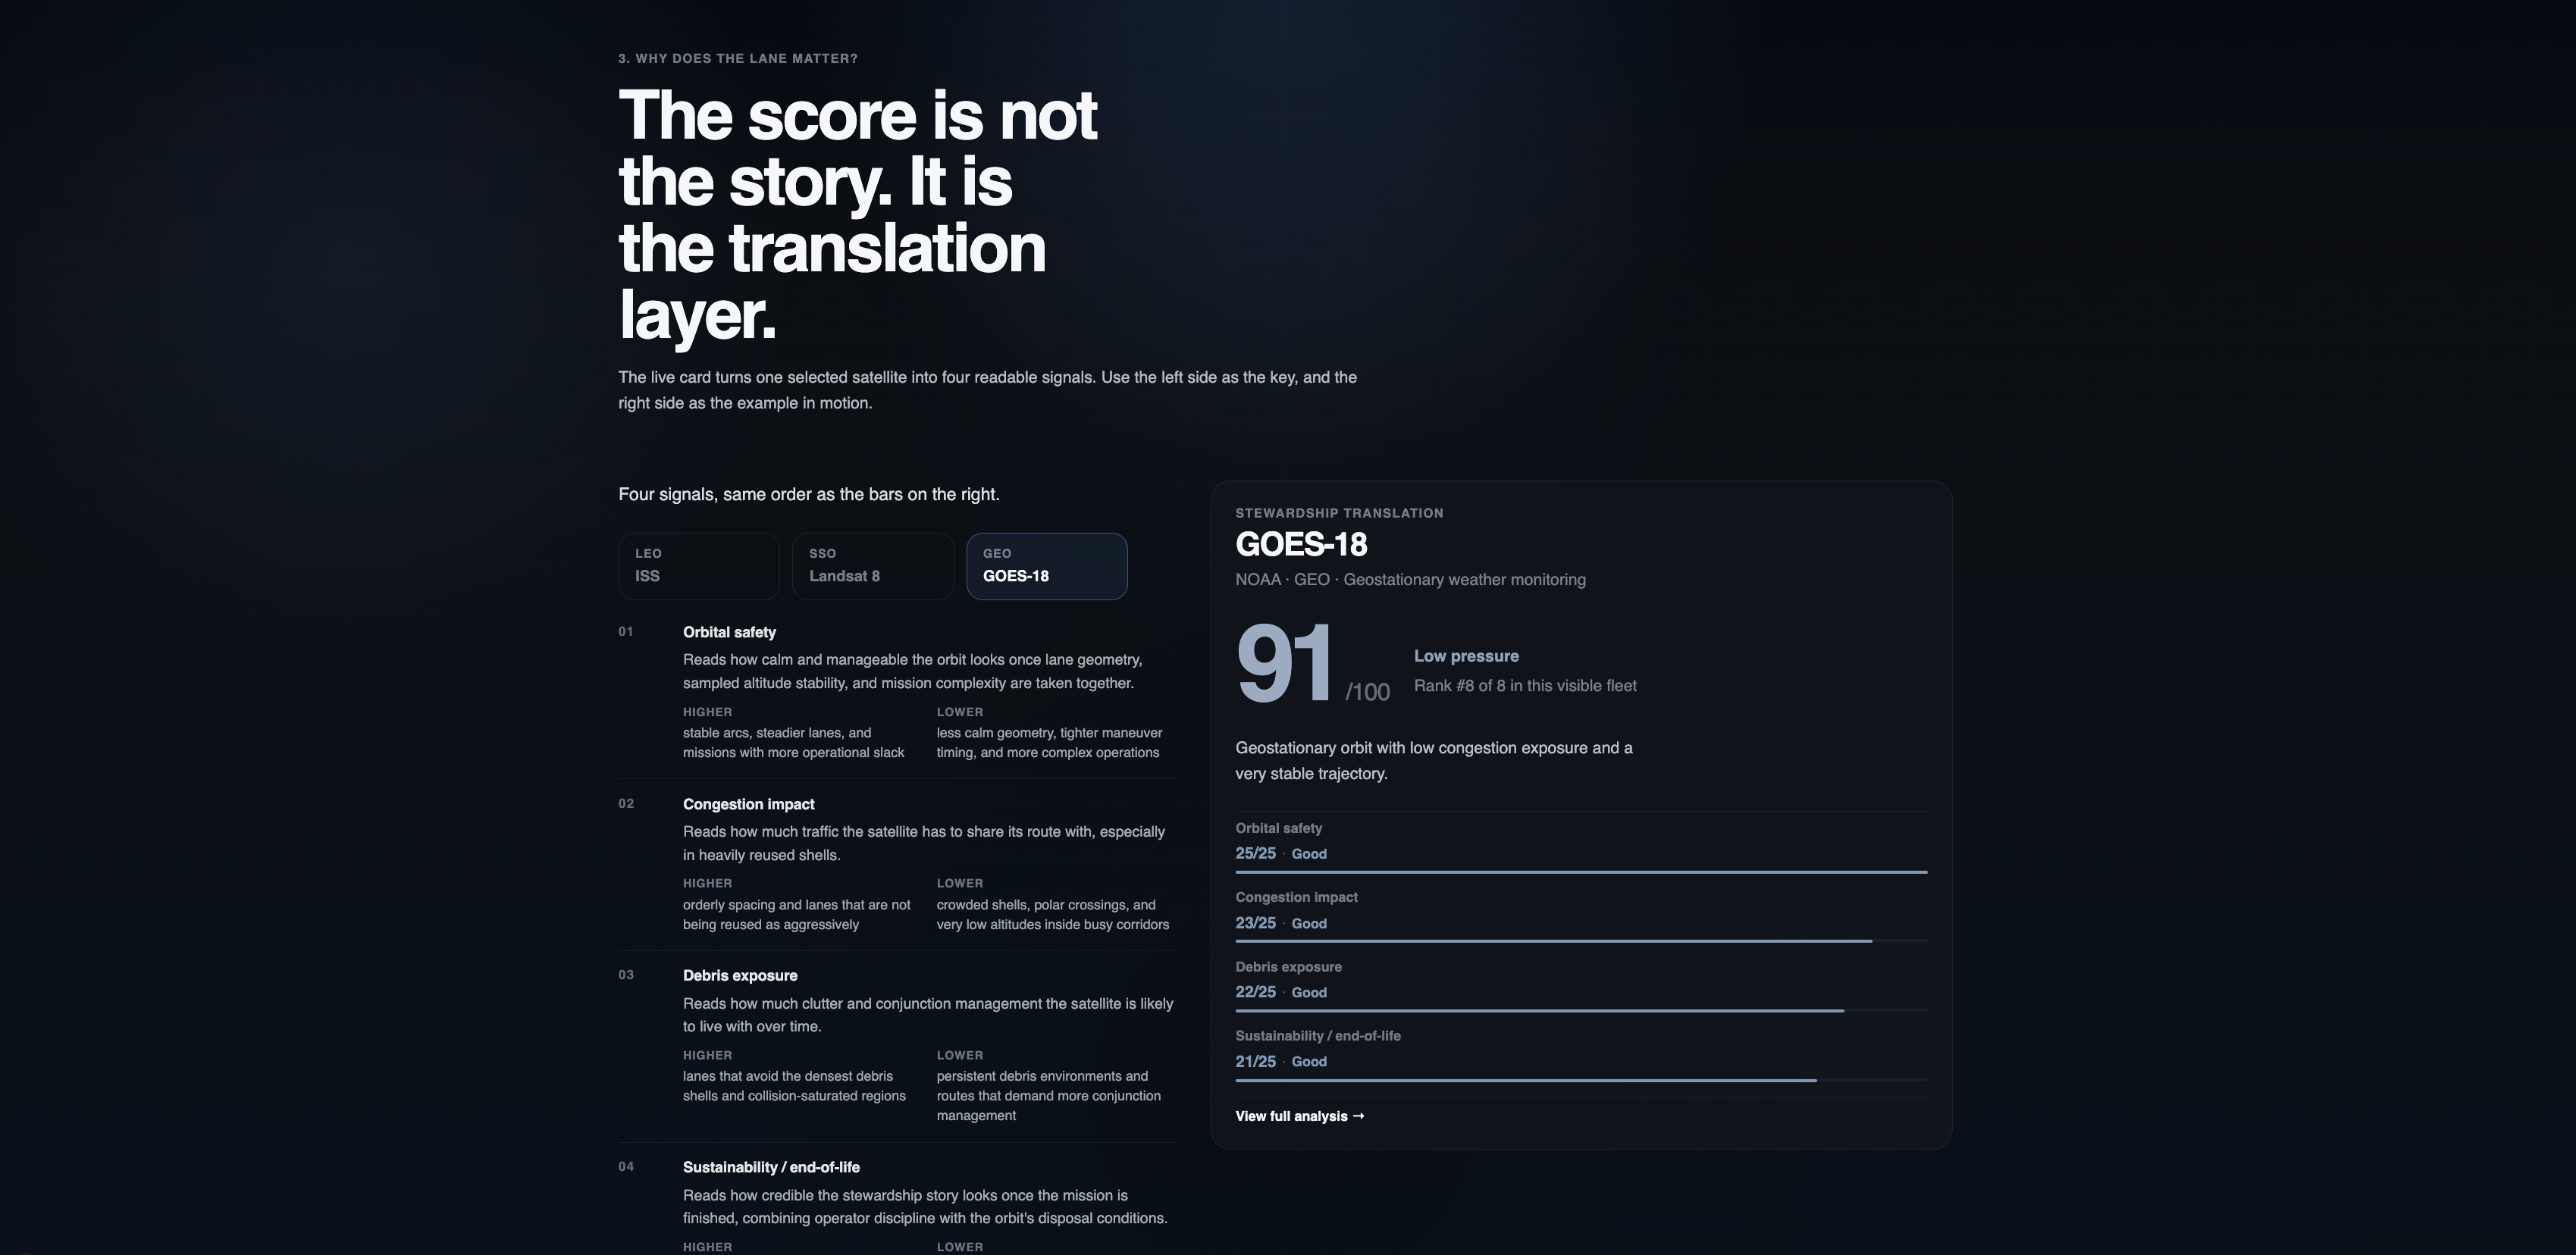
- then by translating orbital conditions into readable stewardship signals
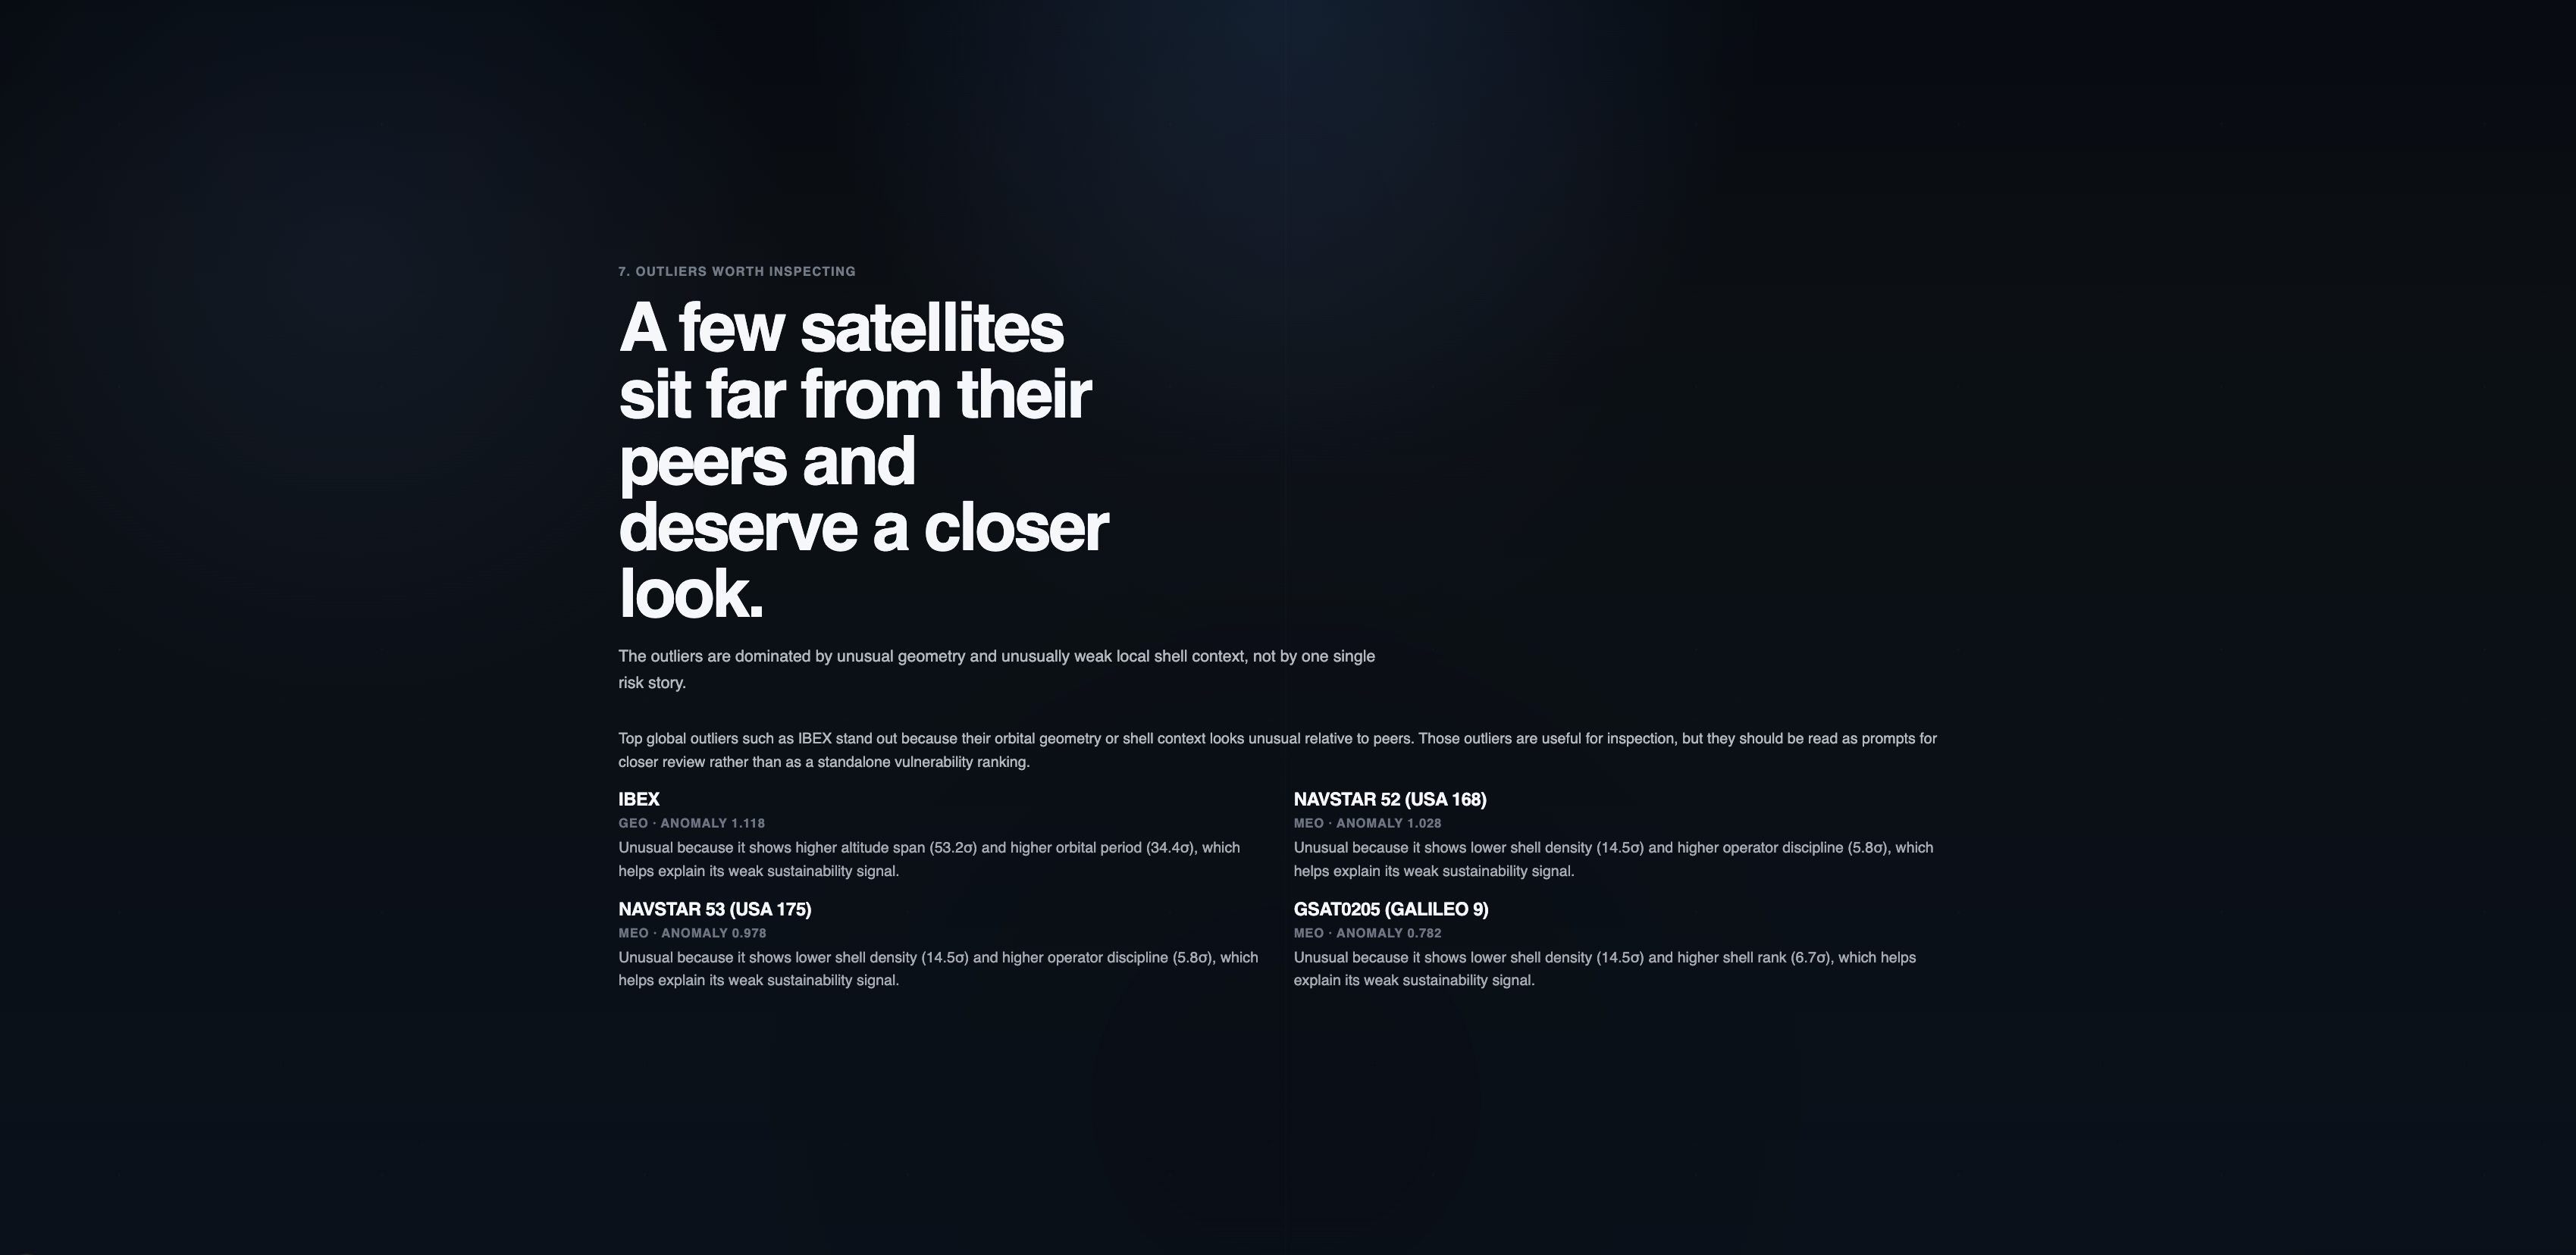
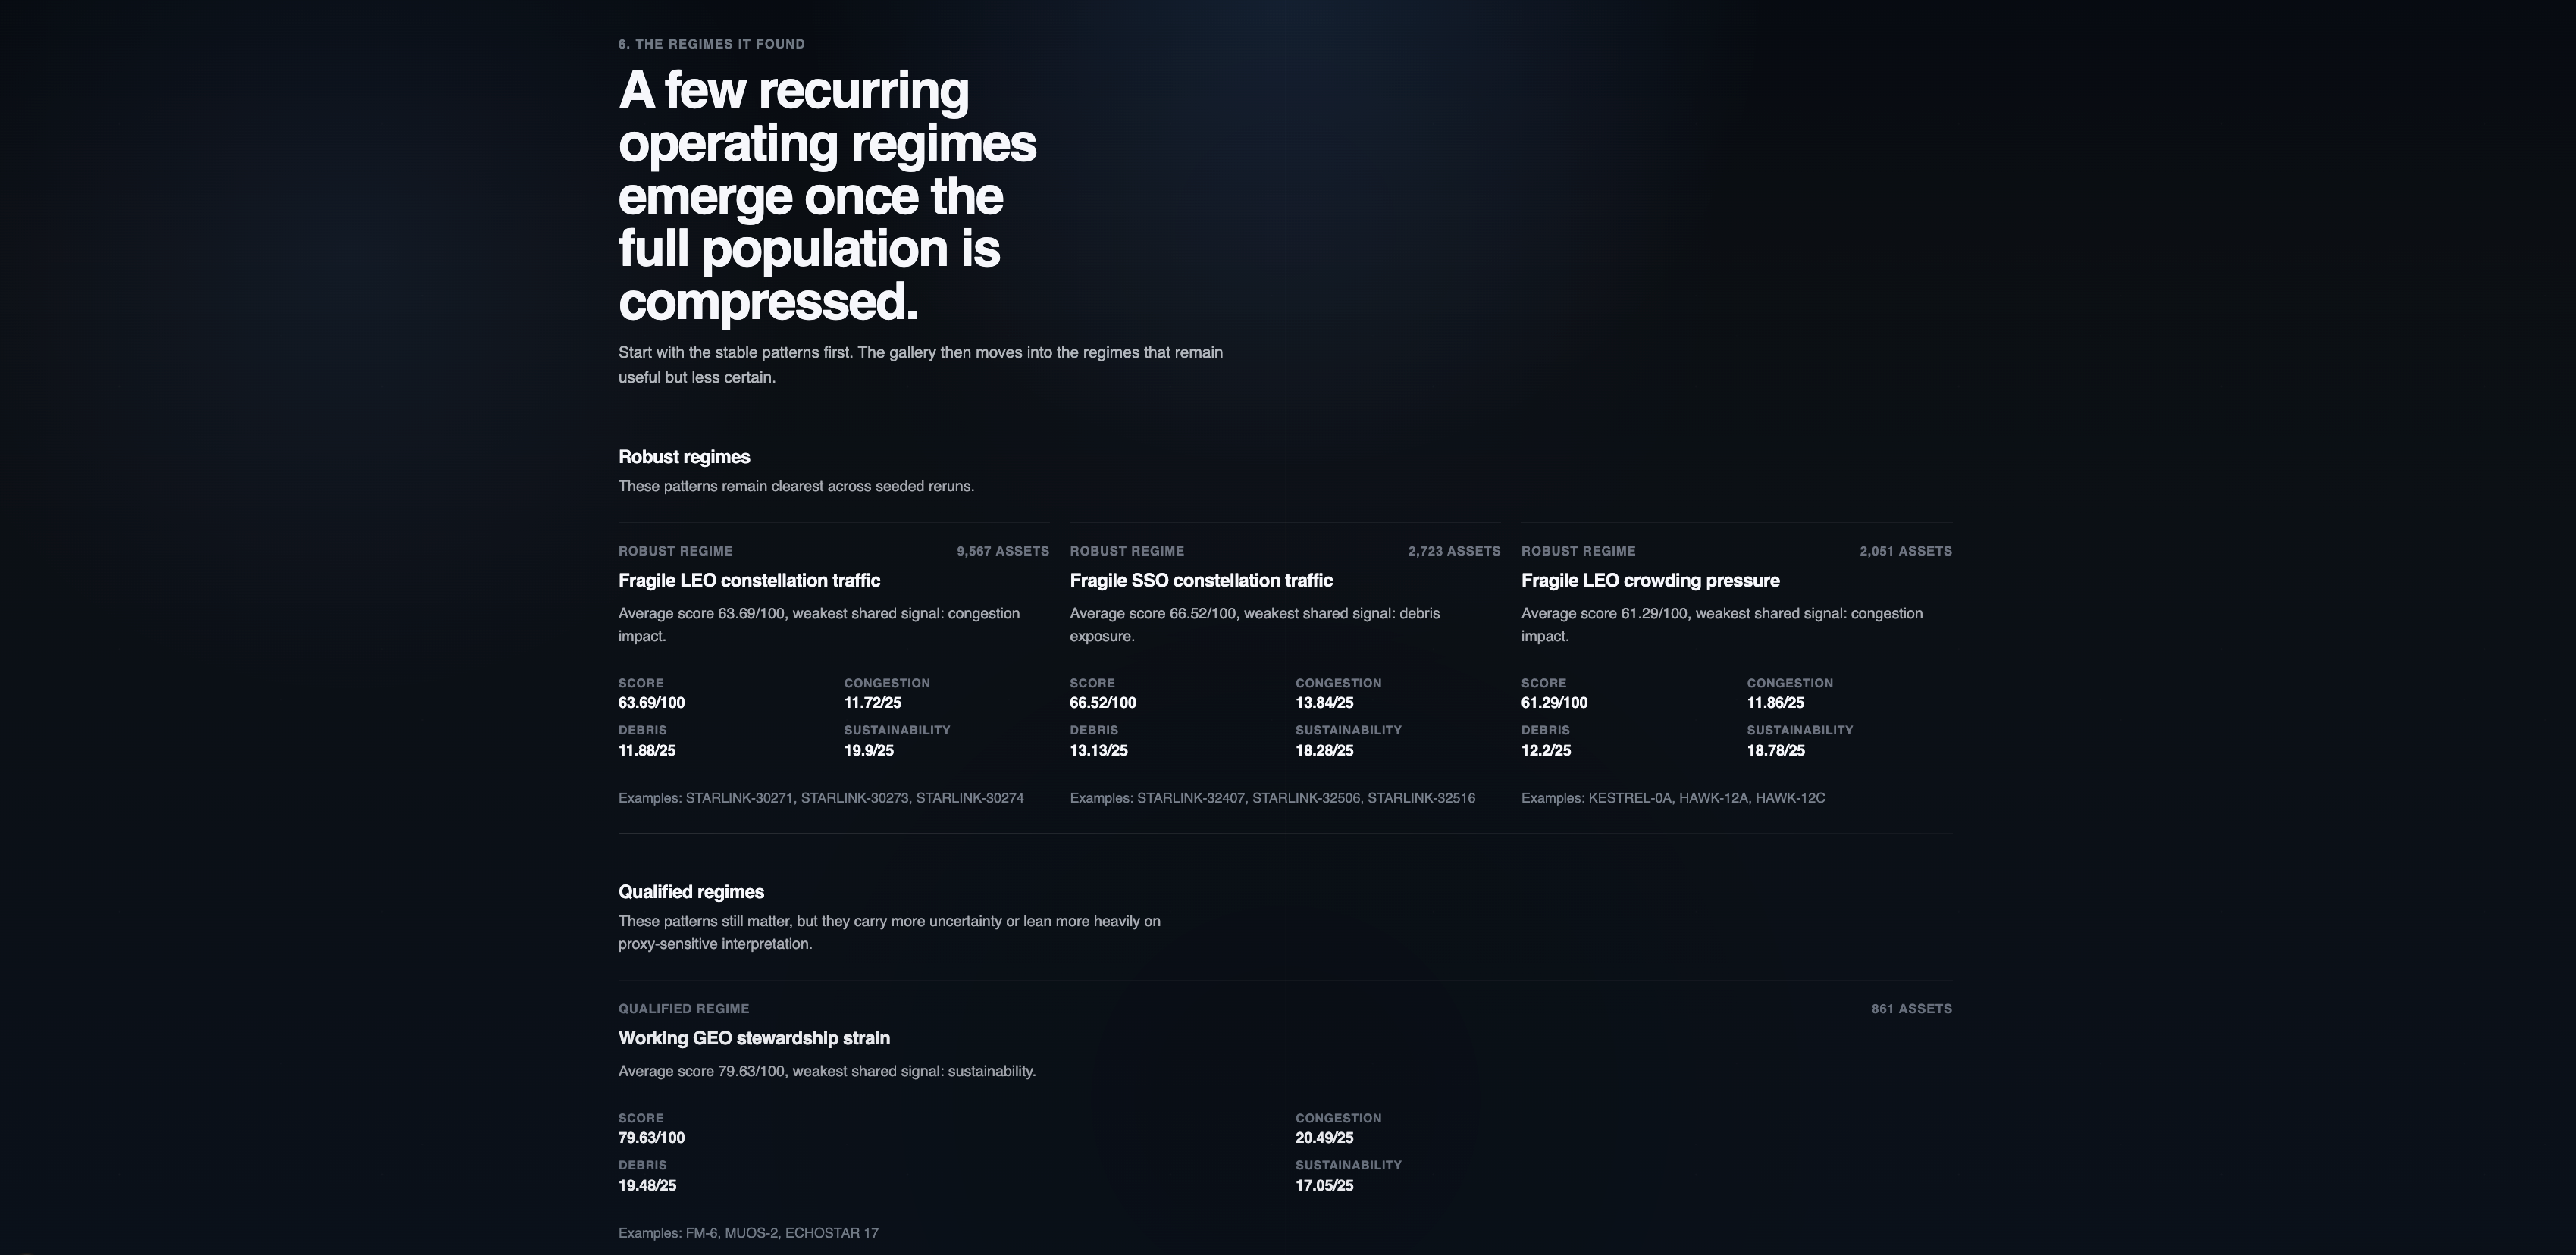
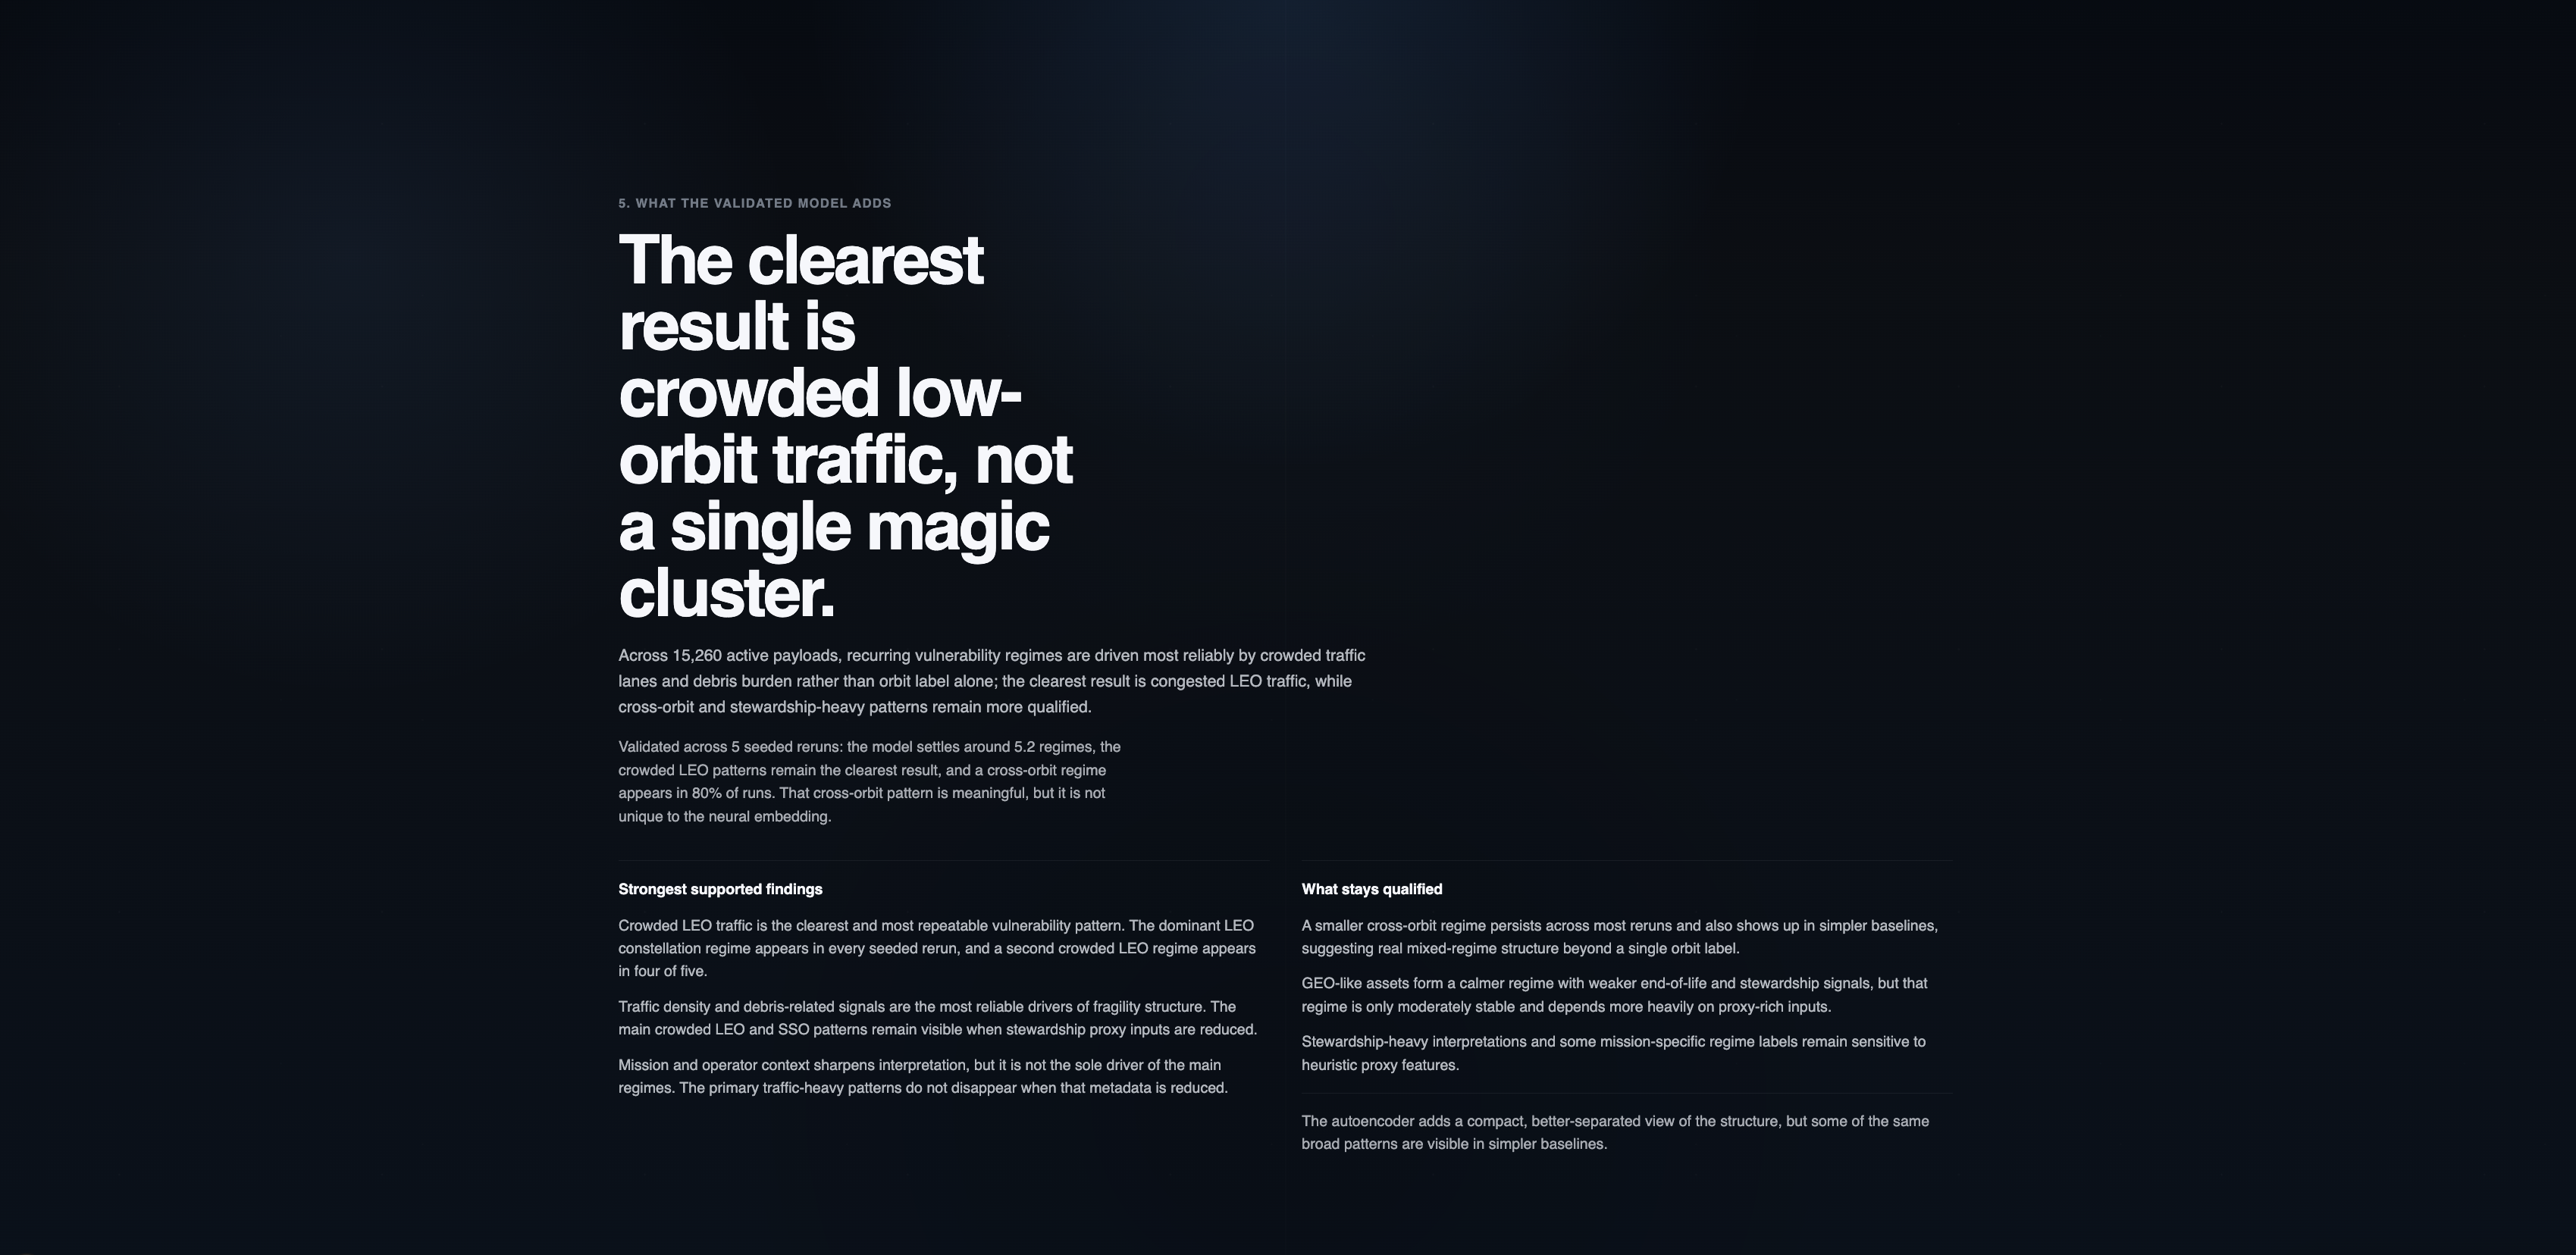
- and finally by showing what a validated ML pipeline found across a much larger population of satellites
Behind the narrative shell, the project analyzes 15,260 active payloads and identifies recurring operating regimes rather than treating every satellite as an isolated point in space.
How I built it
I built the front end as a long-scrolling interactive essay using Next.js, TypeScript, and Cesium. The goal was to make the project feel more like a guided visual story than a dashboard.
Behind that, I built a separate research pipeline in Python with:
- canonical satellite records
- explicit source provenance
- feature engineering for orbital, traffic, debris, mission, and stewardship signals
- a PyTorch autoencoder for representation learning
- clustering and anomaly scoring
- validation across seeds, baselines, and ablations
One important design decision was keeping the narrative layer and research layer separate. The app only consumes exported summary artifacts, while the heavier ingest, modeling, and validation logic live in the research pipeline.
Challenges I ran into
The hardest part was not the visualization — it was making the research claim honest.
I had to:
- separate the curated narrative sample from the broader research dataset
- track which inputs were direct, derived, or heuristic
- avoid overstating NASA-derived data coverage
- remove source-leakage features that made the model pick up dataset differences instead of orbital structure
- validate whether the learned regimes were actually stable instead of just interesting on one run
That changed the project a lot. It pushed it from being only a polished visualization into something much closer to a defensible research product.
Accomplishments that I'm proud of
I’m proud that the final project is both readable and technically serious.
The strongest result is that crowded low-Earth-orbit traffic is the clearest and most repeatable vulnerability pattern. More broadly, the project shows that orbital fragility is driven most reliably by traffic density and debris burden, not just by orbit label alone.
I’m also proud that the project stayed visually cohesive even after adding a real research layer. It still feels like a narrative experience, not a notebook or dashboard pasted into a website.
What I learned
I learned that the most interesting patterns are not captured by orbit labels alone.
Recurring vulnerability structure exists beyond simple categories, but not every interpretation is equally strong. Traffic and debris are the most reliable drivers. Mission and operator context sharpen the interpretation. Stewardship-heavy readings are useful, but they need to stay qualified because they depend more on proxy features.
I also learned that validation matters just as much as modeling. The autoencoder gave the cleanest compressed view of the structure, but simpler baselines still recovered part of the same pattern. That made the final claims much more careful and much more credible.
What's next
The next step would be expanding data coverage further, improving more directly grounded debris and operating-environment features, tightening schema validation for exported research summaries, and producing stronger static figures for presentations and papers.
But the core takeaway already stands:
space only looks empty until you see the highways.
Built With
- celestrak-active-satcat-data
- cesiumjs
- css
- json
- nasa-derived-orbit-windows
- next.js
- numpy
- pandas
- python
- pytorch
- react
- scikit-learn
- typescript

Log in or sign up for Devpost to join the conversation.