-
-
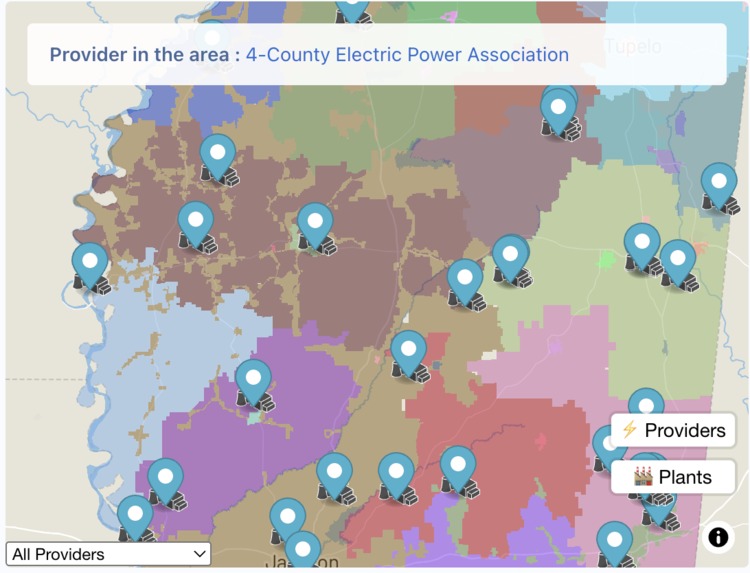
Electricity rates and nearby generators


Transmission Project Community Impact Dashboard
Project Overview
Our Transmission Project Community Impact Dashboard is a comprehensive web application that visualizes the economic, social, and environmental impacts of major electrical transmission infrastructure projects across Louisiana and Mississippi. Built for transparency and community engagement, this platform transforms complex data into accessible, interactive insights.
Key Features
📊 Multi-Layer Data Visualization
- Economic Impact Analysis: Real-time visualization of construction output, operations revenue, and property tax benefits across parishes and counties
- Demographic Insights: Census data integration showing population, income, poverty rates, unemployment, and education levels
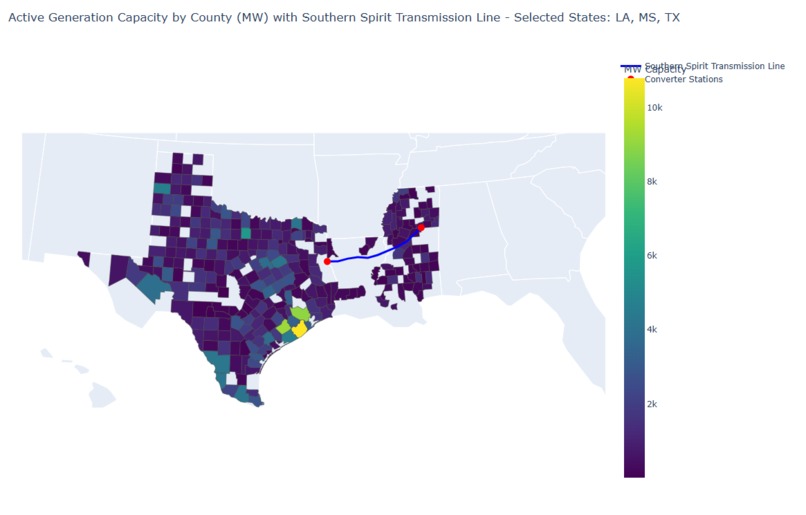
- Energy Infrastructure Mapping: Interactive display of existing and planned energy projects with capacity and type information
🗺️ Interactive Mapping Platform
- Google Maps Integration: High-resolution boundary data for Louisiana parishes and Mississippi counties
- Dynamic Layer Switching: Toggle between economic, demographic, and energy infrastructure views
- Smart Color Coding: Intuitive visualization schemes that highlight disparities and opportunities
🔬 Citizen Science Integration
- Community Reporting: Direct integration with Google Forms for environmental monitoring
- Real-time Feedback: Air quality, noise, water quality, and wildlife impact reporting
- Transparency Tools: Public access to community concerns and project responses
📈 Advanced Analytics
- Employment Trend Analysis: Historical unemployment data with trend indicators
- Comparative Analysis: Side-by-side comparison of Louisiana and Mississippi impacts
- Predictive Insights: Data-driven projections for community benefits
Technical Innovation
🚀 Modern Tech Stack
- Next.js 15 with App Router for optimal performance
- Server-side data processing for real-time CSV analysis
- Responsive design with Tailwind CSS and shadcn/ui components
- Real-time state management for seamless user interactions
🔗 Data Integration
- Multiple data sources: Census Bureau, energy project databases, employment statistics
- Automated data processing: CSV parsing and analysis on-demand
- Fallback systems: Robust error handling with alternative data sources
Impact & Value
🏛️ For Government & Utilities
- Stakeholder Engagement: Transparent communication of project benefits
- Data-Driven Decisions: Evidence-based planning and resource allocation
- Community Relations: Proactive response to citizen concerns
🏘️ For Communities
- Economic Transparency: Clear understanding of local economic benefits
- Environmental Monitoring: Tools for tracking and reporting environmental impacts
- Civic Participation: Direct channels for community input and feedback
📊 For Researchers & Analysts
- Comprehensive Dataset: Integrated socioeconomic and infrastructure data
- Trend Analysis: Historical and predictive modeling capabilities
- Open Platform: Extensible architecture for additional data sources
Hackathon Achievement
This project demonstrates the power of rapid prototyping and data-driven storytelling. In just hours, we've created a production-ready platform that addresses real-world challenges in infrastructure development and community engagement.
Built with: Next.js, TypeScript, Google Maps API, Tailwind CSS, and modern web standards for maximum accessibility and performance.
Empowering communities through data transparency and interactive engagement.
Built With
- next.js

Log in or sign up for Devpost to join the conversation.