-
Homepage
-
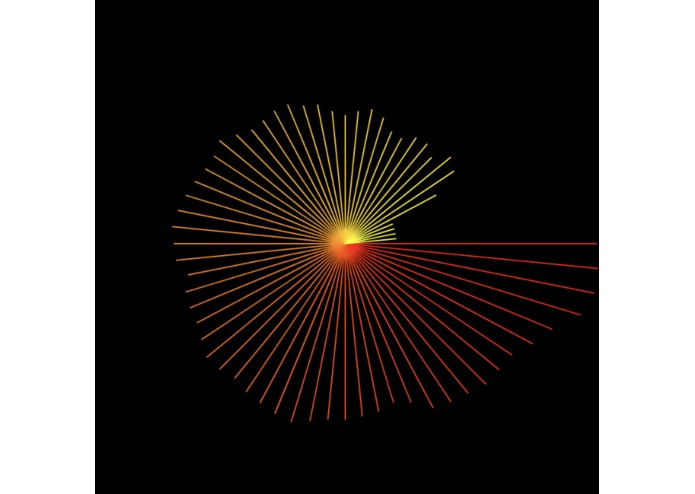
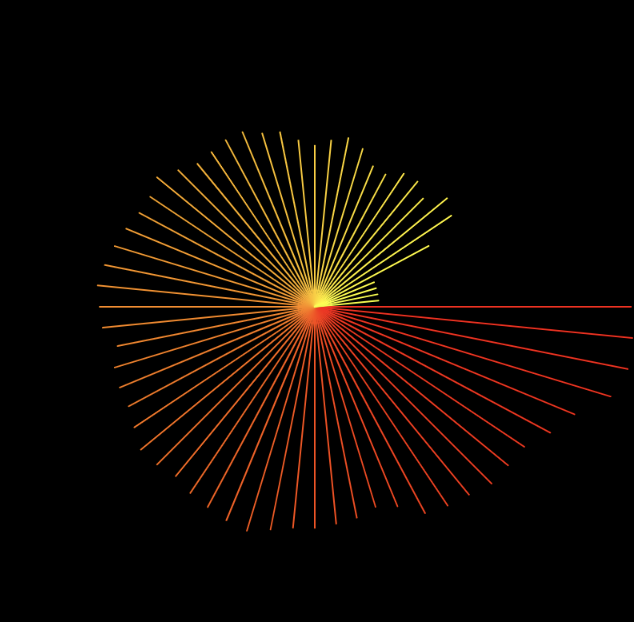
Fast Fourier Transform (Radial)
-
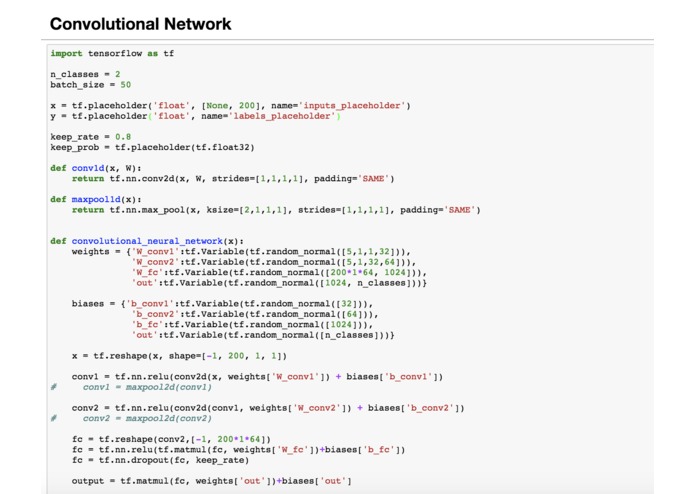
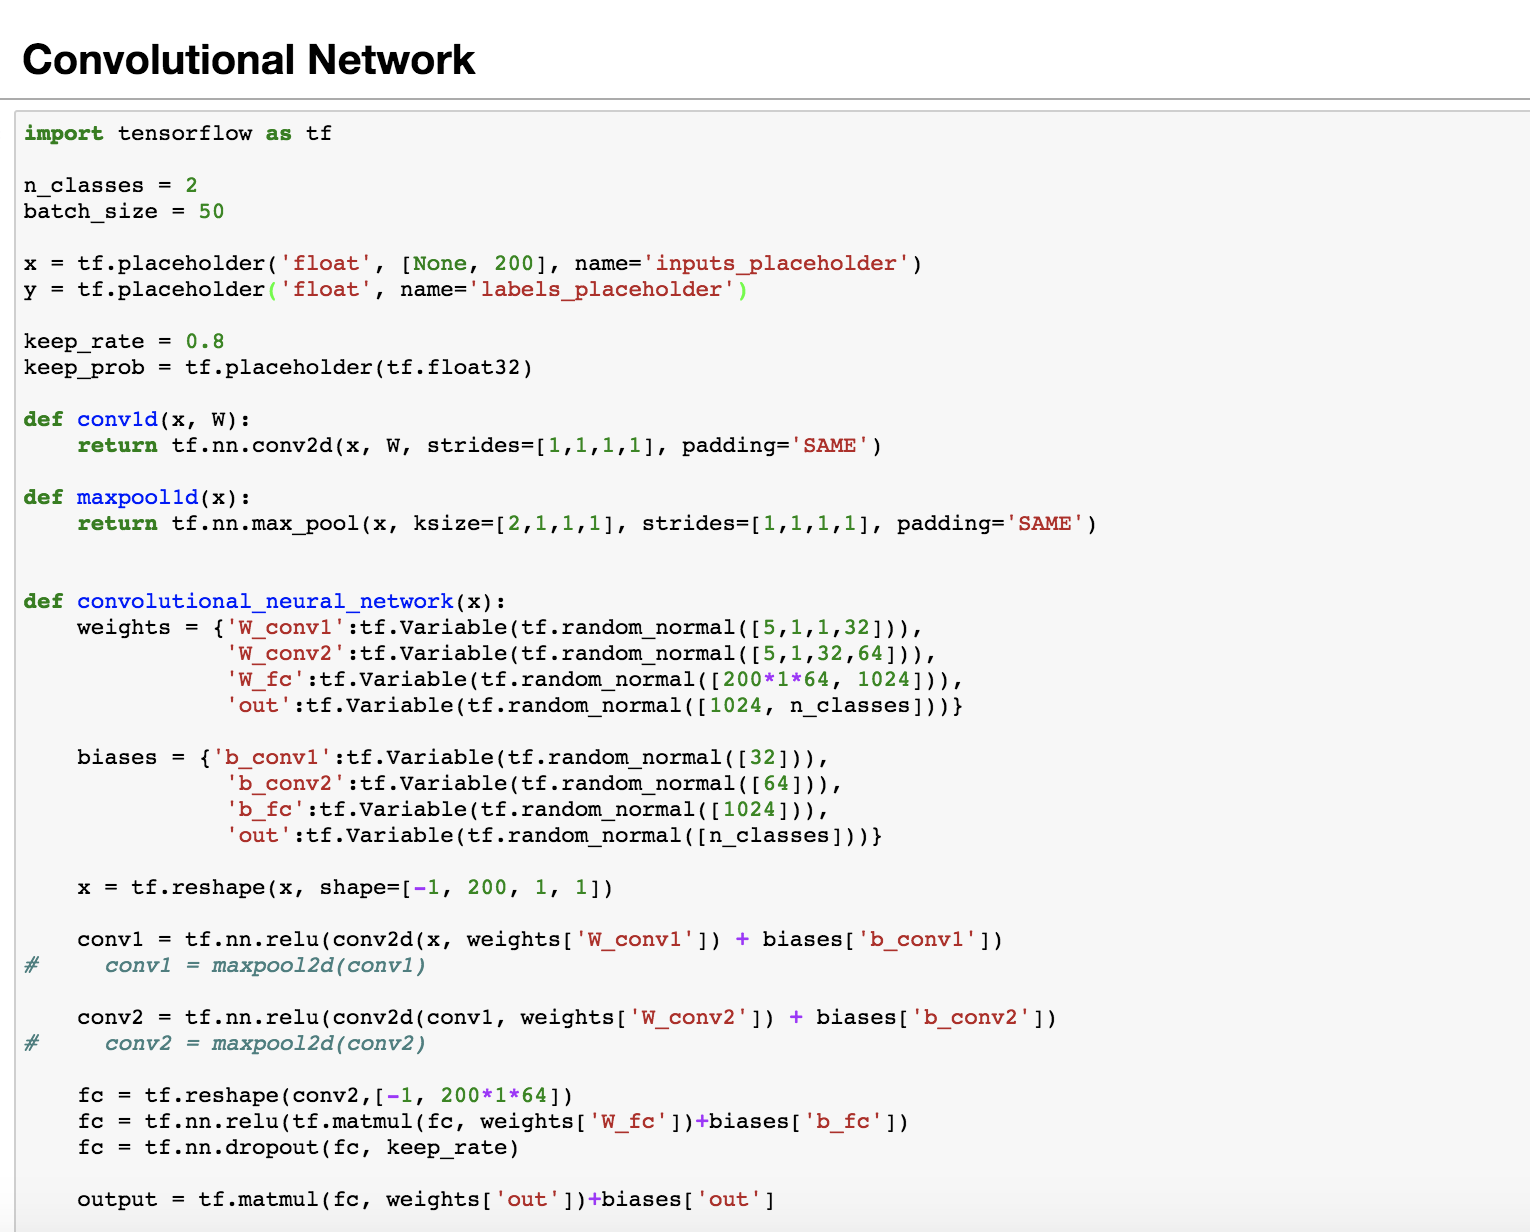
Convolutional Network
-
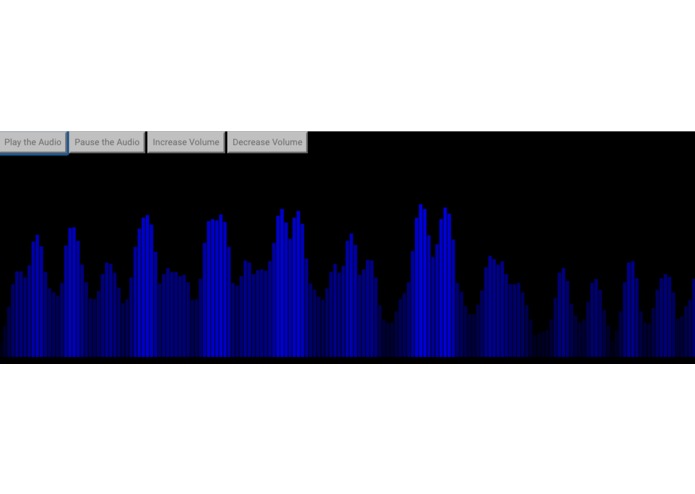
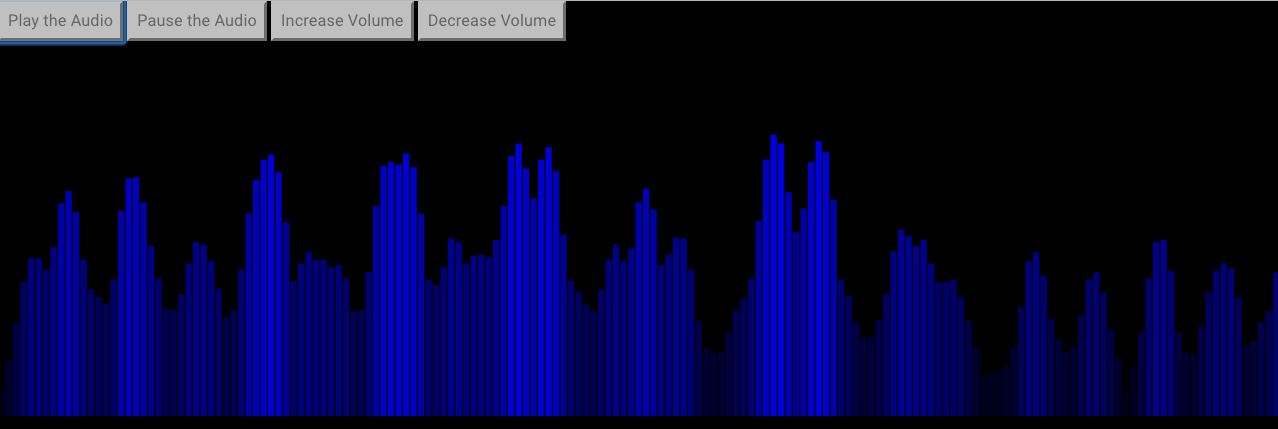
Tone detection- Music visualization
Inspiration
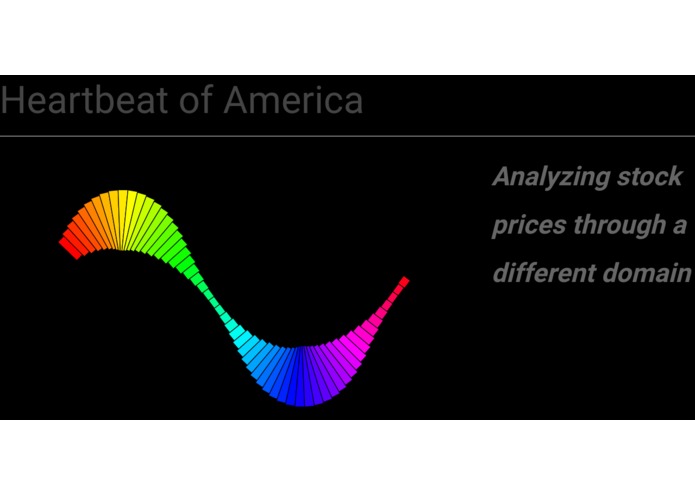
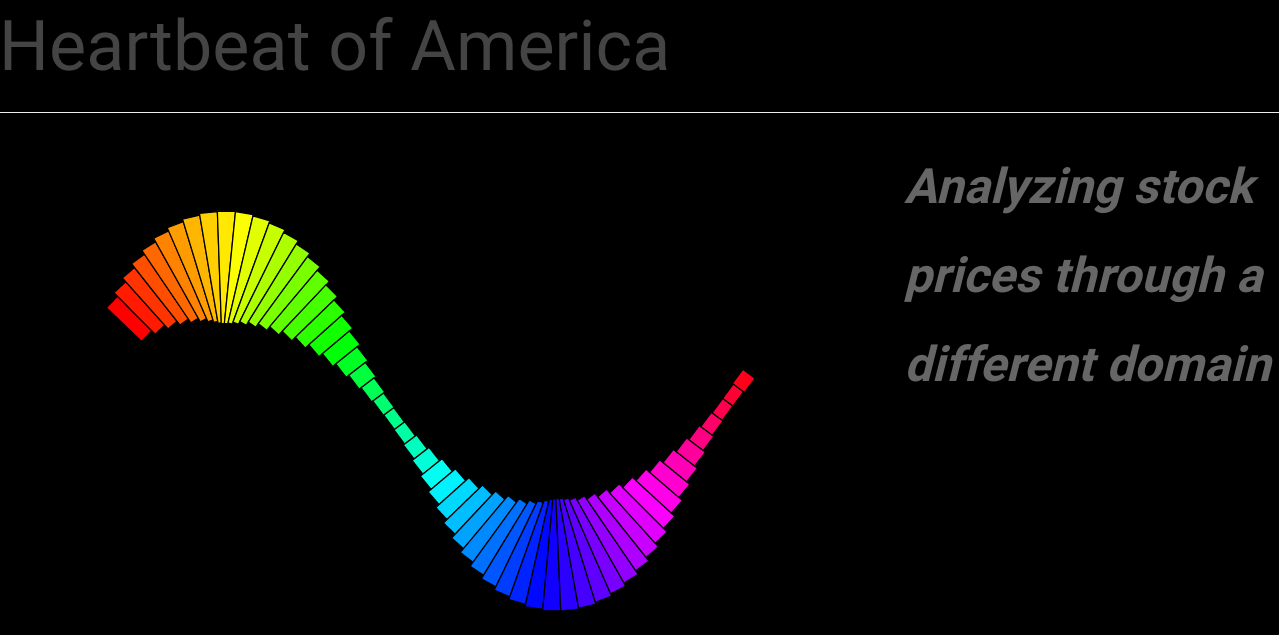
We wanted to work with financial data, but wanted to approach the problem in a novel manner.
What it does
It converts stock prices to sound and more generally frequencies; then performs signal processing algorithms to analyze the data.
How we built it
We used Python (Pandas, Numpy, Scipy) to gather, format, and convert the stock price data from the Nasdaq API into frequencies. We also used Tensorflow to implement a convolutional neural network that would classify frequencies into industries. We then used Flask to build the webapp, as well as using D3.js and p5.js for the graphs and visualizations.
Challenges we ran into
Preprocessing and cleaning the dataset required tedious techniques to use the data, as certain companies had missing values.
Accomplishments that we're proud of
We're proud of creating effective and aesthetic statistical visualizations that look at stock prices in a different manner. We definitely believe that more research can be done in this field to provide valuable insights.
What we learned
We expanded our knowledge on creating visualizations and also learned about signal processing and sound analysis techniques as well more applications in data science.
What's next for Sound of Money
We would like to continue our analysis with this sound data, we're in the process of improving our convolutional network to a convolutional recurrent neural network which has been used for feature extraction.

Log in or sign up for Devpost to join the conversation.