-
-
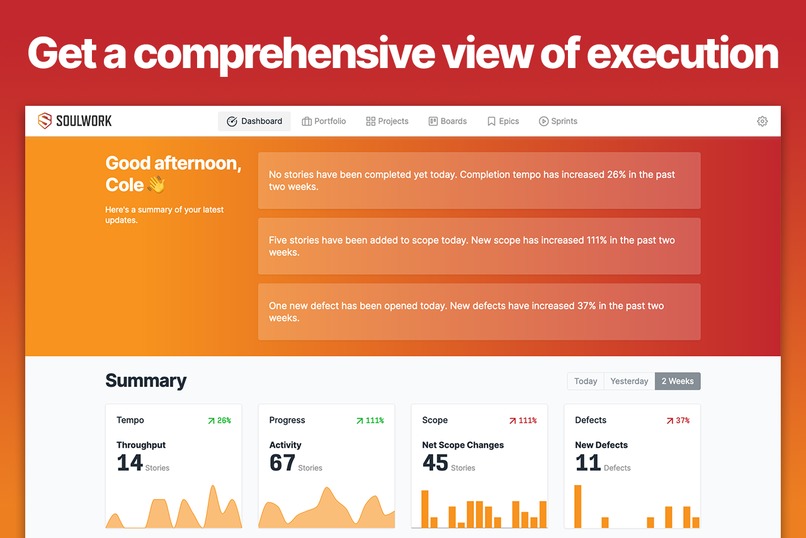
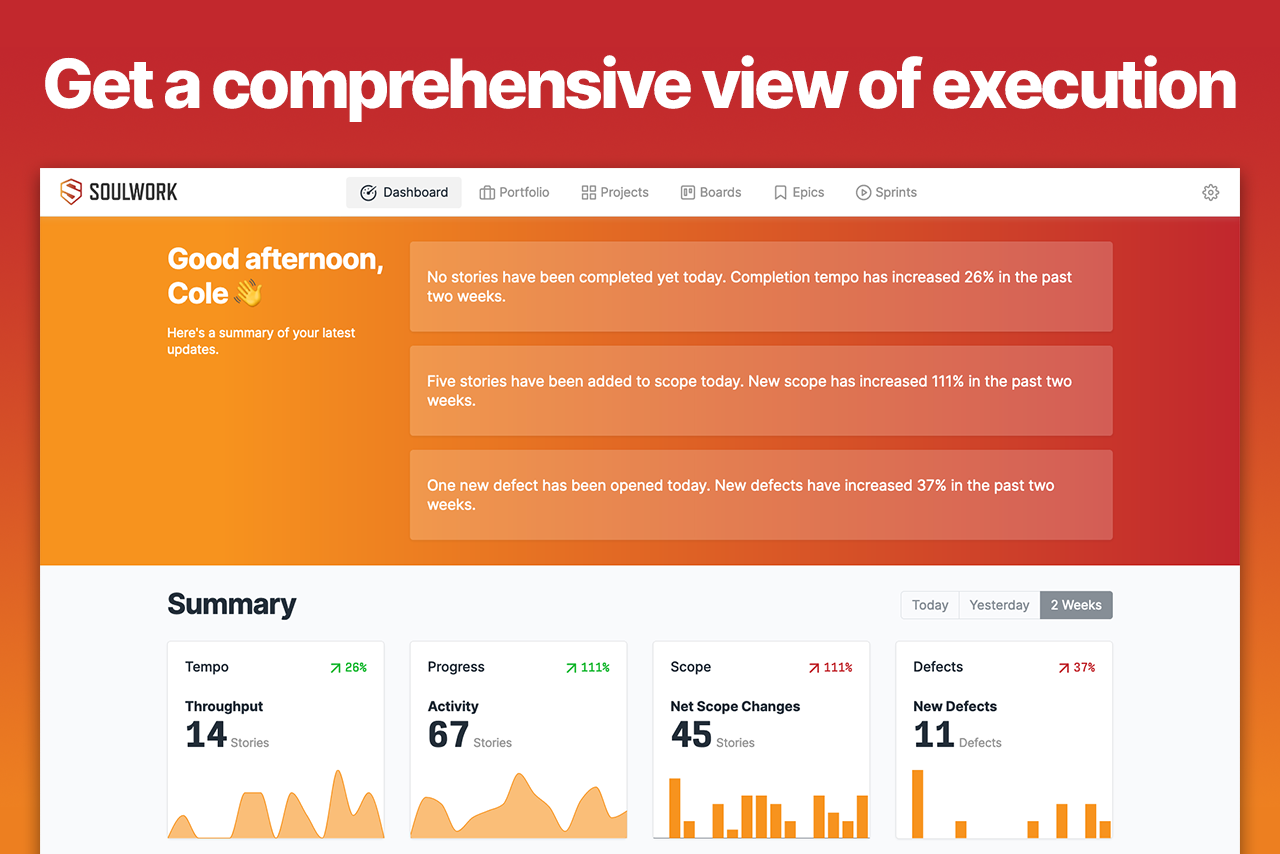
The dashboard shows an aggregated summary of all your work in Jira.
-
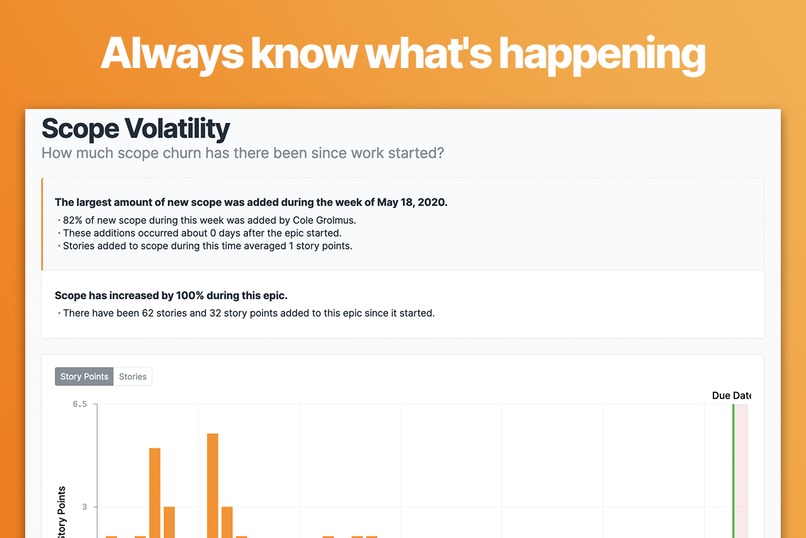
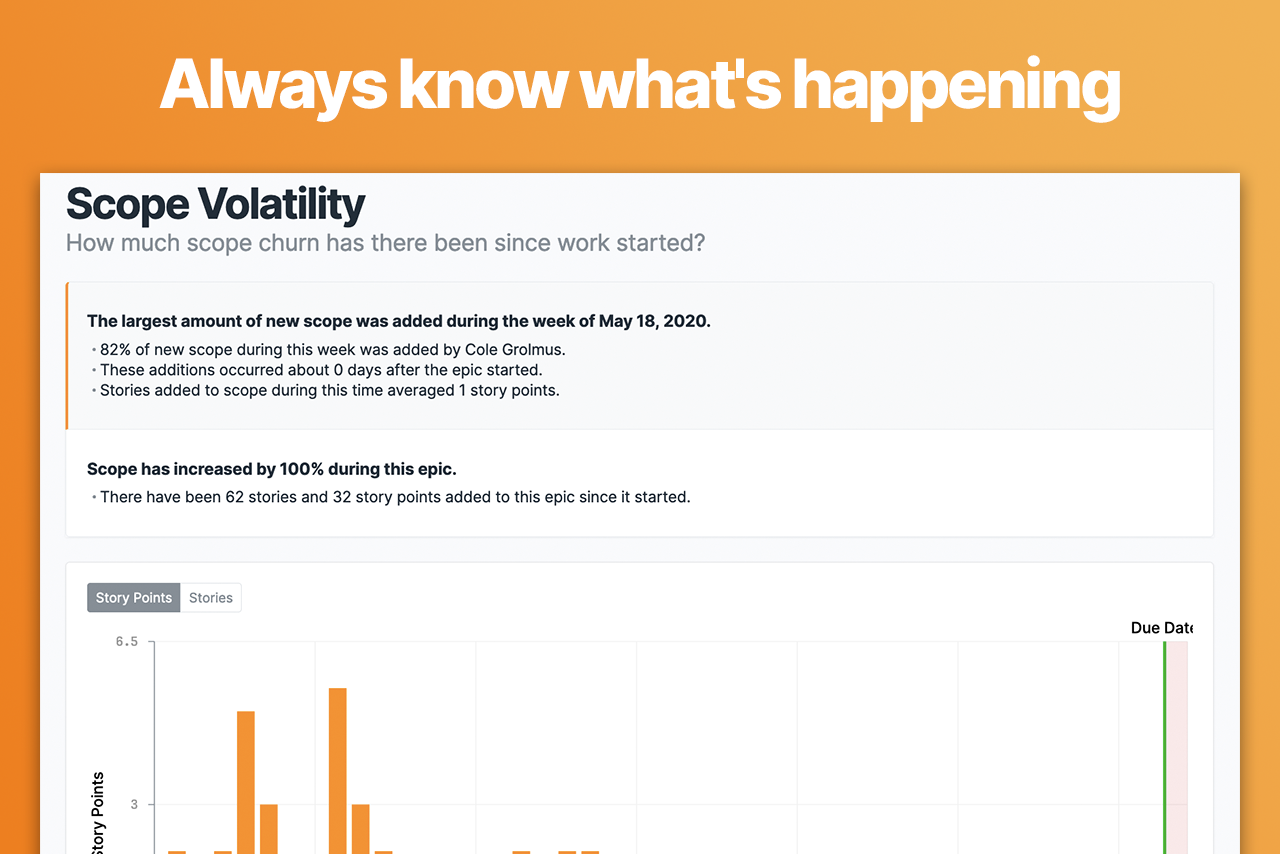
Insights give you updates about information and events you care about and interpret what is causing them.
-
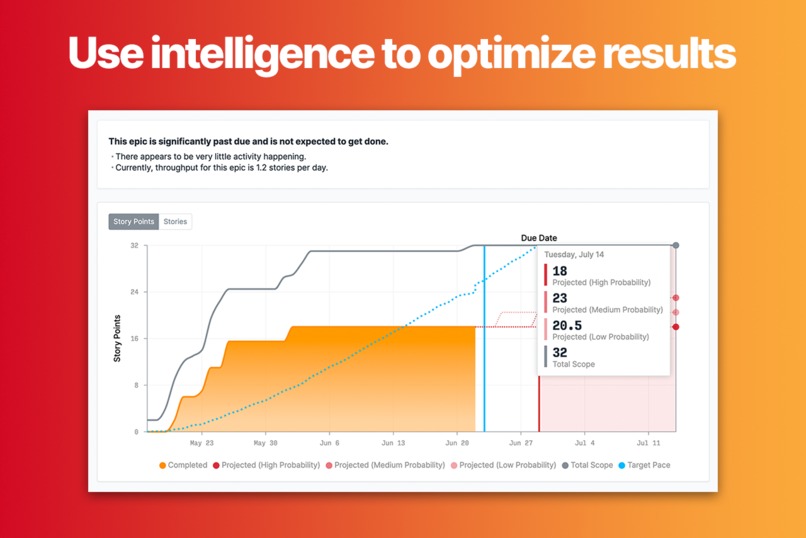
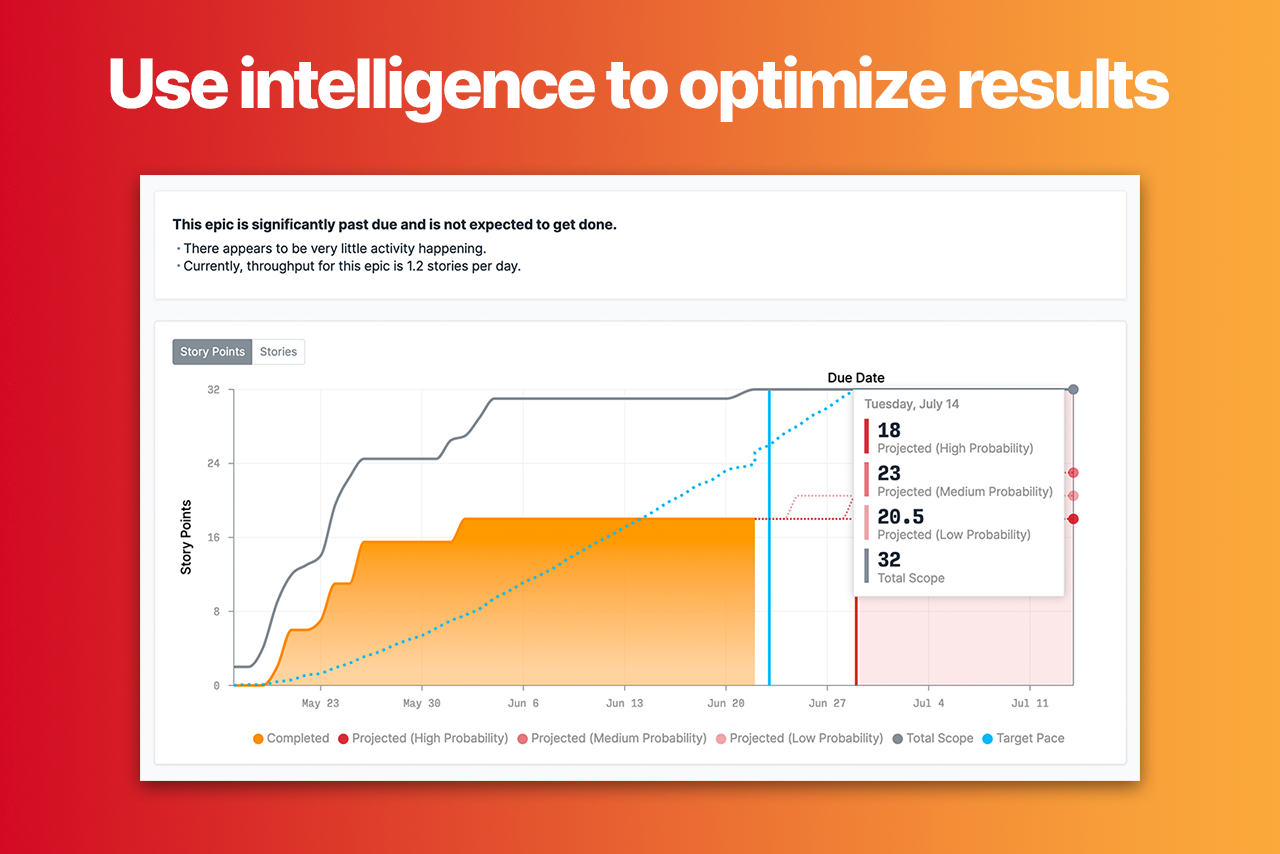
Artificial intelligence predicts outcomes of sprints and epics, identifies atypical time in status, and forecasts delivery tempo.
-
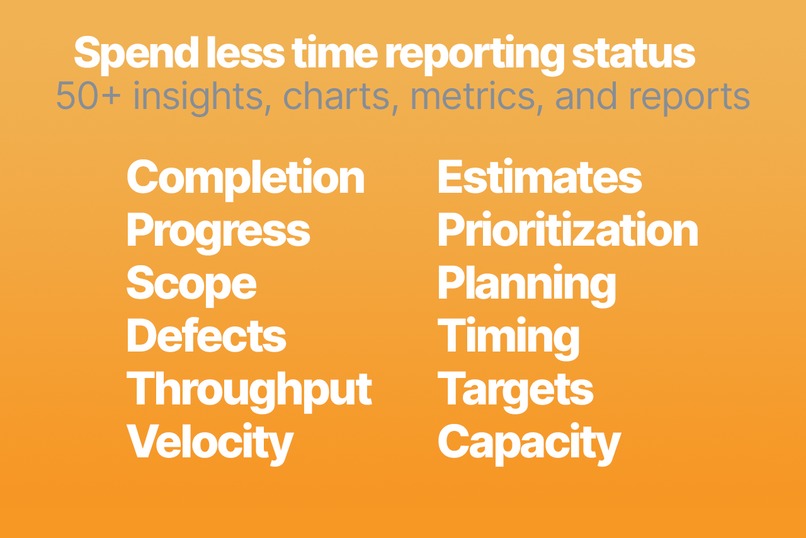
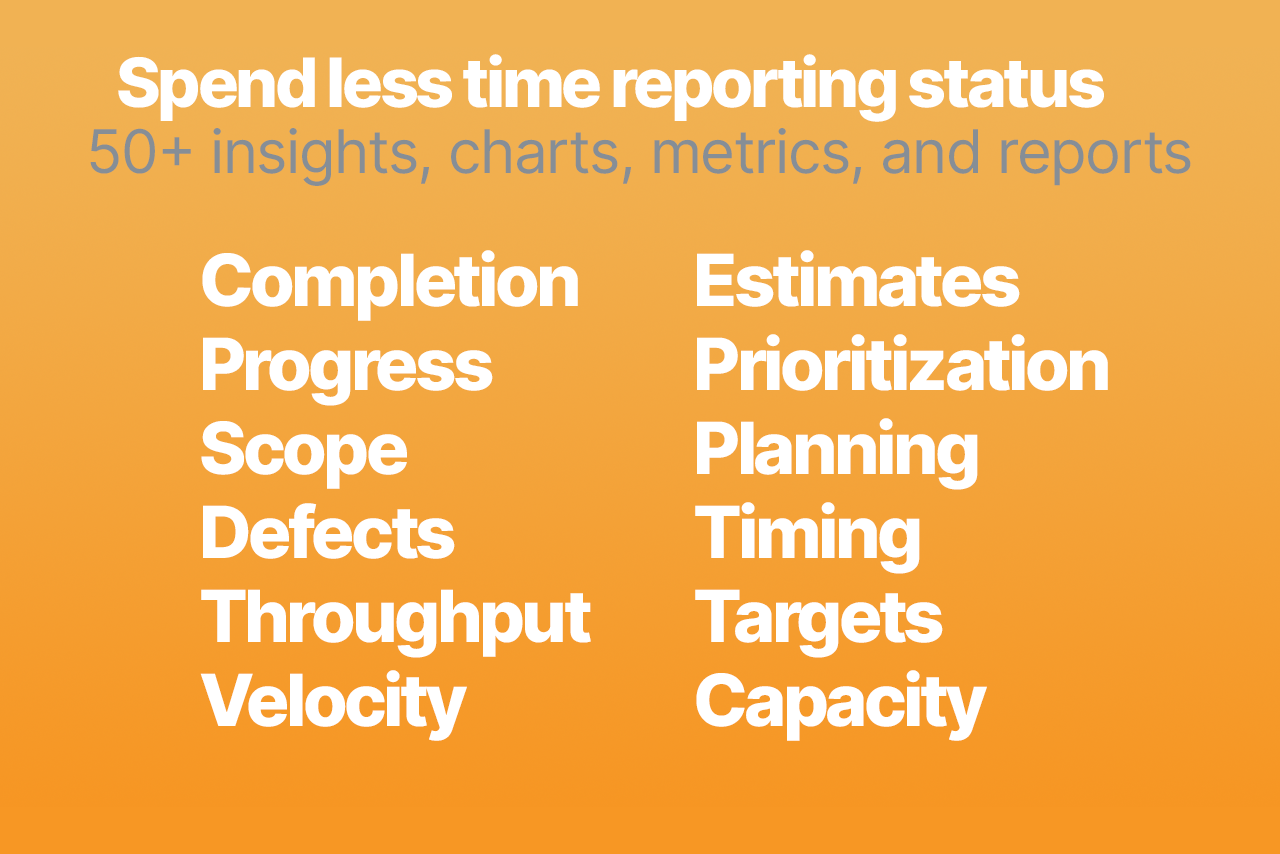
Spend less time reporting status. Efficiently build professional status dashboards, metrics, and visuals.
-
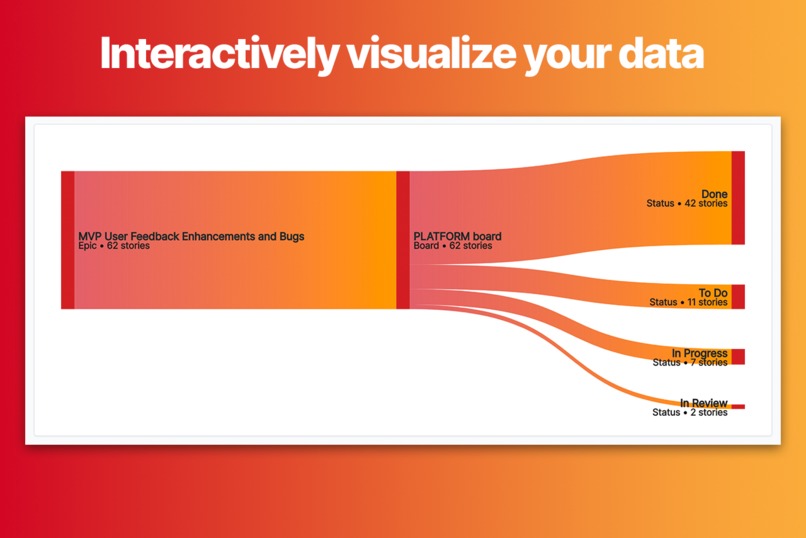
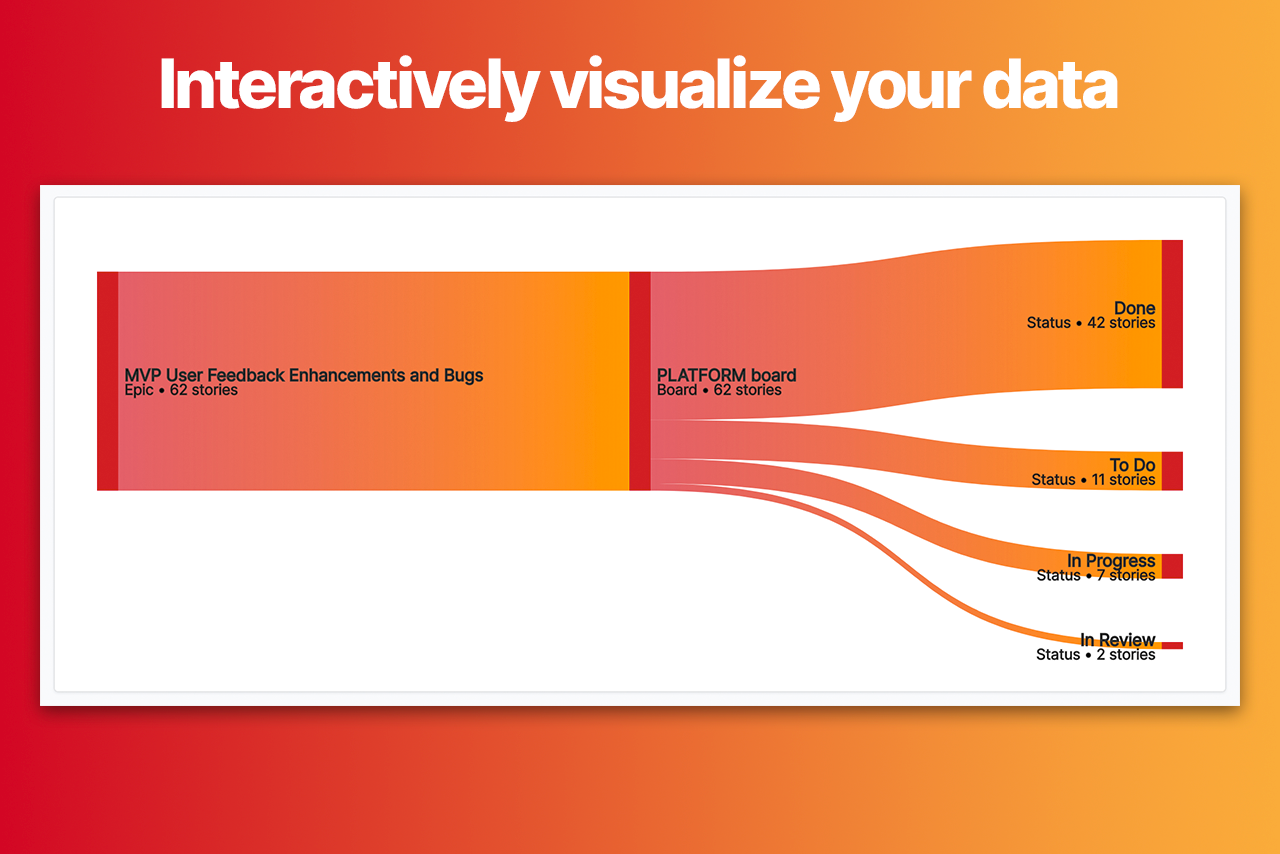
Visualize your data and workflows with interactive charts and graphs.
-
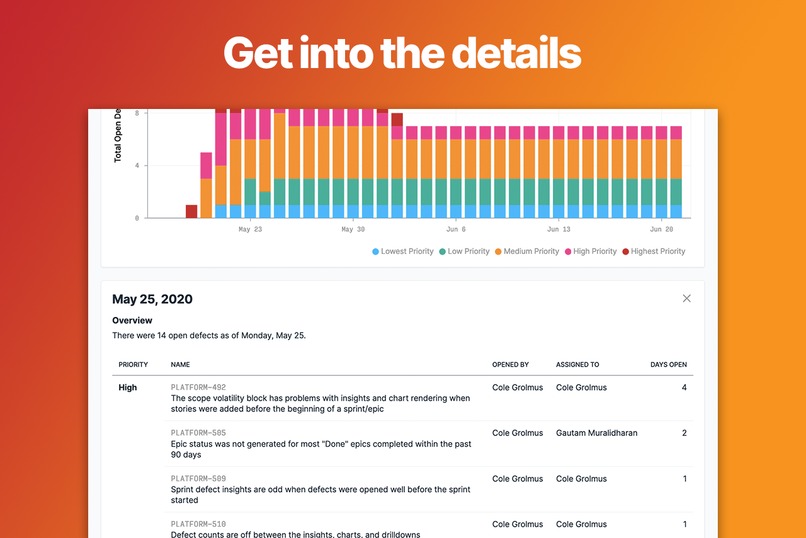
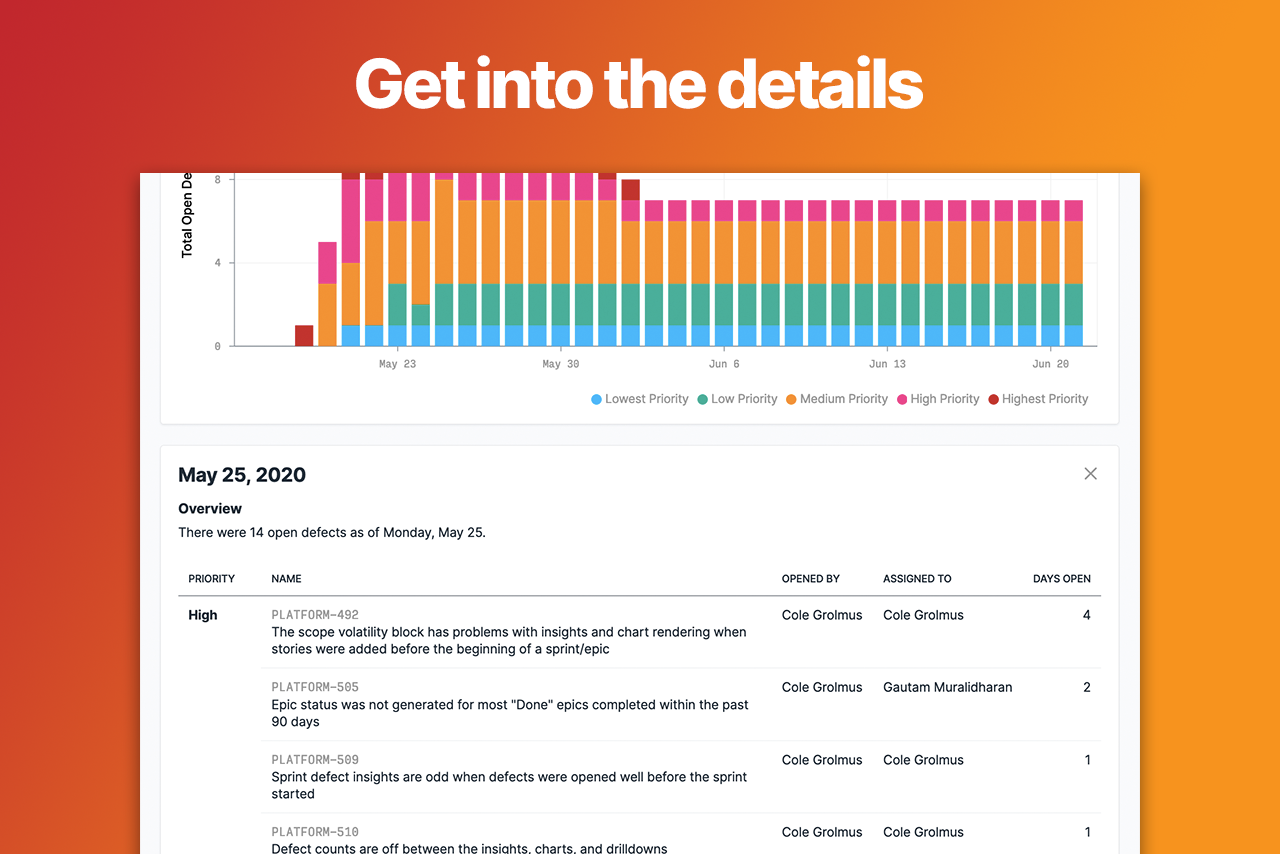
Get into the details. Understand and explain the details behind execution with data, metrics, and trends.
-
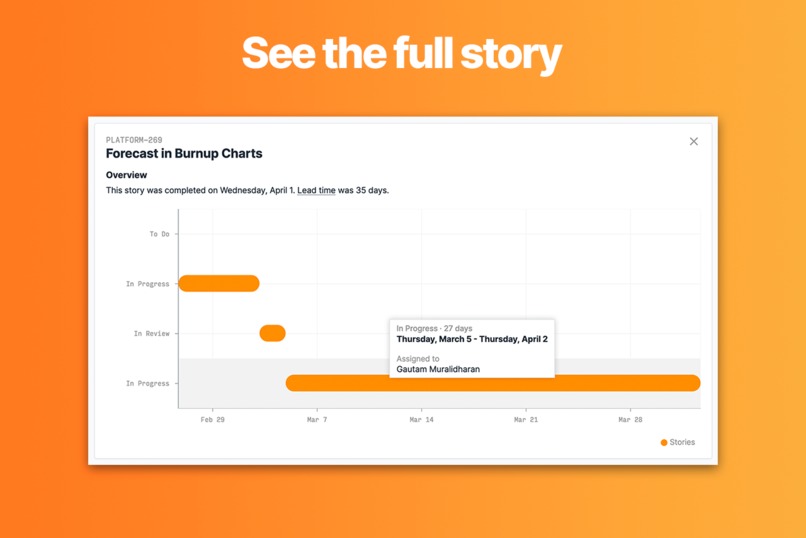
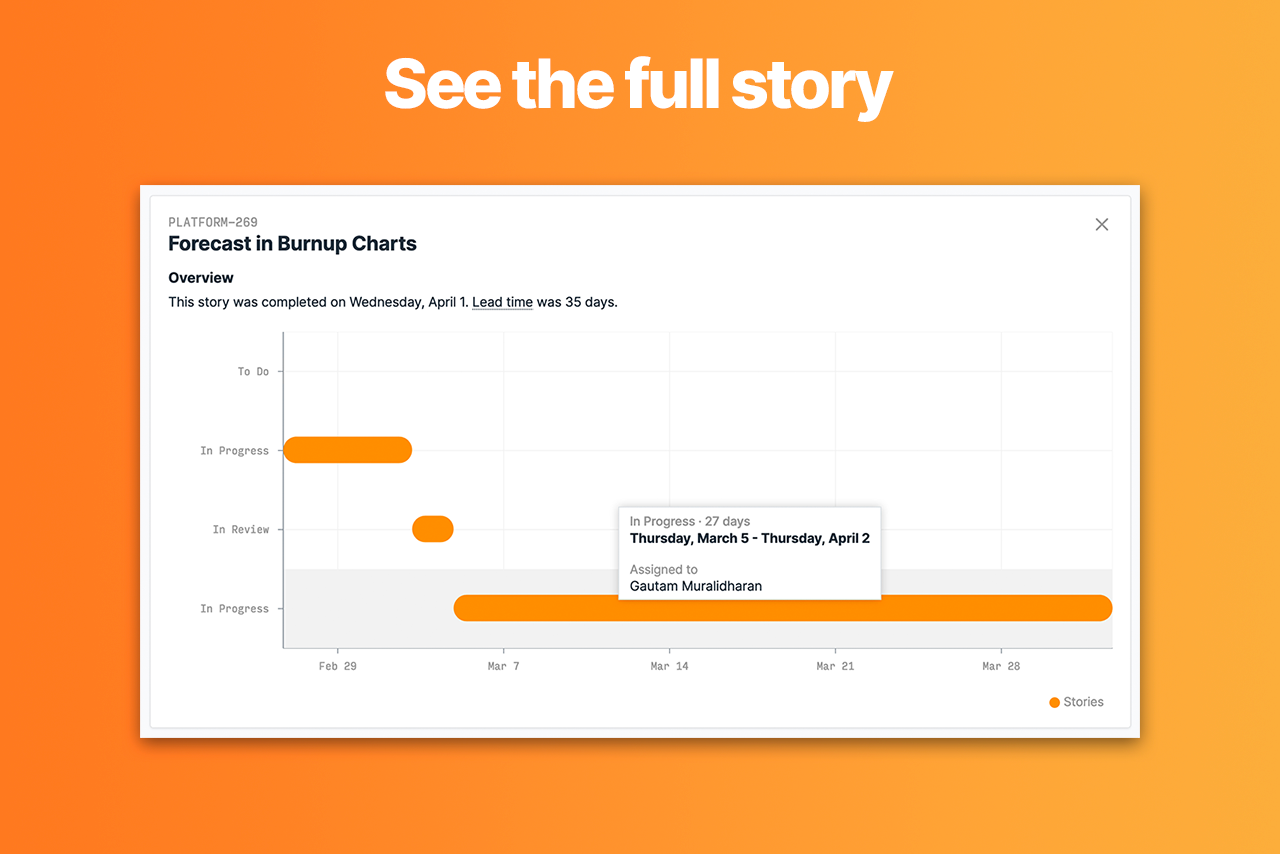
Visualize your issue history in detail with our advanced timeline. Get additional details and see a unified timeline of events.
-
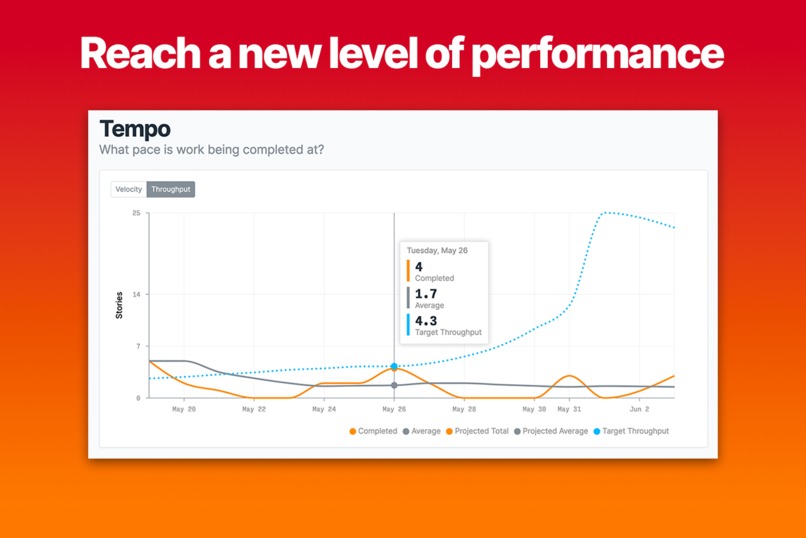
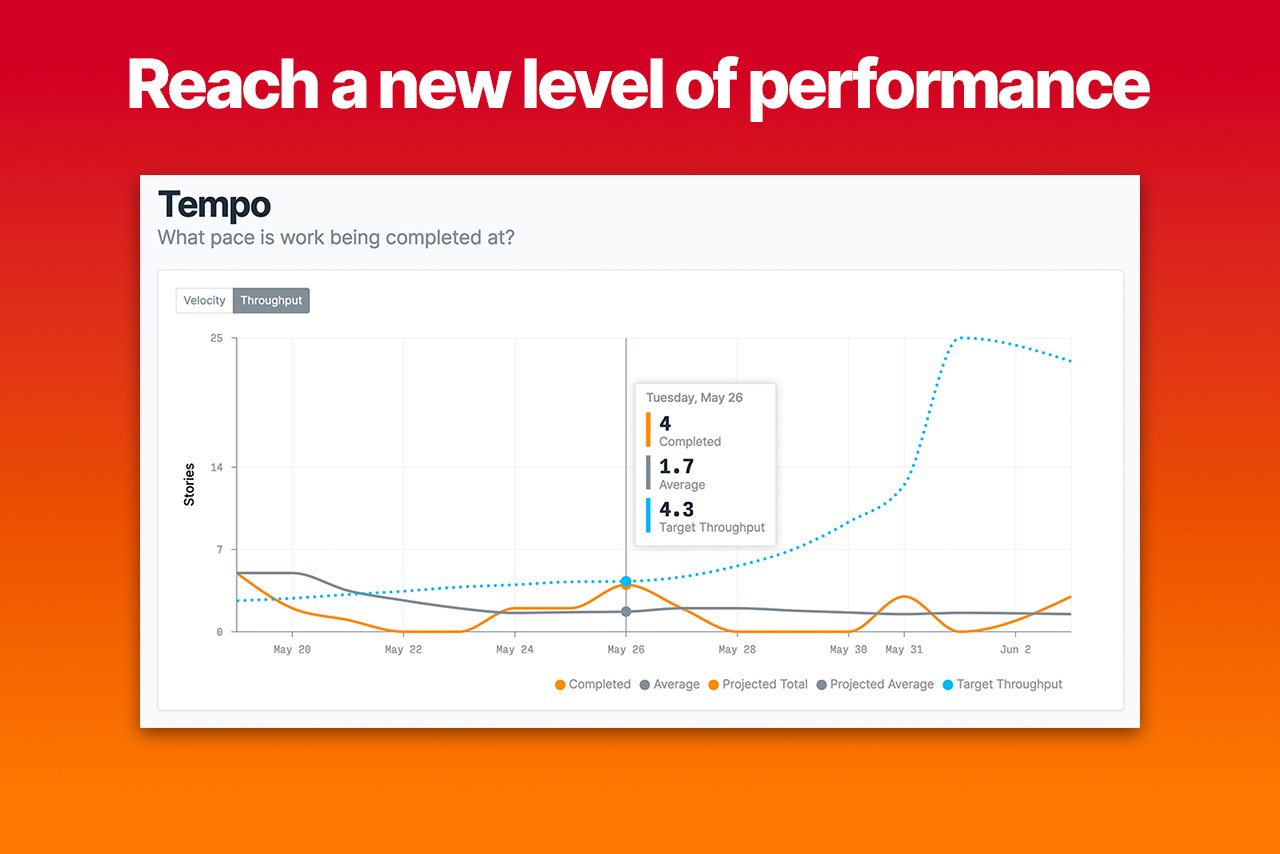
Reach a new level of performance. Grow and scale good practices across your team.
Inspiration
Building software is one of the greatest professional challenges a person can face. Doing it successfully is rare and full of obstacles. It's incredibly impactful and rewarding when done well.
Anyone who has led a software project has experienced a wide range of emotions: joy and frustration, pride and disappointment, confidence and fear.
Let's face it, leading a software project is hard. There is too much activity happening too quickly. Our projects are big, fast, and overwhelming. We can't possibly keep up. So, we blame our tools, our culture–or worse, the people we work with.
There are so many great tools for building software. Let's give leaders and managers world class technology for managing software projects.
The knowledge, information, and data we need to be successful is there for us–it's in the tools our teams use every day. But we're not able to access its full potential.
We need to put it all together. We need it summarized and to the point. And we need it to adjust on the fly, because nothing ever goes as planned.
With the right technology, we all can be the leaders we want to be. The leaders our teams and companies deserve. That's Soulwork.
What it does
Soulwork gives you the status of your software projects in one place. It analyzes your project data and tells you the story about how you're executing–good or bad. It centralizes data from Jira and organizes it into information your teams can use to make decisions about how to execute.
The story starts with a dashboard–all of the most important activities and information about your projects. It summarizes your most important metrics and trends. It gives you a prioritized and interpretive list of insights: real-time updates that hit you like news headlines. It also highlights your most active epics, sprints, and issues.
From the dashboard, you can dive into the details about the status of your work. See status across your entire portfolio of projects, boards, epics, and sprints. Or, look closely at a single issue. The product tells you the whole story with written and visual communication. You'll see everything that matters to you: completion, defects, scope, workflows, and more.
Dashboards and status details are always kept up to date for you as your project moves along. You can spend less time reporting status and more time taking action. You'll see your work in a whole new way.
How I built it
We used multiple frameworks and libraries to build the product. Our goal was to quickly build a reliable, highly interactive, data-driven web application on top of Jira's API.
The front end web application uses React and JavaScript. State and API data are cached in the browser using Redux. Charts are built with the ReCharts charting library.
The back end platform is built with Django. Django REST Framework (DRF) is used to provide multiple REST API endpoints called by the front end web application.
We built analytics to provide users with impactful, real-time metrics that provide a quick overview of sprint, epic, board, project, and portfolio status.
We implemented artificial intelligence for predicting delivery outcomes and detecting anomalies. We've also developed algorithms to generate insights and prioritize, filter, and organize data.
The Jira integration is built to support both Atlassian Connect and OAuth2 for authorization to customer data. Data is stored in a Postgres database. The application and database are hosted on Amazon Web Services (AWS).
Challenges I ran into
When building the product and through discussions with customers, we learned that:
- There is a lot of data in dev tools. Leaders and managers get overwhelmed using this data to make planning and execution decisions.
- Charts alone are difficult to understand–especially advanced agile charts. Interpretation with both written and visual communication is most effective.
- Developers want to focus on delivery without interruptions for meetings or status updates. They will diligently use and maintain Jira if leaders and managers can get the information they need from it.
Accomplishments that I'm proud of
- We applied years of our combined management education, training, and experience to build a product.
- We learned from past mistakes and built smaller batches of code that were released more frequently. We made progress faster.
- Other companies are using our product to help their own teams deliver better and be more successful.
What I learned
- We learned the Jira REST API in detail while building the product. This understanding helped us translate the data into the best possible information for leaders, managers, and their teams.
- We increased our knowledge of data science and artificial intelligence and applied it to a problem domain we care deeply about.
- We advanced our understanding of agile and DevOps significantly. We've taken the best of what we've learned and developed features that help others build better behaviors and processes for their own teams.
What's next for Soulwork
New Insights, Charts, and Recommendations
Adding insights and charts gives teams the ability to learn more about their processes, what they're doing well, and where they can improve. We're planning to take this further by giving teams new ways to act on recommendations provided by our insights.
Additional Integrations
We're building integrations for additional tools throughout the delivery pipeline. Teams get better information when combining data from Jira with other integrations like Bitbucket, Bamboo, Confluence, and more.
Jira UI Integration with Atlaskit
We plan to integrate more deeply with Jira's user interface using native Atlaskit components. Natively adding our platform's text and visual insights to Jira is a better experience for users. They're able get the information our platform provides without leaving Jira.
Built With
- amazon-web-services
- connect
- django
- django-rest-framework
- jira
- pandas
- postgresql
- react
- recharts
- redux


Log in or sign up for Devpost to join the conversation.