-
-
Model 1
-
Model 2
Overview
In a pandemic reality, professional sporting events are gearing up to lose millions in potential revenue for this season. Fears amidst the coronavirus have possibly toiled additional seasons in the coming years. Our solution aims to alleviate the burden of safely providing seats for stadiums in any sporting event. Utilizing weeks of high-level research, toying with numerous data sets, and running simulations among potential users, our team has developed an app that allows for an efficient and effective way to purchase socially distanced seating. Any stadium can implement this much-needed solution by consolidating our software into their existing team’s application. A fan can purchase a ticket through the application and rest easy knowing that the cluster of seats will be at least six feet apart from any other grouping. Additionally, contactless concessions and merchandising sales will become a reality. Fans can simply place their order for any of the vendors through the app, and then pick up their food/drink to avoid lines, foot traffic, and ultimately more outlets for infection. With our solution, attending professional sporting events becomes a reality once again. All fans will have to do is Take a Seat.
Team Members
(Read this as if you’re announcing the starting five for a basketball game)
Kevin Jugovic – Hailing from Chesterton, IN at ALMOST 6’0”, Kevin is a ferocious strategist with an emphasis on the sales process, and is always ready to elevate his intensity. Kevin has a history of completing assignments on time, with great spunk and impressive effort. He is currently a rising senior at Indiana University and plans to graduate in May 2021 with a degree in both Professional Sales and Entrepreneurship and Corporate Innovation. Kevin was the project manager and focused on clear communication between the Product and Go To Market Squads. He worked on all the deliverables from the Go Team and helped develop the presentation.
Claudia Duncan - Standing at a mighty 5'3" from Evansville, IN, Claudia Duncan is an up and coming data scientist. Drafted by the Boilermakers, she will graduate from Purdue University in May 2022 with a bachelor's degree in data science and a minor in computer science. Claudia's strong communication skills make her a great team player, and she has a hunger for success that drives her performance. Claudia served as the Pro-Squad's manager to ease connections between both squads. She developed the seating algorithm for the team's mobile app product as well as created the mock-up of the mobile app concession purchases.
Samantha Coffing - From Lafayette, Indiana, Samantha “The Tank” Coffing is a striving public relations specialist. She is currently an incoming senior at Indiana State University majoring in Public Relations and double minoring in Marketing and Music Industry Studies. Samantha has a passion for learning and success, which allows her to be a positive asset to any team. As part of the Go-Squad, Samantha has collaborated with the team to come up with ideas and create each aspect of the go-to-market plan as well as help create the final presentation.
Alex Kelleher - Spending most of his youth in Boston, Massachusetts Alex Kelleher is an aspiring business analyst. After being coerced into becoming a Bulldog he has spent the last 3 years at Butler University where he will be graduating in 2021 with a bachelor’s degree in finance with minors in data science and management information systems. Attributing most of his success to his raw determination and moderate punctuality, Alex has been an invaluable member of the Go-Squad. He’s been conducting market research to understand the complexities of the WNBA consumer market to determine how to get the most value out of the team's solution.
Rafael Pereira - Allow me to introduce you to Brazilian Rafael Pereira - avid musician yet naturally born data scientist. From the Aces Team of the University of Evansville, Rafael is about to graduate in 2021 with a Bachelor of Science in Statistics and Data Science & a Bachelor of Music Performance in Piano. Rafael’s sharp creativity and attention to detail provide him a passion for teamwork and energy to deliver good results. Involved with the Pro-Squad, Rafael has collaborated with data research, mathematical analysis, and code deployment. His skills were mainly used to interpret and discover trends in recent stadium capacity and attendance venues. This facilitated the team’s elaboration of the product demo that will make safe sporting events a reality during and after COVID days.
Hemanth Garapati - Hailing from Dubai, UAE, Hemanth is currently a junior in Computer Science at Purdue University. He built the application using Google Flutter with the seating algorithm made by Claudia Duncan. His skills were used to make the entire user experience and authentication of the application. His experience in Android development has helped to develop the Go-Squad idea into a final product.
How did you decide on this customer segment, problem, and solution?
After extensive market research, we came to a Statista study that showed a customer segment is primarily focused on women 35-50 who are passionate about the WNBA. We received data from the Indiana Fever representative, Allison Barber, which supported this finding. Our process to identify the solution was simple: we decided that the true innovation lies in adapting the in-person aspect of professional sports. Though we toyed with the idea of multiple camera angles and micing up more players, we ultimately decided that the solution should stem from finding a way to let fans enjoy a WNBA game in person. After honing in on this issue, our socially distanced seating algorithm was the most necessary change to ensure safety at sporting events. Our five weeks consisted of developing an app that allows for safe ticket purchasing, along with concession and merchandise purchases. The plan is to completely eradicate cash usage at professional sporting events, starting with a pilot program for the Indiana Fever. This solution is marketable to sports fans, though we initially believe our target market will play the largest role. Additionally, management at stadiums and parks will be itching to get their hands on our software to show fans that they value safety. https://www.statista.com/statistics/759305/wnba-women-s-nat-l-basketball-games-attendance-usa/
How did your team build and iterate on the solution?
When thinking of ideas for this challenge, our team focused on why the coronavirus caused such a big change in the coming basketball season. The largest development was decidedly the fear of being exposed to the virus and getting sick from it. Since fans are scared of getting sick due to being in a large crowd, we wanted to create a solution that allowed fans to feel safe enough to come back to the arena. The safest possibility we saw was coming up with a way to seat fans where they could social distance from one another. With each group of fans sitting six feet apart from each other, it would create a safe environment for them to watch the games in. The project management tools we used were Miro and Trello. Miro is where we fleshed out a map of all possible iterations of the application and ultimately decided on the most efficient sequence. We also created the Business Model Canvas in Miro, as the tool was easy to collaborate on. For Trello, we updated the tasks each week in the following columns: Go-Squad, Pro-Squad, Entire Team, and Completed. This tool helped us keep track of our tasks and made us conscious of everyone’s progress. Trello was key to asynchronous work, as everyone had varying schedules and timezones. For development processes and prototyping, our team used Microsoft Excel and NinjaMock. We utilized Microsoft Excel to run sample seating tests and determine the overall capacity maximums based on seating clumps. This helped us develop our marketing strategy that encourages larger groups (3+) buying tickets together. Additionally, excel was used to evaluate and analyze our data sets. Finally, NinjaMock was used to display how the virtual concessions and merchandise purchases feature would look and feel for users of the mobile app. GitHub was used to share code and develop the project and data analysis. The team also used Flutter to create and develop the product of the mobile app. Through multiple testings and feedback, the team was able to address issues and create a well-structured app easy for fans to use.
Key Metrics
Our team estimates 300 million dollars will be lost in ticket revenue if fans cannot purchase tickets and go to games this season. Developing a financial plan has allowed us to estimate the costs of developing the app and getting the product to the market. Developing the app to completion would cost about $15,000 and marketing the app would cost about $20,000. The AWS Server space to support the app would cost about $64,500. In total, the product would cost about $99,500 in the first year. We would make this money up in revenue by charging 0.09 percent on all app transactions and marketing on the app. If arenas/stadiums decide to use our app, we would make about $29,750 from the Fever, $86,100 from the Pacers, and $96,000 from the Indianapolis Motor Speedway. The total earnings for the first year would be $211,850, making the net profit in the first year $112,350. The return on investment would be 88.6 percent. Data collection and analysis suggest that Mondays appear to not draw a considerable number of fans. Targeting the market towards Saturdays, Sundays, and Tuesdays could result in a positive financial outcome when hosting, safely, professional events.
Technical Architecture
For our team’s product, we have created a mobile app that allows for a safer game-day experience by seating fans at an appropriate distance and ideally would have a feature that allows fans to purchase concessions and merchandise on their mobile devices and pick up their items when notified. The mobile app consists of user authentication with the option of connecting to g-mail accounts as well as seat assignment while remaining six feet from other groups of fans. Our GitHub repository that contains code of the mobile app, seating algorithm, and data analysis can be accessed here.
EDA - Exploratory Data Analysis in R
The Product Team decided to look into some datasets of sporting events to analyze possible trends and correlations among games and their characteristics. The goal of this research was to try and find any insight into stadium capacities and the attendance of the games. After extensive research and a detailed look into data sets, our team analyzed a comma-separated value's data set where every row denotes a separate football game for specific college teams. Some characteristics of the games the Pro Squad assessed were the stadium capacity versus attendance.
After filtering the college football games data set provided by Kaggle, we see that in Indiana only 4 major games occurred on Mondays. 10, 10, and 11 took place on Saturdays, Tuesdays, and Sundays, respectively - all of this in a span of 4 months ( usual Fall season). Image of frequency table analysis generated in R for weekdays can be seen here.
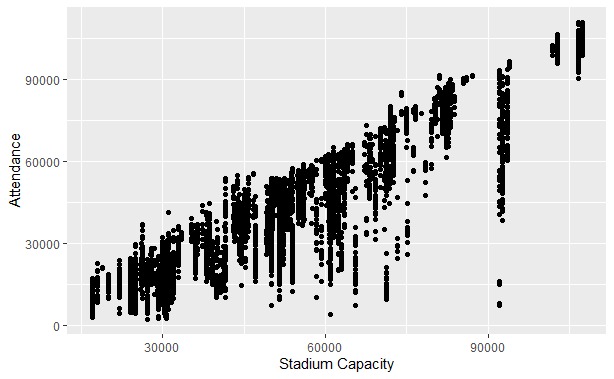
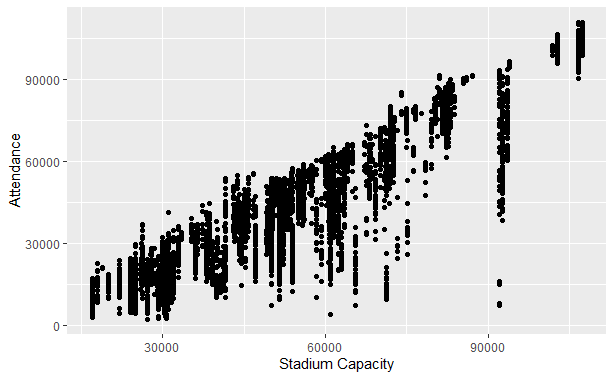
In addition to that interesting trend, another finding is a strong correlation between Stadium Capacities and Attendance as well. From the correlation and graph below, we actually see an expected trend. As the stadium capacity increases, so does the attendance of events. The correlation is almost 90%!
Please see Model 1
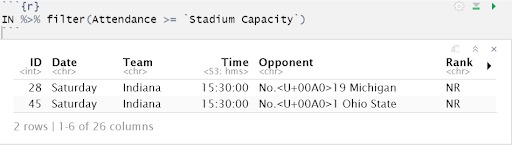
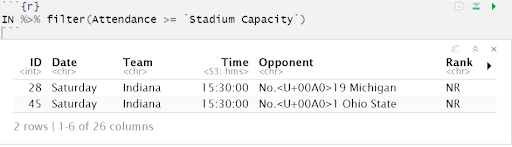
On the graph, we can see a few outliers. The ones on the bottom indicate that the stadium had fewer visitors than its capacity - the most common situation. However, a small number of outliers at the top of the line demonstrate when there are more attendees than the stadium supports. In Indiana, that happens twice with the observations of the games from Kaggle. Both situations happen on a Saturday and it reiterates our finding that weekends should be the focus for game times during COVID days - but, of course, in a way where Indiana Fever could draw more fans and still provide a safe environment with the app features we developed.
Please see Model 2
But how do we implement safety guidelines? After working with the data and performing some Exploratory Data Analysis, the Pro team understood that weekends are a hot spot for crowds and sporting events. Our team used Flutter to implement safety guidelines for the Fever fans based on the data analysis as well.
Key Tools, Libraries, and Frameworks
To create a mobile app, we used Flutter, an open-source UI software development kit created by Google. Flutter uses Dart, which is an object-oriented programming language. We decided upon this framework because Flutter is becoming popular within the mobile app development field. Because Flutter contains beneficial features, such as cross-platform and hot reload, it provides a fast and easy app development, which is extremely important in a five-week time frame. To develop the seating algorithm of the app, we used Python programming language because it is a prominent language in the mobile app industry, and all members of the pro-squad are familiar with the language. R programming language was used to analyze data sets to possibly predict user capability and find out trends of stadium attendance.
If you had another 5 weeks to work on this, what would you do next?
With another five weeks to work on this project, I think we would work on a more technical solution to tackle the WNBA season in Bradenton, FL. If we had a full understanding of the target market as well as the capabilities to create an abstract innovation we would have attempted to take the more creative route. The key change would be to put 360-degree cameras in the stands in various locations and allow a streaming service. This solution would also come with trying to mic up all of the players during the game to allow for the most authentic stadium experience. Our solution there would be paired with the future assumption of a return to stadiums. As far as expanding upon our current idea of socially distanced seating, we would spend more time consolidating vendor information from Bankers Life Fieldhouse and doing some of the necessary coding involved with making contactless purchasing a reality. Our marketing plan would consist of much more research and find the best possible incentives and discounts to maximize profits. With another five weeks, our research and coding capabilities would dramatically increase and result in a much more cohesive and thorough product. We would conduct surveys to collect data on the demographics of fans and game attendees to perform a more accurate and conclusive analysis.


Log in or sign up for Devpost to join the conversation.