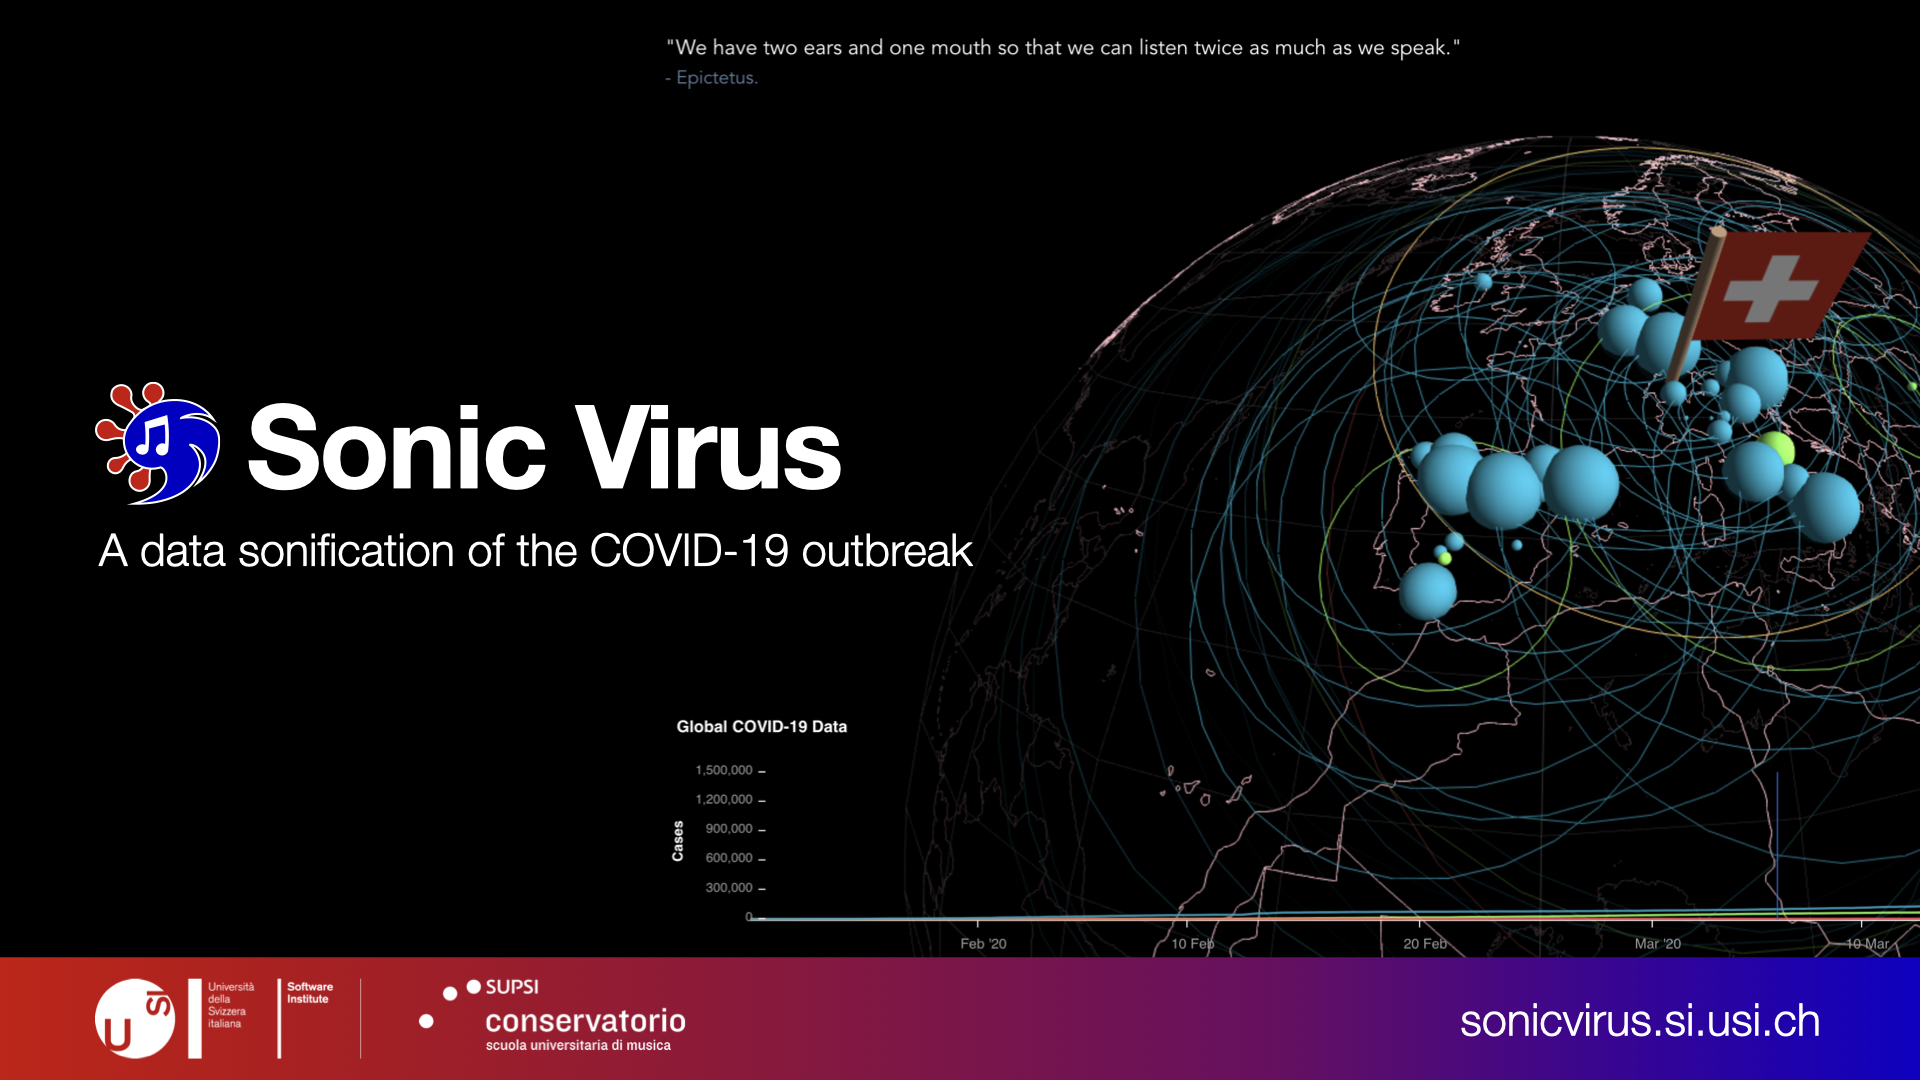


SonicVirus
A data sonification of the COVID-19 outbreak
Inspiration
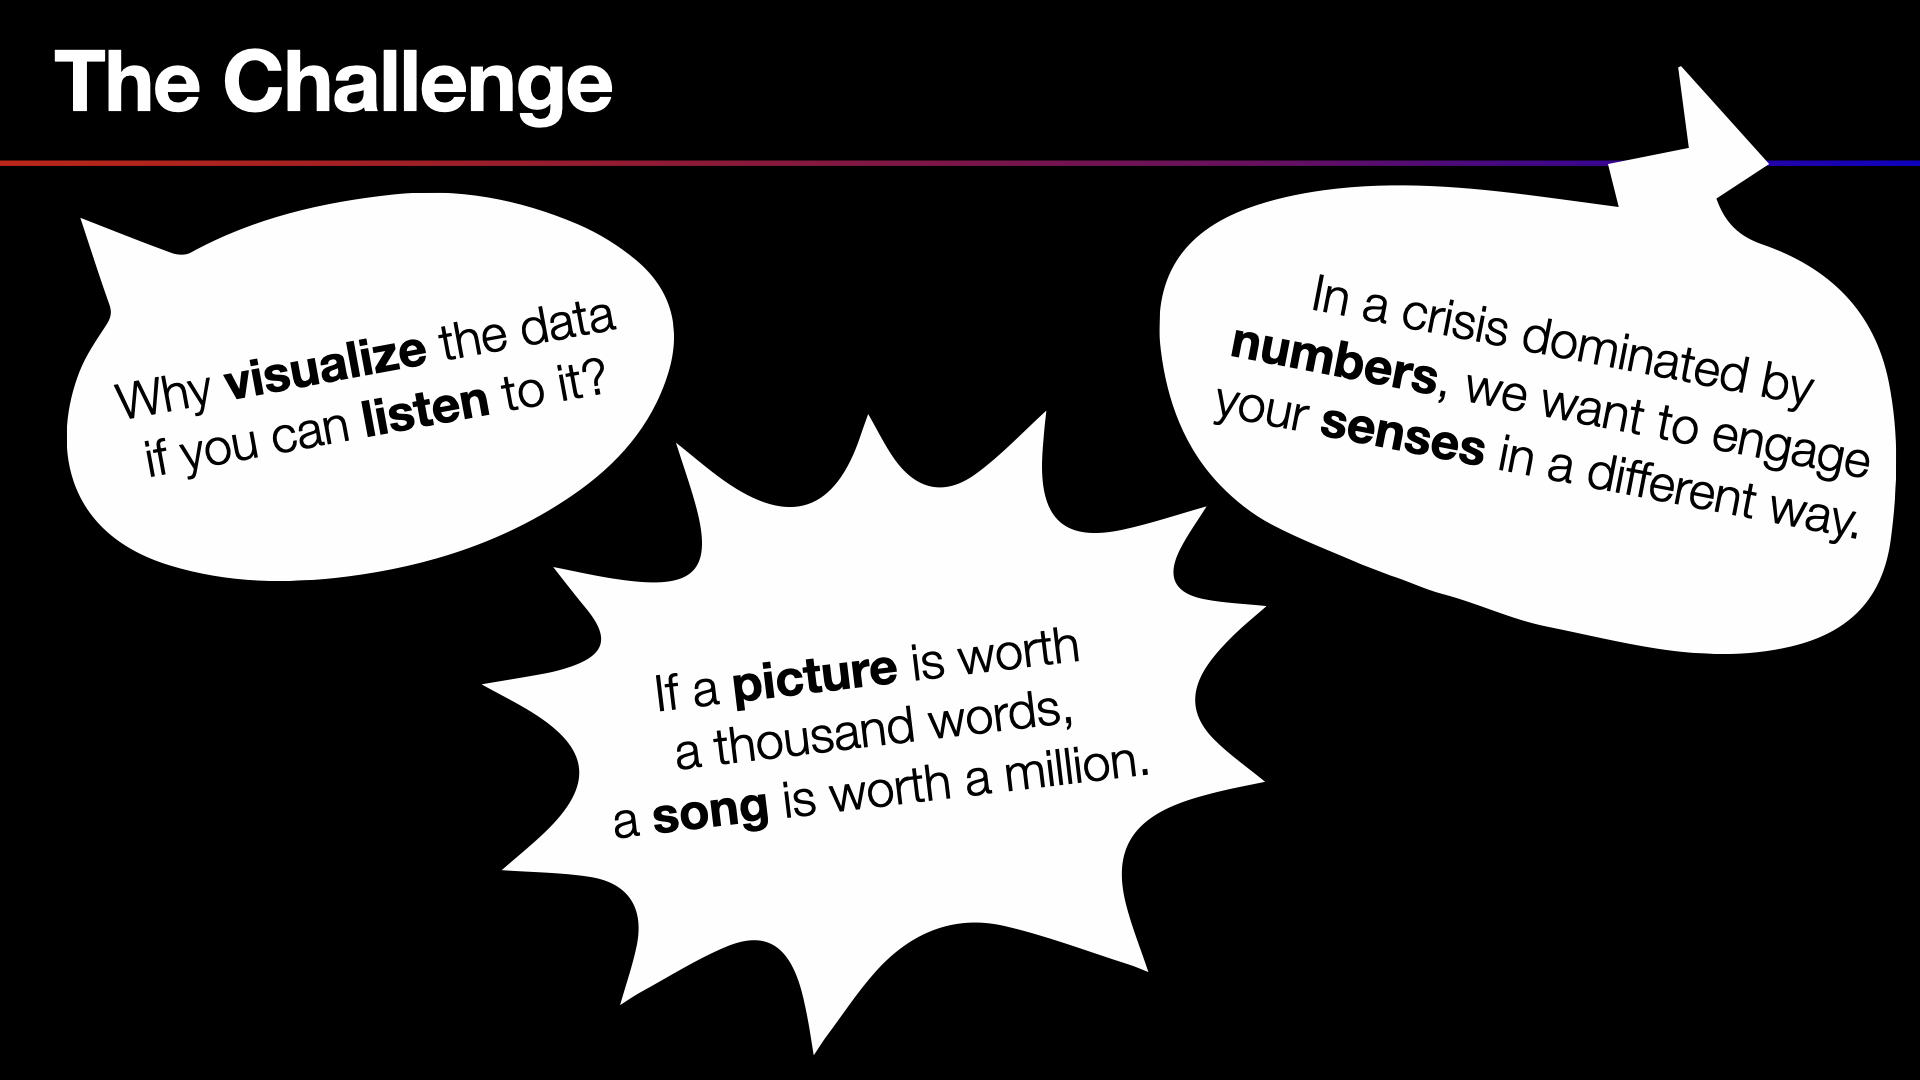
In the past weeks we have seen many approaches to visualize COVID-19 data. But, why only visualize the data if you can listen to it? SonicVirus is an interactive experience that enables you to listen to the COVID-19 outbreak around the world.
What it does?
SonicVirus enables users to listen to the evolution of the COVID-19 outbreak around the world by means of data sonification. In a nutshell, data sonification is the auditory equivalent of data visualization.
To interact with SonicVirus, the user selects a reference point on the planet (i.e., coordinate) and the symphony automatically starts to play. Under the hood, SonicVirus gathers the raw data from the 2019-nCoV Data Repository by Johns Hopkins CSSE, aggregates it, and uses it as input for a custom data sonification algorithm we implemented. In aggregating the data, SonicVirus assigns different weights to the data depending on the linear distance of the reference point. For example, if the user clicks on Switzerland, data regarding the COVID-19 outbreak in Switzerland will contribute more to the symphony being played. Nonetheless, being a global pandemic, the situation of the rest of the world will also influence the symphony, but with a lower weight.
To complement the sound, the globe shows an animation of the new confirmed cases of COVID-19, day by day, in the world.
Customization
Besides selecting a reference point to geo-localize the symphony, the user can also customize her experience in SonicVirus as follows:
- Select a custom
time intervalfor the data, i.e., and the symphony; - Change the
refresh time, yielding to a faster or slower symphony; - Pause, resume, or stop the symphony;
Data sonification
To implement the data sonification of SonicVirus we leveraged the expertise of Prof. Nadir Vassena and Alberto Barberis, teachers, composers, and instructors at the Conservatorio della Svizzera italiana. Their extensive musical background enabled us to reach a complex, rich, yet meaningful geo-localized data-driven symphony.
Our data sonification algorithm is entirely composed of digitally synthesized sounds generated in real-time with the Web Audio API. All the musical elements are strictly related to the COVID-19 data, however some randomized parameters ensure the that the symphonies generated by SonicVirus are very dynamic.
Composing Music with COVID-19 Data
SonicVirus uses 5 categories of digitally synthesized sounds: kick, white noise, impulse, harmonic field, and arpeggiator. The base sound is the kick reminiscent of a heartbeat. As time passes, new COVID-19 data are fed into the algorithm. In turn, new categories of sounds are added to enrich the symphony.
Each sound and tempo (i.e., metro) is mapped to different characteristics of COVID-19 data. For example, the metro of the kick is mapped to the daily confirmed cases of COVID-19, i.e., more cases, faster tempo, faster heartbeat. The amount of white noise describes the amount of deaths, while impulses represent the recovered cases. The harmonic field is also connected with the daily confirmed cases: The more confirmed cases there are, the more distorted and complex the harmony becomes. Also the rhythm of the arpeggiator is increasing following the curve of daily cases and dead.
Technologies
Under the hood, our project uses the following technologies: Web Audio API, Vue.js, threejs.org, Express.js, and leverages the 2019-nCoV Data Repository by Johns Hopkins CSSE.
Challenges
The biggest challenge was to speak a common language, since musicians and software & data engineers have different backgrounds. Hence, we went through several iterations and we organized innumerable conference calls in the last 72 hours to start speaking the same language.
Accomplishments that we’re proud of
It’s called SonicVirus and you should really check it out!
What we learned
Nothing is impossible.
What's next
We have plenty of ideas to evolve SonicVirus. Some of them are:
- Improve the user interactions;
- Add support for mobile;
- Improve the data sonification algorithm;
- Gather feedback to provide additional features.
Team
This project is a joint collaborative work between the REVEAL Research Group at the Software Institute and the Scuola Universitaria di Musica-SUPSI at the Conservatorio della Svizzera italiana.
Our team is composed of the following members:
- Alexander Camenzind
- MSc Student @ MSDE, Software Institute
- Aron Fiechter
- MSc Student @ MSDE, Software Institute
- Federico Pfahler
- MSc Student @ MSDE, Software Institute
- Gustavo Graziani
- MSc Student @ MSDE, Software Institute
- Valerie Burgener
- MSc Student @ MSDE, Software Institute
- Alberto Barberis
- Dr. Roberto Minelli
- Post-doctoral Fellow @ REVEAL
- Prof. Michele Lanza
- Director of the Software Institute & Head of REVEAL
- Prof. Nadir Vassena
Contact
If you have questions, feel free to contact us.
Built With
- audioapi
- express.js
- javascript
- node.js
- three.js
- vue.js


Log in or sign up for Devpost to join the conversation.