Inspiration
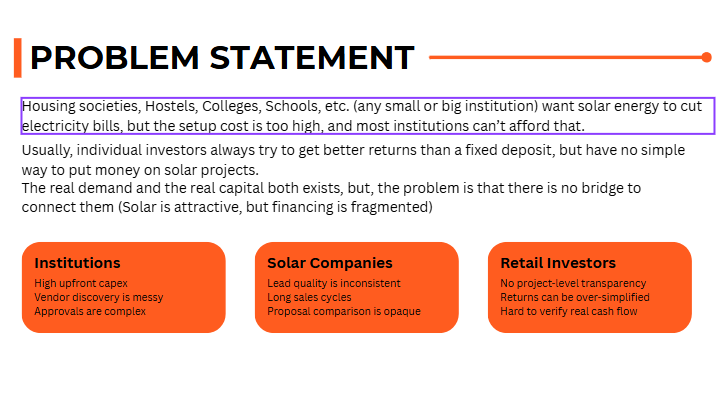
Our own college, HBTU Kanpur, has wanted a rooftop solar setup for a while. The problem was never technical — the panels, the space, the sunlight were all there. The problem was capital. A 100kW installation runs close to ₹50 lakh upfront, and no single institution wants to carry that on its own books.
At the same time, we kept running into the opposite problem: people around us with ₹50,000 or ₹1 lakh sitting in a fixed deposit at 6.5–7%, wishing there was something better to put it into — something real, not another mutual fund PDF. Solar seemed like the obvious answer, but nobody had actually built the bridge between the two.
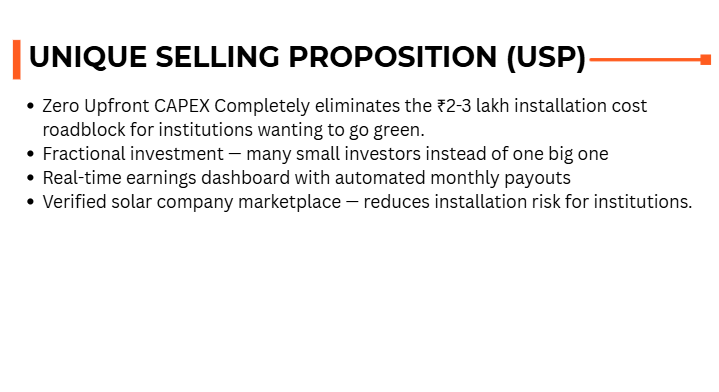
That's where SolarShare came from: instead of installing exactly what an institution needs, install double. The institution gets its share. The other half gets opened up to investors who fund it and get paid from the power it sells back to the grid.
What it does
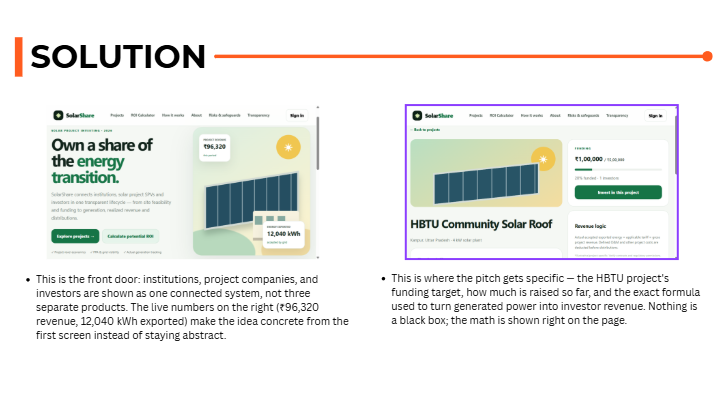
SolarShare connects three sides of the same problem: institutions that need solar power, project entities that own and operate the plant, and investors who want direct exposure to a real solar asset instead of another paper investment.
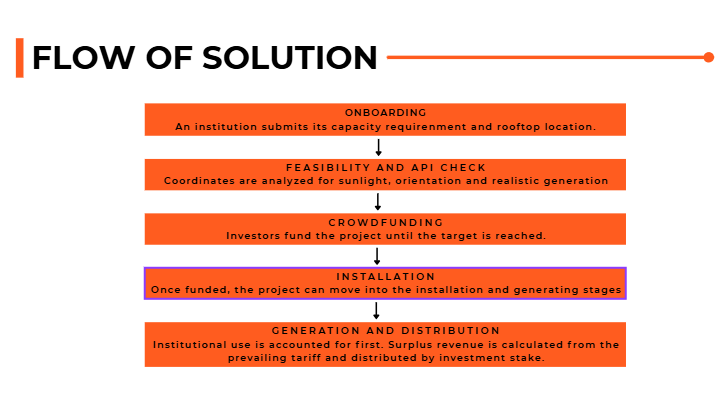
An institution lists its energy requirement. We size the plant at double that capacity — their share covers their own consumption, and the rest becomes a live, browsable project on the platform. Investors can put in as little as ₹10,000 and instantly see their exact ownership percentage calculated for them.
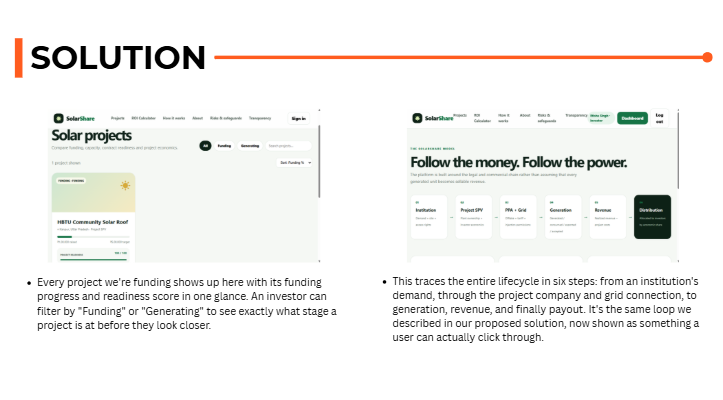
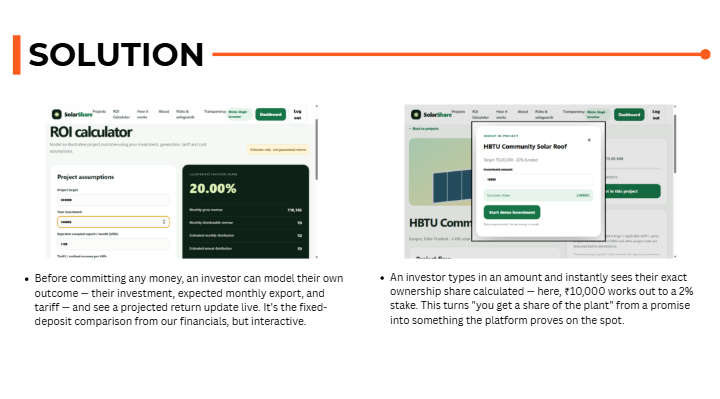
Every project page also shows the actual revenue formula being used (generated power × tariff, minus O&M and other costs), which stage the project is at (funding, PPA signed, grid-connected, generating), and a built-in ROI calculator so investors can model their own return before committing anything. Our first modeled project — a 200kW pilot at HBTU — projects an 8.6-year payback and a ~9–10% net investor return, ahead of a fixed deposit.
How we built it
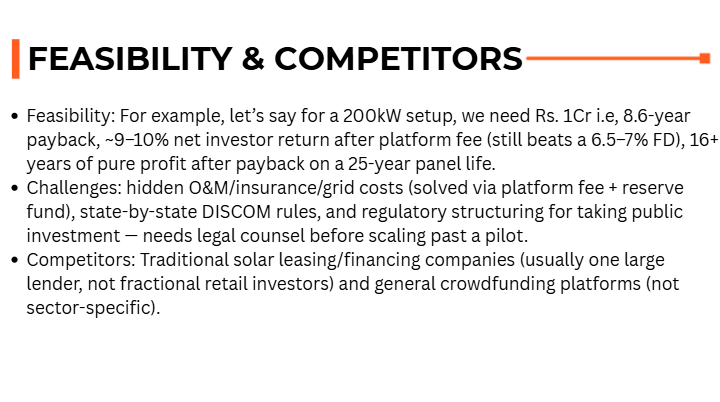
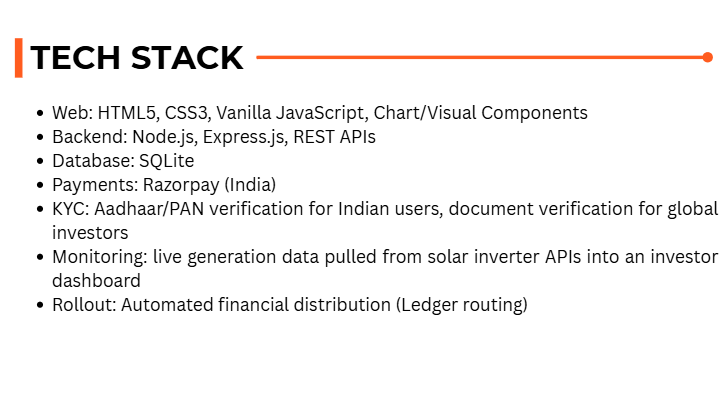
We built the frontend in React/Next.js and the backend in Node.js, with a data model built around what we ended up calling "follow the money, follow the power": institution → project SPV → PPA & grid connection → generation → revenue → distribution. Each of those six stages is tracked separately rather than assumed, which turned out to matter a lot.
The demo includes a full investor flow: browsing live projects, opening a project's detail page to see its funding progress and revenue logic, running numbers on the ROI calculator, and actually investing a demo amount to watch the ownership-share calculation update live. Every number on those screens is computed, not hardcoded.
Challenges we ran into
The hardest part wasn't code — it was the financial model itself. Our first pass used the obvious formula: capacity × tariff = investor return. It's clean and fits on a slide, but it's also wrong in a few ways we didn't see coming until we got into it:
- Generated power isn't the same as sellable revenue. Downtime, curtailment, and rejected grid exports can all shrink the gap between "panels made this much electricity" and "the project got paid for this much."
- A projected tariff isn't a signed contract. Until a PPA is actually executed, any return number is a forecast, not a promise.
- Surplus power can't be assumed exportable. Grid rules, connection limits, and consumer category can restrict how much a project is even allowed to sell.
- "You own 0.5% of these panels" sounds simple but creates real legal ambiguity, so we had to shift the language to a defined economic interest in a project structure instead of literal ownership.
So we built a second layer into the platform that tracks generation, export, and revenue as three separate, reconcilable numbers, and won't show a project as "earning" until its PPA and grid permissions are actually recorded. It made the product more honest, and also harder to build than we expected.
We also ran into a less comfortable realization: publicly promising investors a fixed annual return can edge into securities-regulation territory in India. That's not just a UX problem — it's something we've had to treat as a real constraint on where this can go next, not an edge case to ignore.
Accomplishments that we're proud of
The part that mattered most to us is that this isn't a set of mockups — every screen in the demo does real math. You can invest a demo amount and watch your ownership percentage get calculated in front of you, and run the ROI calculator with your own numbers.
We also didn't stop at the happy-path version of the idea. Most solar-crowdfunding concepts present one clean return number and leave it there. We built the failure-point table into the actual data model, not just the pitch deck, which meant confronting some inconvenient gaps in our own projections instead of hiding them.
What we learned
A good fintech idea and a fundable one aren't automatically the same thing — the gap between them is in the boring-sounding stuff: revenue recognition, contract status, grid permissions, reconciliation. None of that shows up in a two-line pitch, but it decides whether the platform is trustworthy.
We also learned a fair amount about solar economics we didn't know going in: panel degradation curves, why inverters need mid-life replacement, how DISCOM tariffs and net-metering rules vary by state, and why "generation" and "revenue" need to be tracked as genuinely different numbers.
What's next for SolarShare
The next real milestone is connecting to an actual solar inverter's monitoring API, so generation numbers on investor dashboards update from live plant data instead of manually entered figures. Alongside that, we want proper legal counsel on how to structure investor returns so the platform can scale past a single pilot without running into securities-regulation issues later.
Longer term, we'd like a secondary market so investors can exit by selling their share to someone else on the platform, and to expand past HBTU to other colleges and housing societies with the same problem we started with.
Built With
- javascript
- next.js
- node.js
- postgresql
- react
- tailwind

Log in or sign up for Devpost to join the conversation.