-
![[71] - SolarEnergyViz.tech – screenshot 1](//d112y698adiu2z.cloudfront.net/photos/production/software_photos/002/601/582/datas/gallery.jpg)
project thumbnail
-
![[71] - SolarEnergyViz.tech – screenshot 2](//d112y698adiu2z.cloudfront.net/photos/production/software_photos/002/601/578/datas/gallery.jpg)
the website gets built dynamically
-
![[71] - SolarEnergyViz.tech – screenshot 3](//d112y698adiu2z.cloudfront.net/photos/production/software_photos/002/601/569/datas/gallery.jpg)
home page
-
![[71] - SolarEnergyViz.tech – screenshot 4](//d112y698adiu2z.cloudfront.net/photos/production/software_photos/002/601/572/datas/gallery.jpg)
buyback calculator
-
![[71] - SolarEnergyViz.tech – screenshot 5](//d112y698adiu2z.cloudfront.net/photos/production/software_photos/002/601/575/datas/gallery.jpg)
12 years of historical data and its conversion efficiency
-
![[71] - SolarEnergyViz.tech – screenshot 6](//d112y698adiu2z.cloudfront.net/photos/production/software_photos/002/601/576/datas/gallery.jpg)
12 years of conversion efficiency data visualized
![[71] - SolarEnergyViz.tech – screenshot 1](https://d112y698adiu2z.cloudfront.net/photos/production/software_photos/002/601/582/datas/original.png)
![[71] - SolarEnergyViz.tech – screenshot 2](https://d112y698adiu2z.cloudfront.net/photos/production/software_photos/002/601/578/datas/original.png)
![[71] - SolarEnergyViz.tech – screenshot 3](https://d112y698adiu2z.cloudfront.net/photos/production/software_photos/002/601/569/datas/original.png)
![[71] - SolarEnergyViz.tech – screenshot 4](https://d112y698adiu2z.cloudfront.net/photos/production/software_photos/002/601/572/datas/original.png)
![[71] - SolarEnergyViz.tech – screenshot 5](https://d112y698adiu2z.cloudfront.net/photos/production/software_photos/002/601/575/datas/original.png)
![[71] - SolarEnergyViz.tech – screenshot 6](https://d112y698adiu2z.cloudfront.net/photos/production/software_photos/002/601/576/datas/original.png)
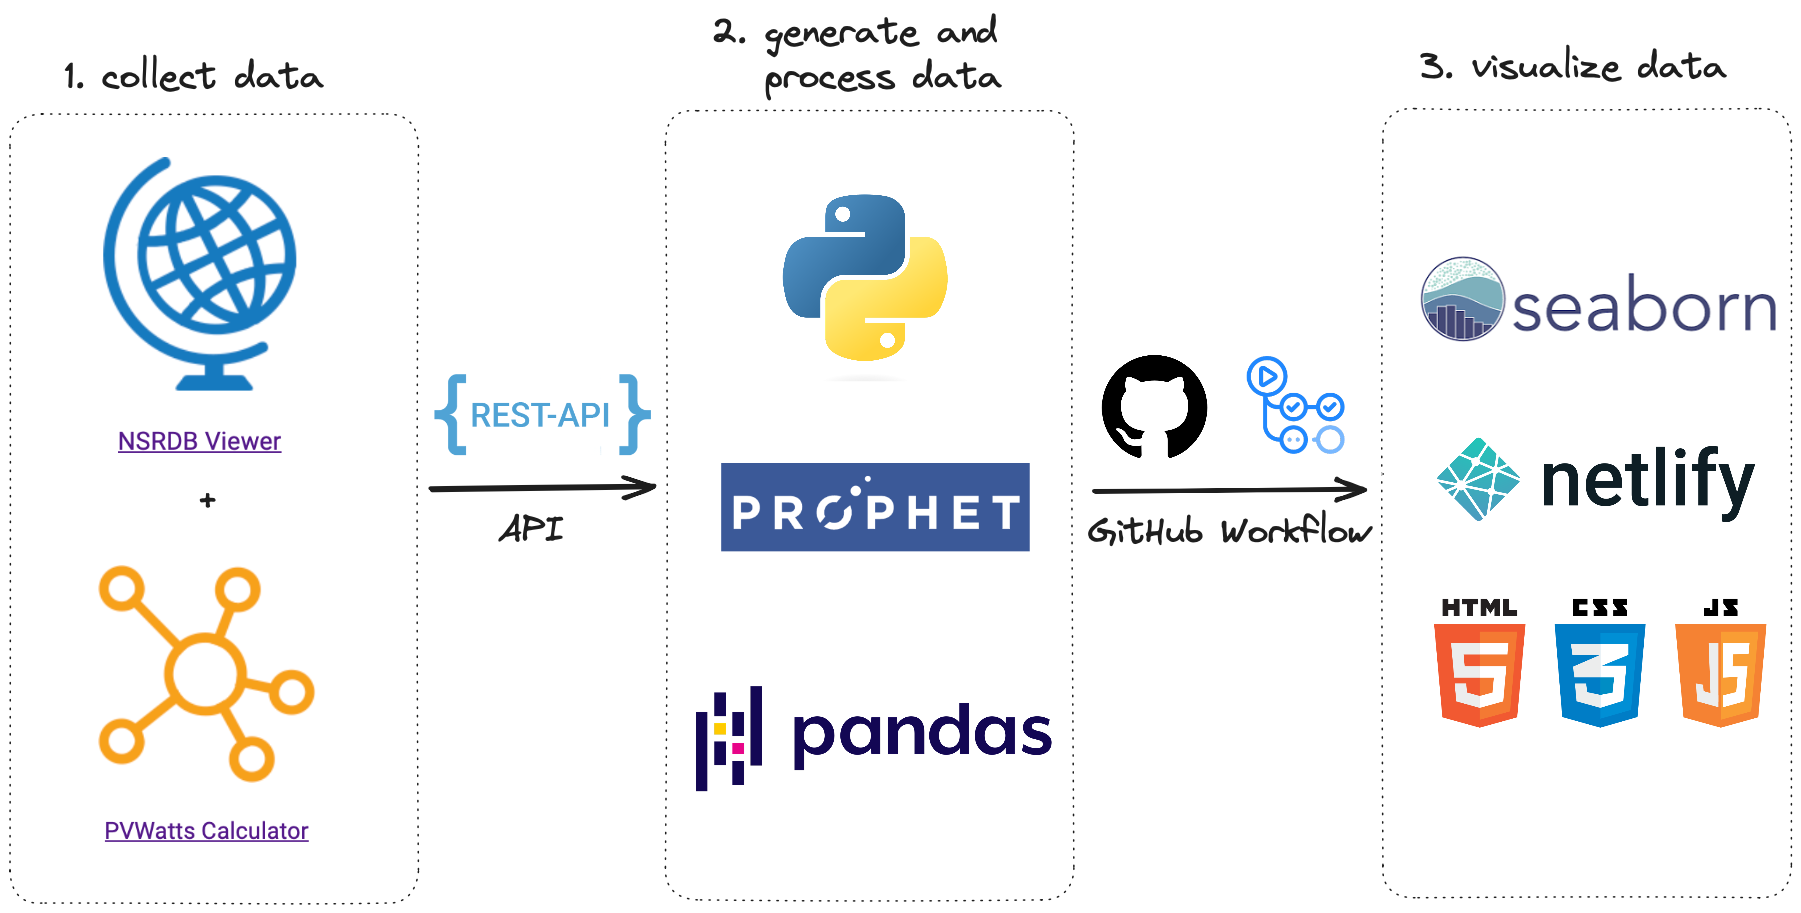
Overview
Engie challenge with sprinkes of GitHubOps, DevOps, and WebDev.
Here is a list of things we've done:
- Data Cleanup, Restructuring, Reformatting
- Calculated Conversion Efficiency for each hour for years 2011 - 2023 (90,000 rows of data)
- Predicted missing data from 2021 to 2023 (using Facebook Prophet time-series forecasting framework)
- Energy comparison between EV and CAMBUS arrays
- Deployed the results to SolarEnergyViz.tech
What it does
Calculates how much money you can make by being sustainable

Trains a time-series prediction model to predict future solar irradiance (fill the gap for 2021 - 2023)
Compares conversion efficiency of two different solar arrays

Visualizes 12 years worth of Conversion Efficiency

Cleans the dataset

How we built it
We used technologies like GitHub workflows to automate the cleanup and deployment

We used Netlify and CI/CD pipeline to continuously build dataset and deploy the website solarenergyviz.tech.
Challenges we ran into
Some of the challenges we faced while working on the Engie challenge:
Missing Values
Some of the data wasn't clean.
We found missing variables, such as Calc Failed and [-11059] No Good Data For Calculation.
For Calc Failed, we calculated the value by adding daily hours into totals.
For [-11059] No Good Data For Calculation, we used that day's total, subtracted all of the other hours, and split the difference among the hours that had that value.
Extremely High Values
Some of the data provided contained very high values, such as 2.38572E+30. We made sure to filter that data out as to not skew calculations.
All of that data seem to happen during night-time when the kWH records would have been very low.
NSRDB not accounting for tilt, azimuth
The NSRDB data does not account for tilt and azimouth of the array as well as max generation capacity. To account for the difference in installation, we relied on the PVWatts calculator to find the ratio of change.
| Month | EV Solar Radiation (kWh / m^2 / day) | CAMBUS Solar Radiaton (kWh / m^2 / day) | Difference |
|---|---|---|---|
| January | 4.11 | 2.53 | 1.58 |
| February | 4.79 | 3.23 | 1.56 |
| March | 5.71 | 4.25 | 1.46 |
| April | 6.22 | 5.02 | 1.2 |
| May | 6.71 | 5.83 | 0.88 |
| June | 7.26 | 6.43 | 0.83 |
| July | 7.74 | 6.60 | 1.14 |
| August | 7.31 | 5.98 | 1.33 |
| September | 6.74 | 4.99 | 1.75 |
| October | 5.39 | 3.62 | 1.77 |
| November | 3.87 | 2.47 | 1.4 |
| December | 3.17 | 1.99 | 1.18 |
Accomplishments that we're proud of
Three out of four team members have never attended a hackathon before.
What we learned
Learned Git, WebDev, DevOps, and Data Processing.
Built With
- api
- github
- html5
- javascript
- netlify
- pandas
- prophet
- python
- seaborn

Log in or sign up for Devpost to join the conversation.