-
-

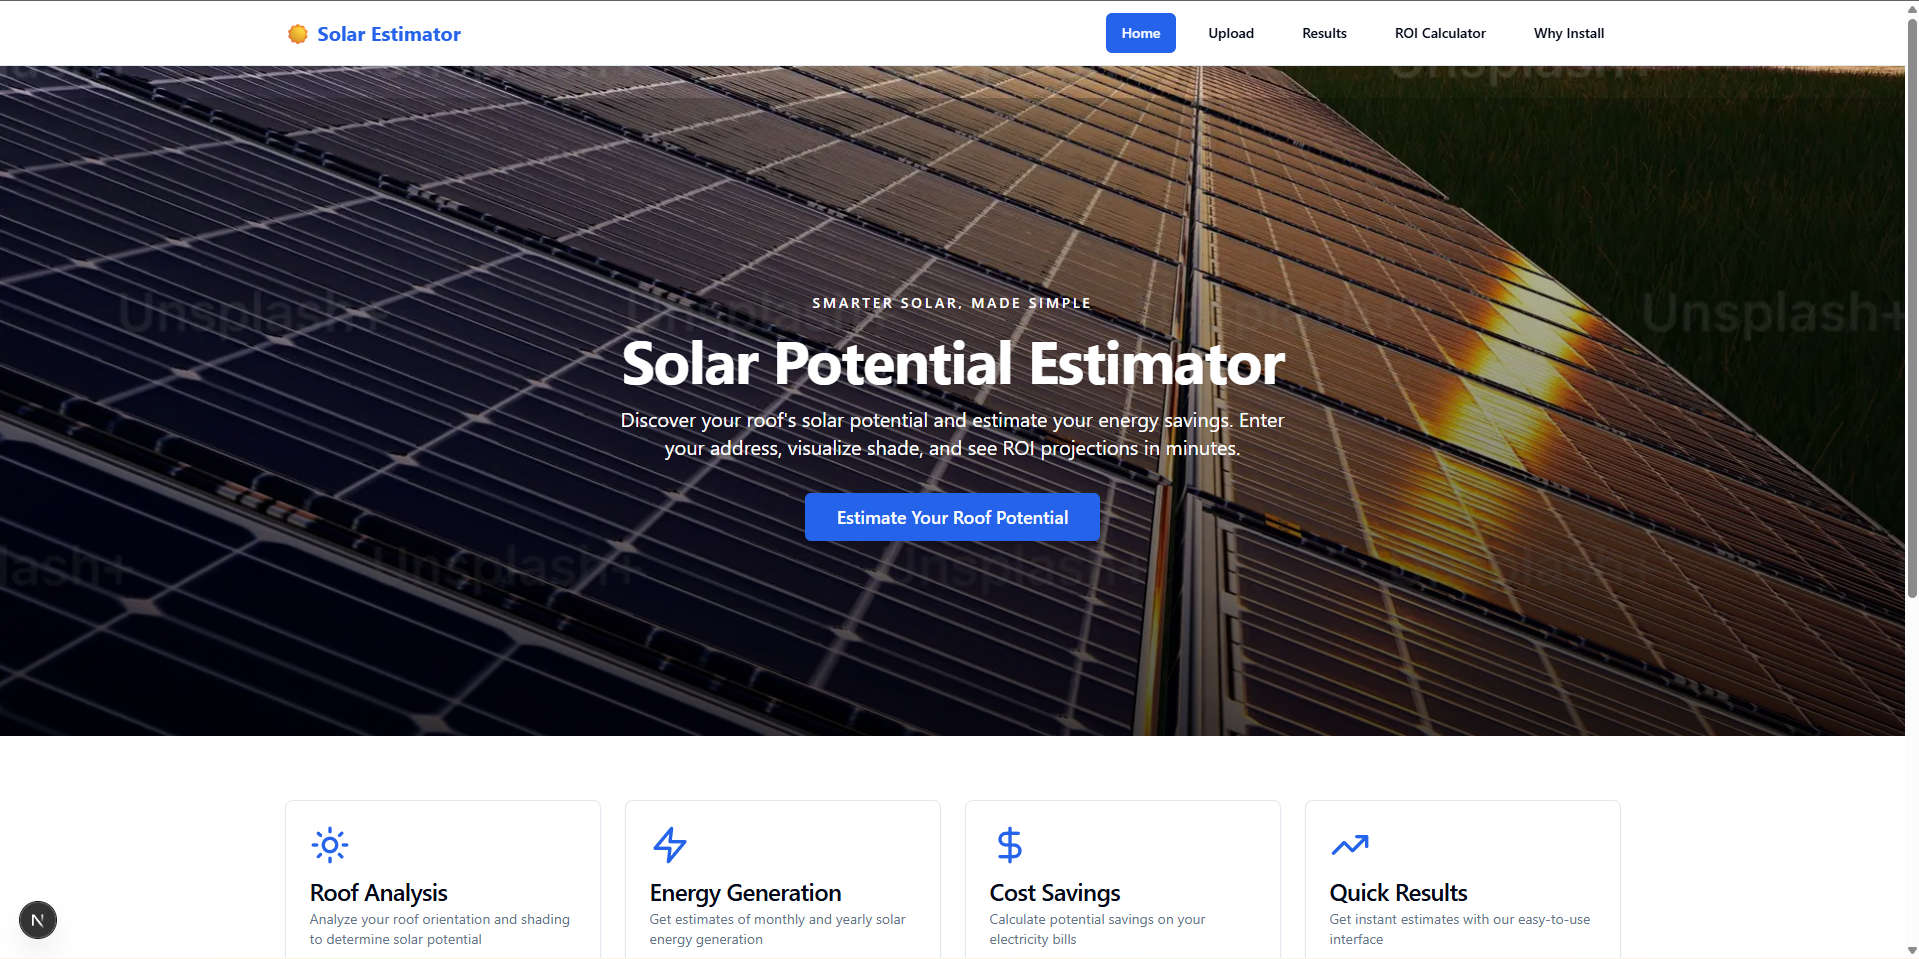
System home page
-
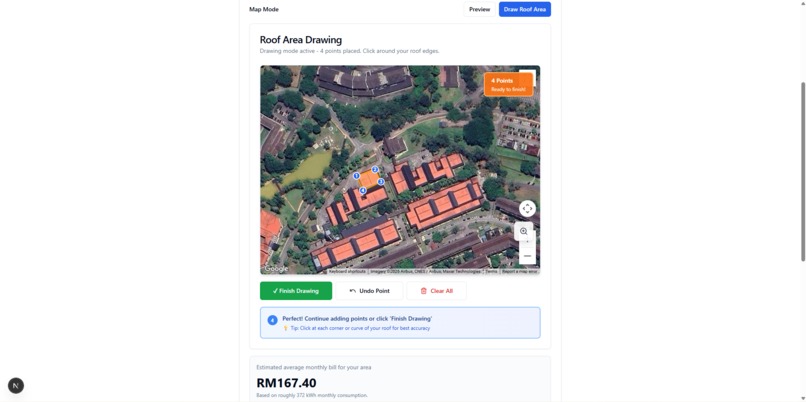
Roof drawing for size estimation
-
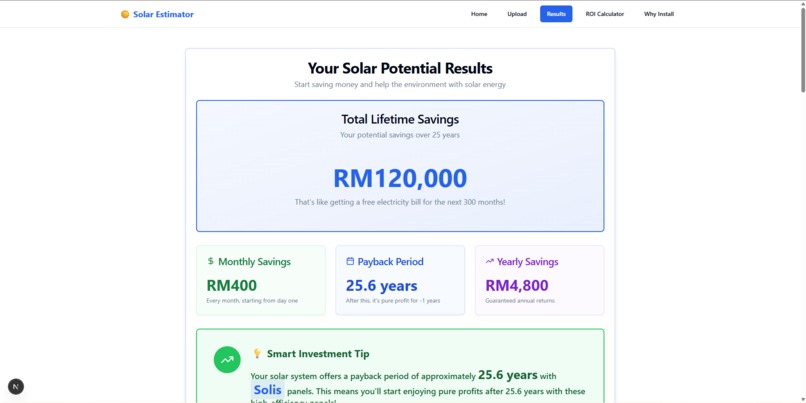
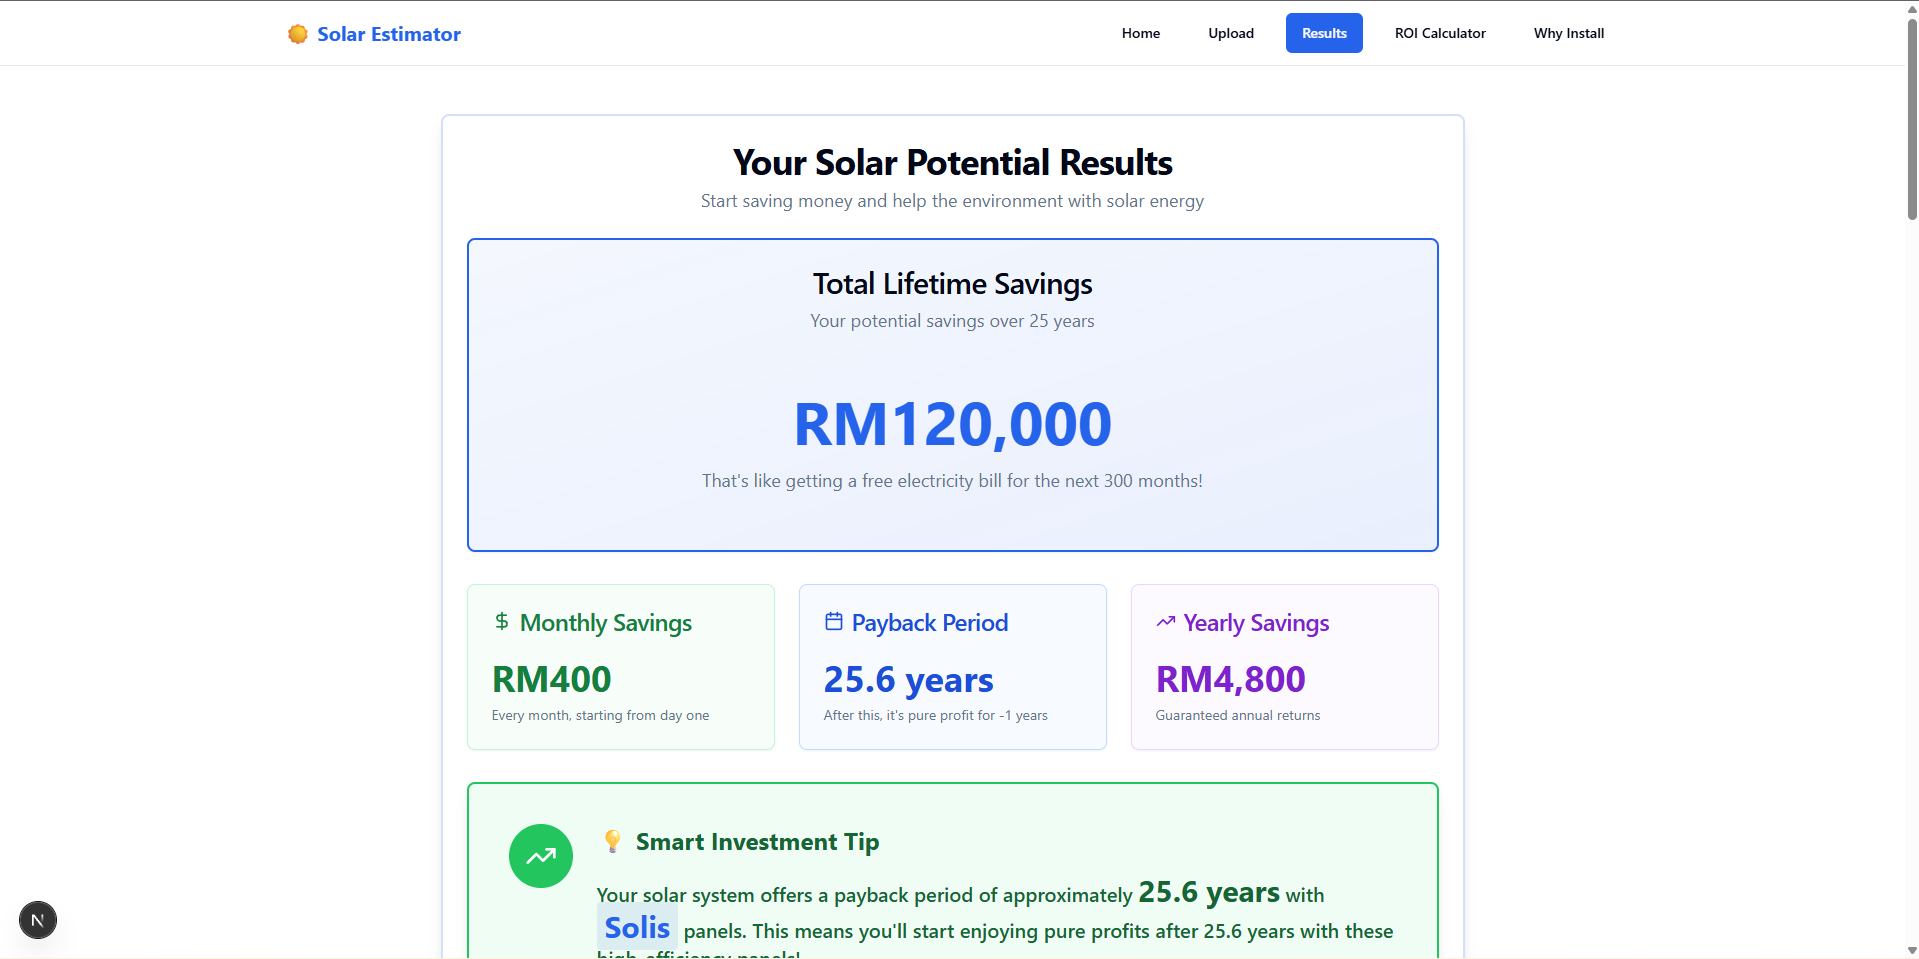
Solar potential result page
-

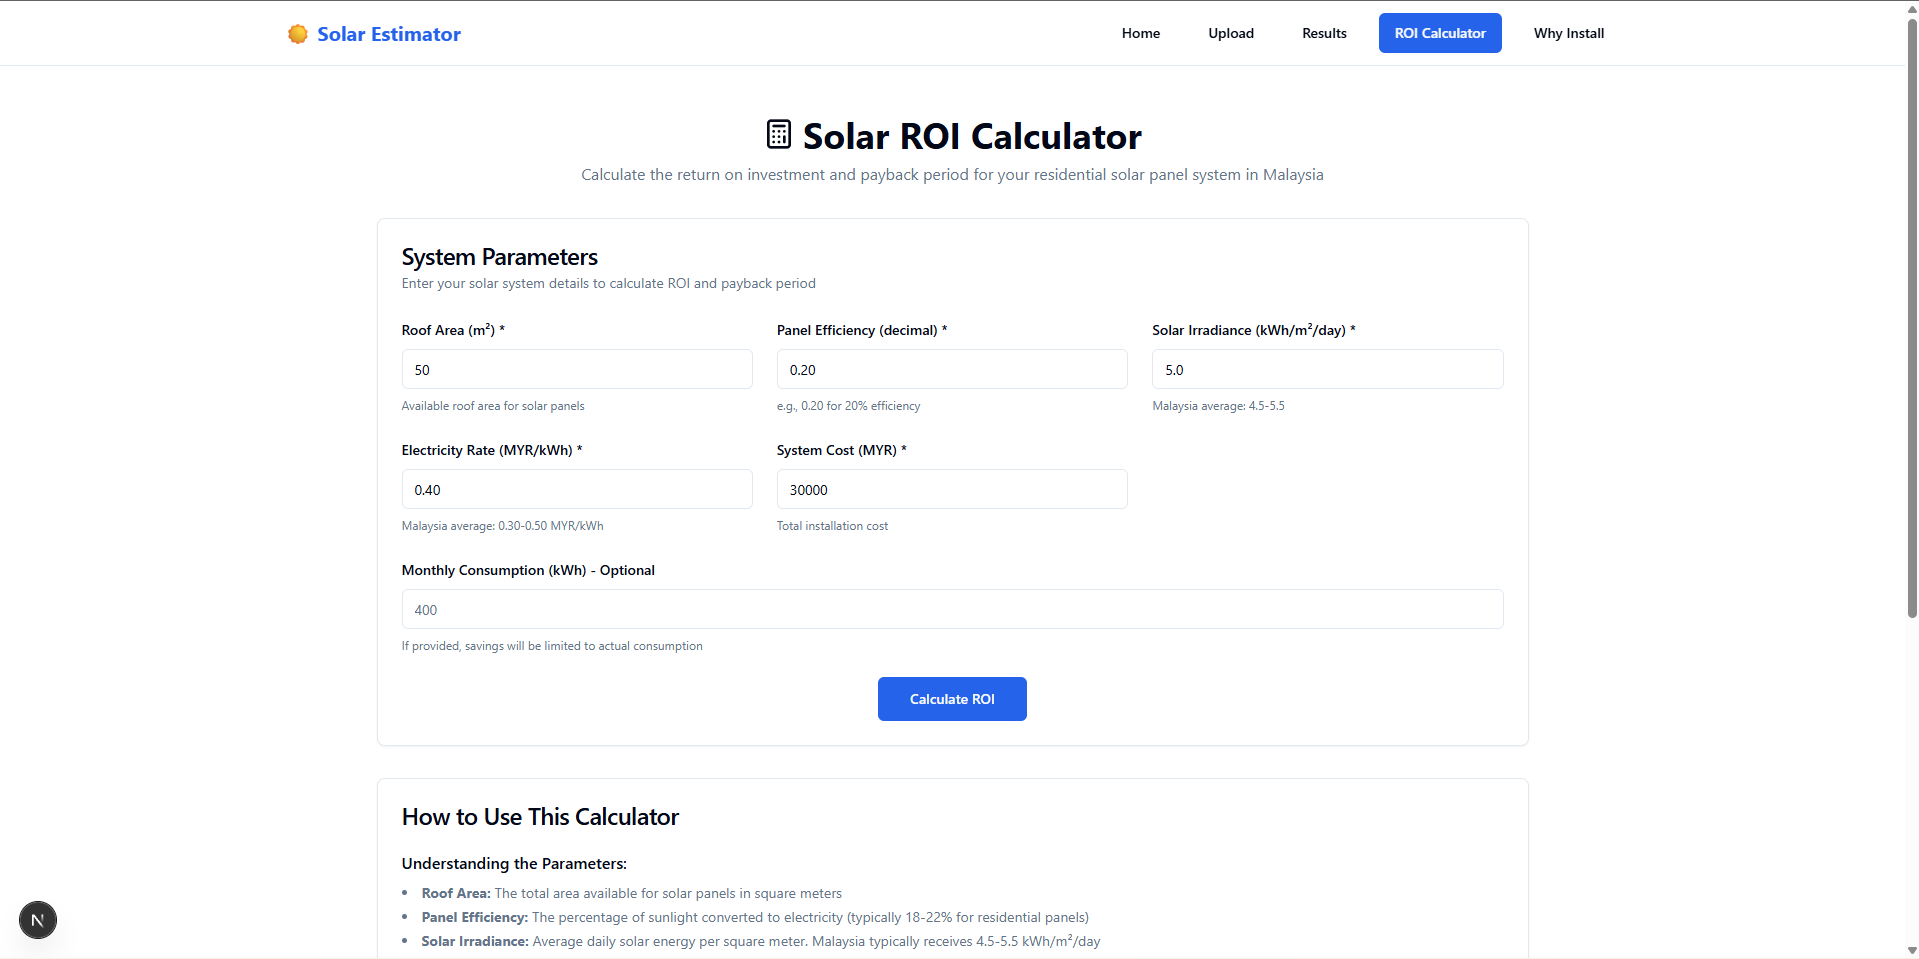
Solar ROI calculator

Inspiration
Most homeowners interested in solar energy adoption face a critical barrier—uncertainty. How much of their roof can accommodate solar panels? How much money will they actually save? What's the real payback period?
During the SDG-XI Hackathon, we recognized an opportunity to tackle Sustainable Development Goal 7 (Affordable and Clean Energy) by building a tool that demystifies solar energy adoption for the average homeowner. We envisioned a platform that combines satellite imagery, artificial intelligence, and real-world data to empower Malaysians to make informed decisions about renewable energy investments.
The project is specifically tailored for the Malaysian market, where:
- 📈 Electricity costs are rising steadily
- ☀️ Abundant solar resource availability year-round
- 🏛️ Growing government incentives for renewable energy adoption
- 📊 Limited awareness of actual solar potential and ROI
What it does
Solar Vision AI is an end-to-end solar potential estimation platform that helps homeowners understand their roof's solar capacity and financial returns. Key capabilities include:
- Interactive Roof Mapping - Draw your roof outline directly on satellite imagery to get precise area calculations in both m² and square feet
- Smart Panel Estimation - Automatically calculates how many solar panels fit based on your roof size, accounting for standard 400W panel dimensions
- Energy Production Forecasting - Uses Prophet-based time series analysis of solar irradiance data to estimate monthly and annual energy output specific to your location
- Financial ROI Analysis - Comprehensive return on investment projections over 25-year system lifespan, including installation costs, maintenance, and electricity savings
- AI-Powered Insights - Google Gemini integration provides personalized recommendations based on your specific roof characteristics and consumption patterns
- Environmental Impact Dashboard - Shows CO₂ reduction and tree-equivalent environmental offsets from your solar system
- Multi-Panel Configuration Comparison - Explore different system sizes and pricing scenarios to find your optimal investment
How we built it
Phase 1: Foundation & Architecture We chose a modern, scalable tech stack centered on Next.js for its full-stack capabilities, server-side rendering, and API route flexibility. TypeScript ensured type safety across our codebase, reducing runtime errors and improving maintainability.
Phase 2: Interactive Mapping We integrated Google Maps API with a custom drawing interface that allows users to click points on satellite imagery to outline their roof. The app uses geometric calculations to compute the enclosed area in both metric and imperial units, providing real-time feedback as users draw.
Phase 3: Core Analytics Engine The heart of the application includes:
- Panel Calculation Logic: Based on roof area, we estimate the number of panels that fit using standard 400W panel dimensions (2m × 1m)
- Energy Production Model: Using solar irradiance data and system efficiency factors (accounting for temperature, weather, and time-of-year variations)
- ROI Calculator: Comprehensive financial projections over a 25-year system lifespan, incorporating installation costs, maintenance, and savings
Phase 4: AI-Powered Insights We integrated Google Gemini AI to:
- Analyze roof characteristics and environmental factors
- Generate personalized recommendations based on the user's location and consumption patterns
- Provide context-aware answers about solar systems, costs, and benefits
Phase 5: Time Series Forecasting We implemented Facebook's Prophet library in Python to forecast solar irradiance patterns, capturing yearly seasonality for accurate energy production estimates.
Phase 6: UI/UX Polish We built a polished, accessible interface using:
- Tailwind CSS for responsive design
- Radix UI components for accessibility
- Framer Motion for smooth animations
- Recharts for interactive financial visualizations
Challenges we ran into
Geometric Accuracy
- Converting 2D screen coordinates to real-world measurements requires precise coordinate transformation
- Solution: Leveraged Google Maps' geometry library and proper transformation between screen space and geographic coordinates
API Rate Limiting
- Google Maps and Gemini APIs have usage quotas that could block users during peak times
- Solution: Implemented intelligent caching, batch processing, and graceful fallbacks when APIs are unavailable
Real-World Solar Data
- Obtaining accurate, granular solar irradiance data specifically for Malaysia was non-trivial
- Solution: Integrated NASA solar radiation historical data with Prophet forecasting models to provide reliable estimates
Complex State Management
- Managing multiple interconnected calculations (roof area → panel count → energy output → financial projections) created cascading dependencies
- Solution: Structured React state management with careful consideration of recalculation triggers and memoization
Model Accuracy vs. User-Friendliness
- Balancing scientific precision with simplified user-friendly estimates was challenging
- Solution: Incorporated industry-standard assumptions and presented confidence ranges rather than false precision
Cost Data Variability
- Solar panel and installation costs vary significantly by region, season, and market conditions
- Solution: Built configurable pricing models allowing users to input their own quotes while providing sensible market-based defaults
Accomplishments that we're proud of
✨ Seamless Multi-API Integration - Successfully unified Google Maps, Google Gemini, and custom Python backend without significant latency or data loss
🎯 Intuitive User Experience - Created an interface so simple that users can get solar estimates in under 2 minutes, no technical knowledge required
📊 Production-Grade Calculations - Implemented solar engineering calculations that align with professional assessments, validated against industry standards
🤖 AI-Powered Personalization - Leveraged modern LLMs to provide genuinely useful, context-aware recommendations rather than generic templates
🌍 Market-Specific Solution - Tailored the entire platform for Malaysian users with local electricity tariffs, climate data, and incentive information
⚡ Full-Stack Competency - Built a complete application spanning interactive frontend (React), robust backend (Node.js), and data science (Prophet forecasting)
What we learned
Technical Insights:
- Geospatial Analysis & Mapping - Integrating satellite imagery with real-world measurements requires careful attention to coordinate systems and geometric accuracy
- AI Integration Patterns - Effective LLM usage depends on clear context and well-structured prompts; generic AI doesn't guarantee useful results
- Time Series Forecasting - Prophet is powerful for capturing seasonality, but real-world solar data has complexities (clouds, microclimate) that models can't fully capture
- Full-Stack Architecture - Building responsive features across frontend, backend, and ML pipelines requires clear API contracts and state synchronization
- API Design Under Constraints - Working within third-party API quotas requires strategic caching, rate limiting, and graceful degradation
Domain Knowledge:
- Solar panel specifications, orientations, and efficiency factors vary significantly based on geography
- Electricity tariff structures and billing systems differ across regions and affect ROI calculations
- Environmental impact metrics resonate with users when framed relative to tangible concepts (trees planted, CO₂ offset)
Project Management:
- Iterative development with frequent user feedback is crucial for climate/energy tech
- Building trust requires transparency about assumptions and confidence intervals in predictions
- Market-specific adaptation is non-negotiable for adoption in different regions
What's next for Solar Vision AI
Immediate Enhancements:
- 📱 Mobile App - iOS/Android companion app for on-site roof inspections with AR visualization
- 🌤️ Advanced Shade Analysis - Seasonal satellite imagery analysis combined with 3D building models to map shade patterns throughout the year
- 📡 Real-time Bill integration - API connections with Malaysian utility companies for automatic historical bill retrieval and consumption tracking
Expansion & Scale:
- 🌏 Regional Rollout - Extend support to Singapore, Indonesia, Thailand, and other ASEAN countries with localized data and regulations
- 🏢 B2B Partnerships - Integration with solar installation companies for direct customer lead generation and quote management
- 🏘️ Community Impact Dashboards - Neighborhood-level analytics showing aggregate CO₂ reduction and energy generation from Solar Vision users
Advanced Features:
- 🔋 Battery Storage Analysis - Estimate optimal battery system sizing for off-grid viability and backup power
- 🌐 Grid Integration Planning - Account for net metering policies and export compensation rates
- 🤖 Image Recognition - Use computer vision to automatically detect roof features (chimneys, vents, dormers) from satellite images
- 💼 Financing Integration - Partner with green financing providers for direct loan origination in the app
Research Directions:
- Improve solar irradiance forecasting with machine learning models trained on Malaysian weather patterns
- Analyze adoption barriers and create targeted education content for different user segments
- Study long-term impact of deployed systems to validate our ROI models against real-world outcomes
Built With
- framermotion
- gemini
- google-maps
- lucidereact
- next.js
- radix
- react
- reactgooglemaps
- recharts
- tailwind
- typescript


Log in or sign up for Devpost to join the conversation.