-
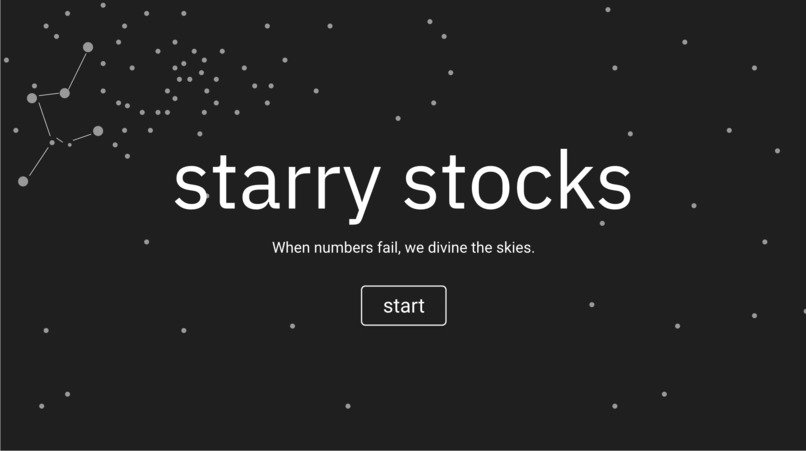
Landing Page
-
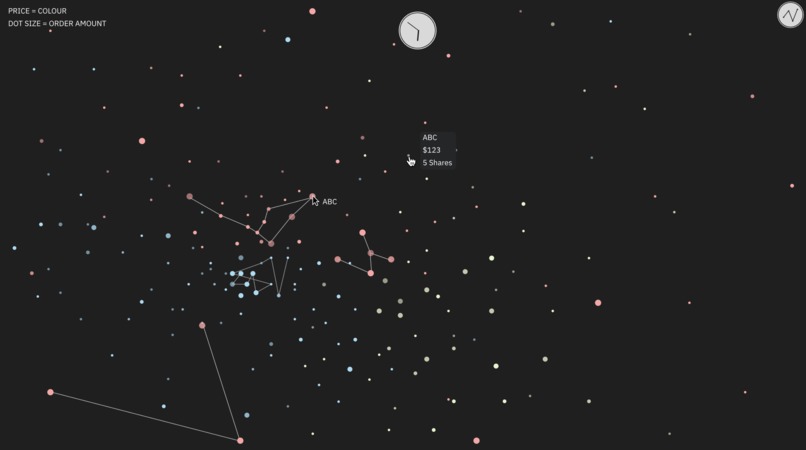
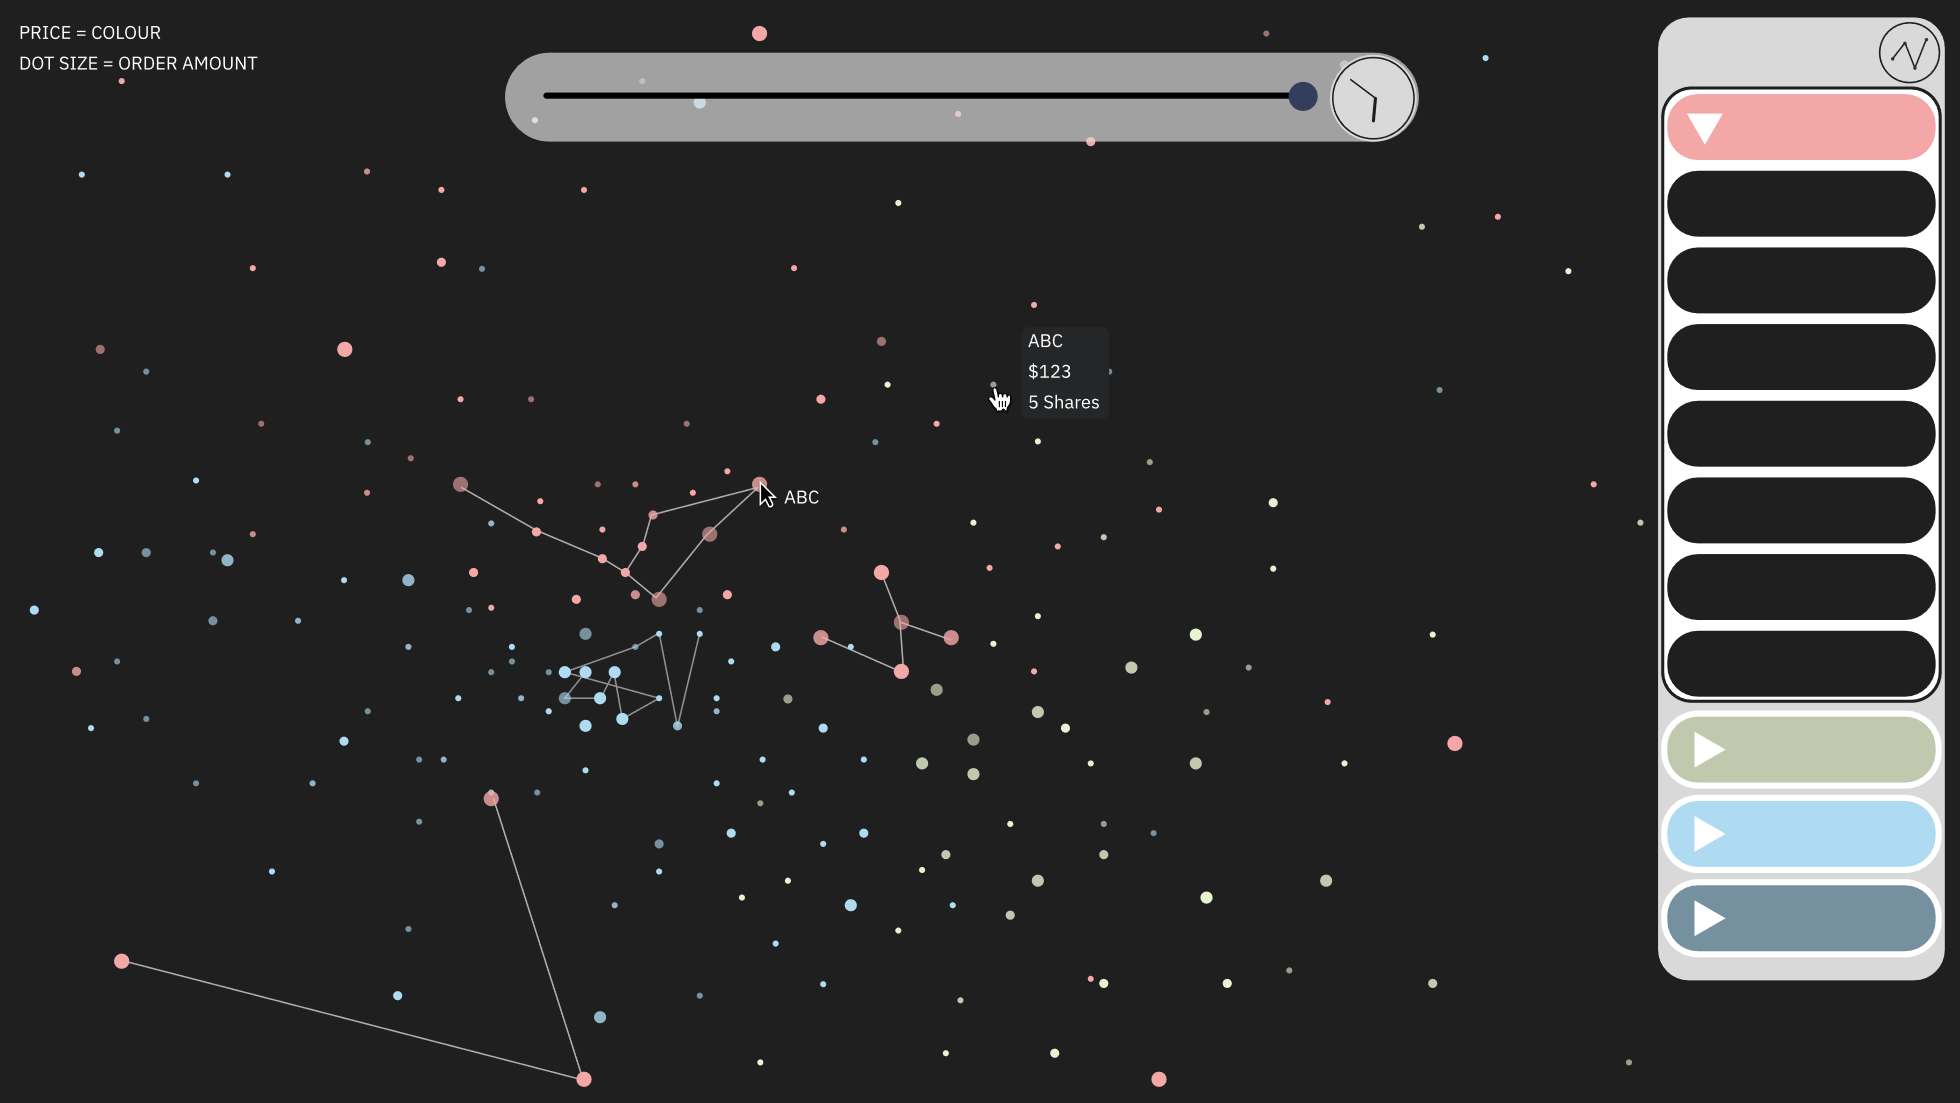
Similar to what the project looks like
-
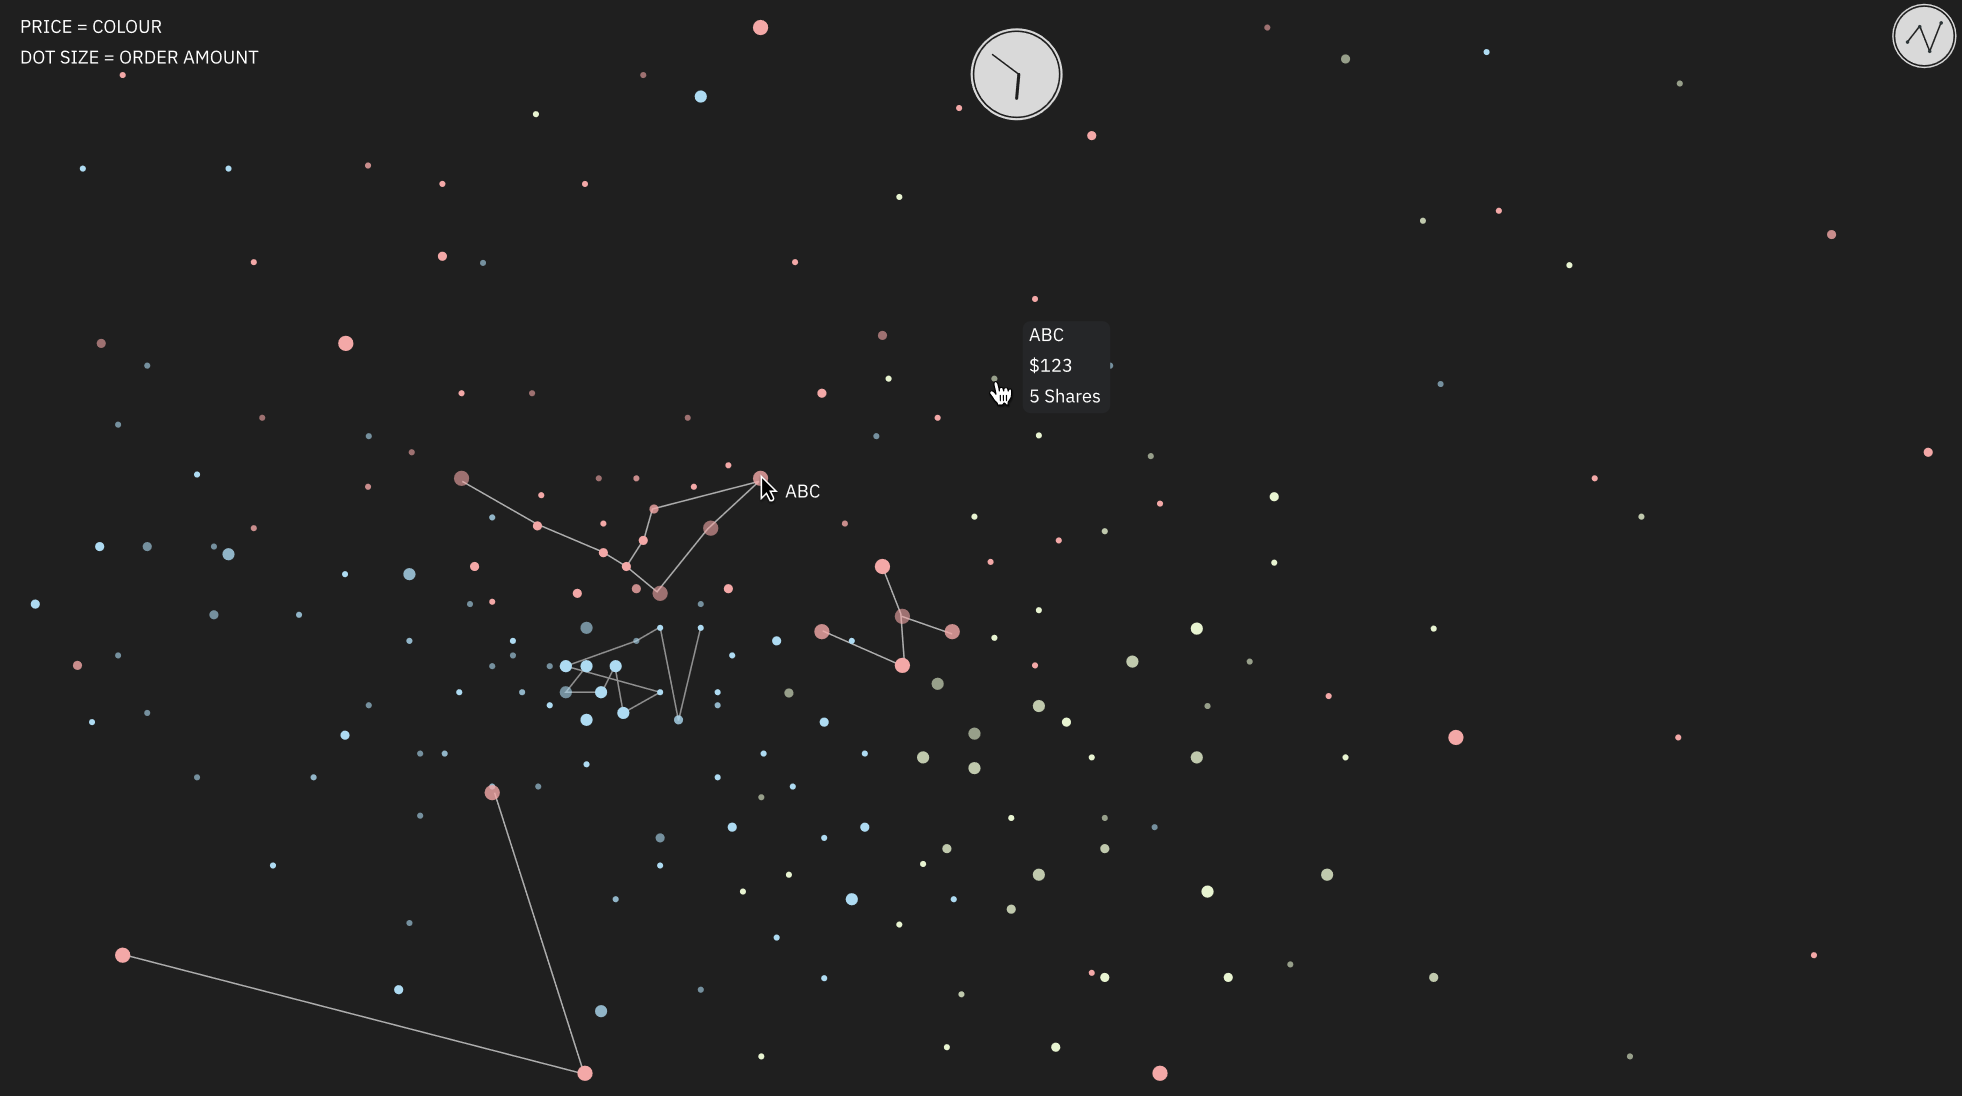
With anomalies

Inspiration
Today anyone can go on their phone and search up the price of a stock and immediately get an answer. What is that price and where does it come from? At its simplest, that price is the execution price of the most recent transaction. Better than nothing but not it is not particularly useful if you want to trade; that price doesn’t tell you what price you would get. In this challenge, we take a data set from the National Bank with three different exchanges from 9:28AM and 9:32AM, totalling more than 200k messages. Exchanges have an order book where all the buy and sell orders are recorded. Market participants, like National Bank, are in constant communication with those exchanges, continuously creating, modifying, and deleting orders on most securities to reflect the latest information. While this sample is but a small fraction of what the bank does, it should give a sense of scale. We render and visualize this data in real time with a ~4minute animated visualization. The goal is to expose patterns in the data that would not be obvious if looking on a message per message basis.
What it does
We were given a dataset of messages between NBF and the exchange. We parsed it to see all of the acknowledged orders within the messages. We then send the data through local web-sockets in order to pretend as if we were receiving the data in almost real-time. Essentially bunch together a bunch of messages (all messages within 1 second) and then send that over to the front-end where we do a little bit of processing and then display the data.
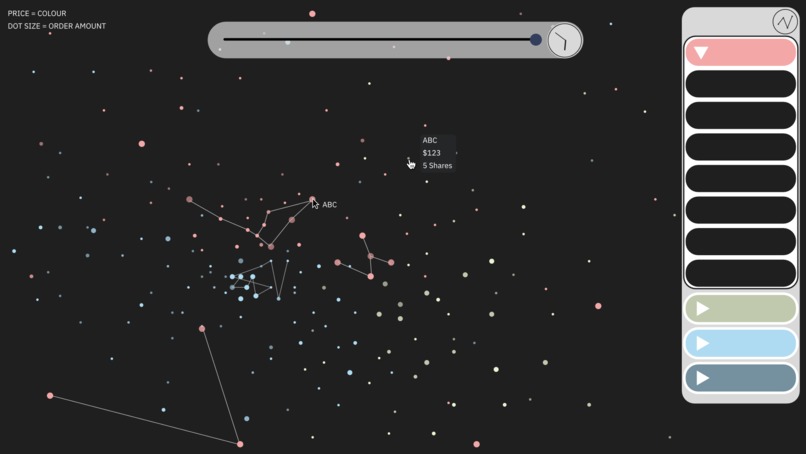
We use p5.js to display the data as a bunch of stars of varying sizes, colours, and duration depending on the volume, company, and price at which the symbol was traded at. We actually have two different views depending on what information you want.
We locate anomalies by looking for volumes of messages that are considered outliers in statistics (that being that the 1st or 3rd quartile -/+ IQR * 1.5). The amount to be consider an outlier is constantly changing every time we output a group of messages. Anomalies are then to be put into a list which are connected with lines to make 'constellations'.
How we built it
Our front-end interface is made of mostly html/css and javascript utilizing the p5.js library to perform the various animations that are showcased within the web page.
Our back-end was built with Nodejs to parse information from the json files that were given to us as a data-set. We also then utilized web-sockets on a local server to communicate the back-end with front-end to replicate the real-time scenario of the data set.
Challenges we ran into
Since this was our first hackathon, we faced many difficulties along the way creating the project. Some examples include:
- Finding out what framework we wanted to use
- Learning how to incorporate the frontend, backend, and design all together.
- Learning how to parse data to make sure that we are actually using meaningful data.
Accomplishments that we're proud of
This was our first hackathon for all of our members in our group. So this was an extremely fun challenge to step outside of our comfort zones and work on something that we mostly have little to no experience with. Furthermore, it was quite spectacular that we were able to make a decent working prototype on what we had believed to be the most difficult prompt.
What we learned
Since this was the first Hackathon and sort of group project of coding for all of our members, we learned how to work together on Github (pull before push and what not).
Furthermore, we learned how to implement code with various new technologies such as:
- Websockets
- node.js
- p5.js
What's next for Starry Stocks
- We want to convert the frontend code from p5.js to react.js to create a more modern design and robustness. Currently right now the code doesn't really support mobile or window resizing.
- Uploading the local server to a domain. We couldn't do it because we need have the proper ssh protocols.
- Add better placements of stars to promote more correlations/relationships.
Built With
- figma
- javascript
- json
- node.js
- p5.js
- websockets


Log in or sign up for Devpost to join the conversation.