Inspiration
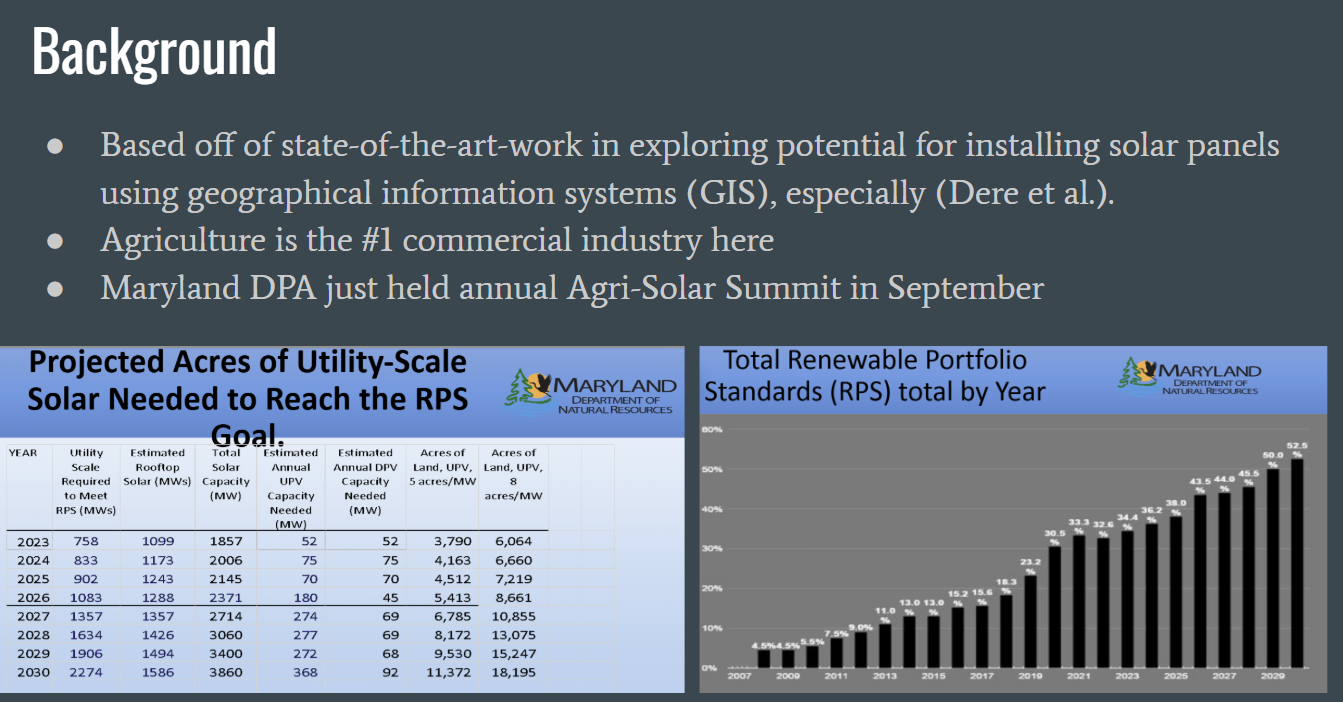
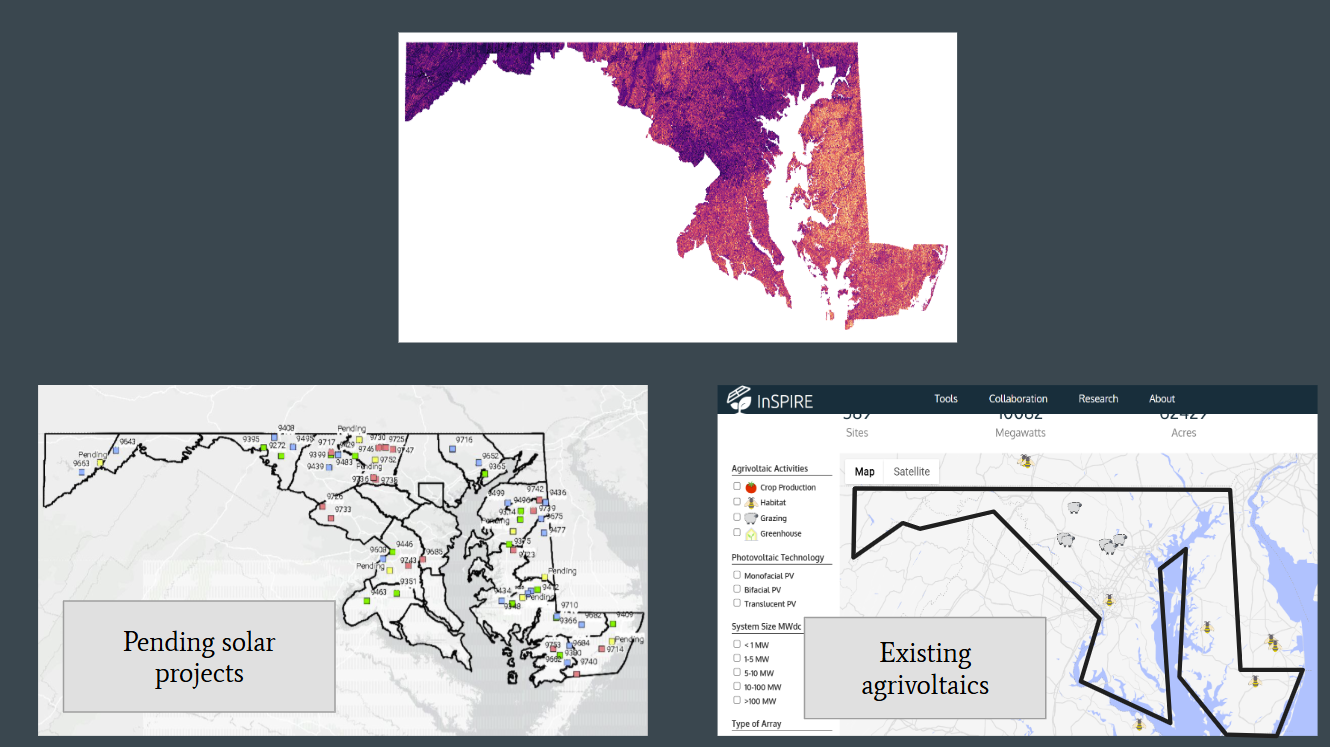
Maryland’s agricultural sector, the state’s largest commercial industry, offers significant potential for integrating agrivoltaic systems: the dual use of land for solar energy production and farming. This approach to increasing renewable energy capacity is becoming of growing interest to the state, highlighted by the Maryland Department of Agriculture’s recent Agri-Solar Summit. As described there, the current solar utility scale, in milliwatts, is projected to have to almost triple in order to reach the state’s Renewable Portfolio Standard goal of 50% of overall electricity generation sales being met through renewable energy resources by 2030. To this end, a data-driven approach to identify optimal sites for agrivoltaic implementation is needed.
How I built it and results
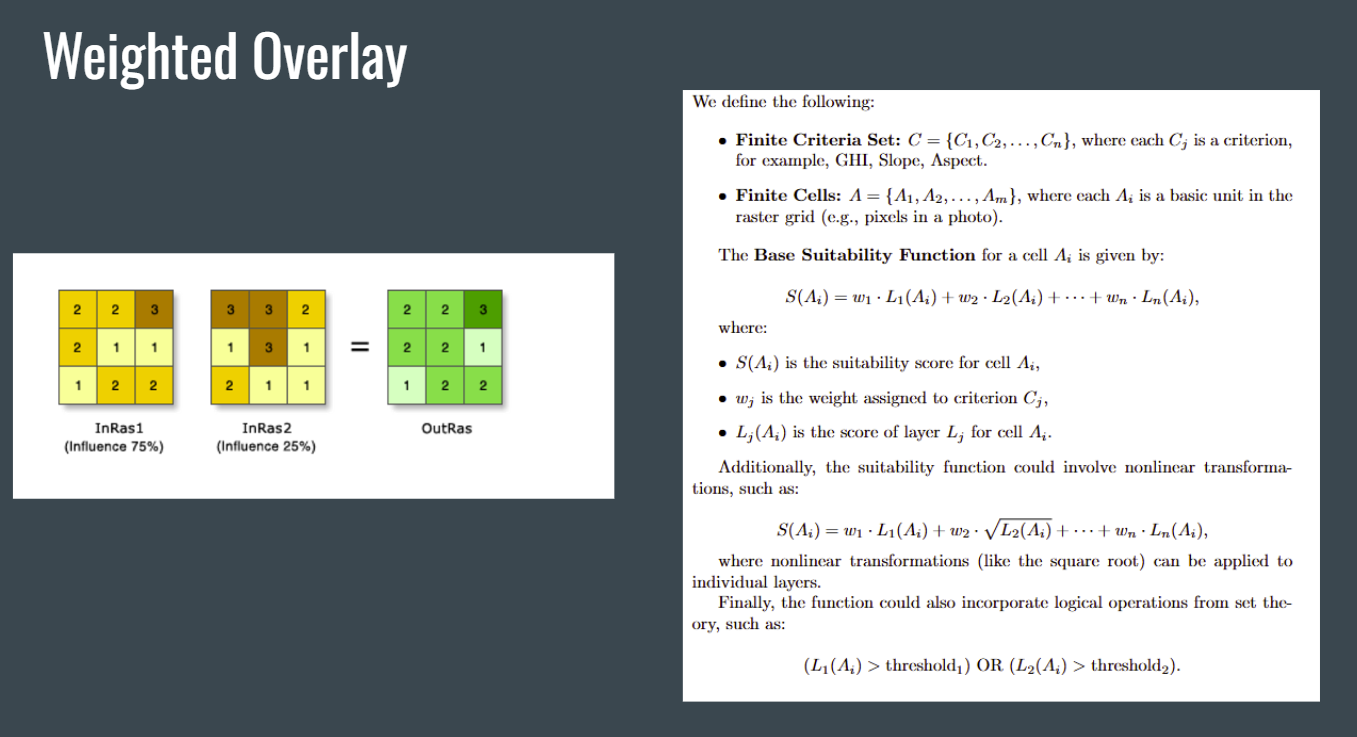
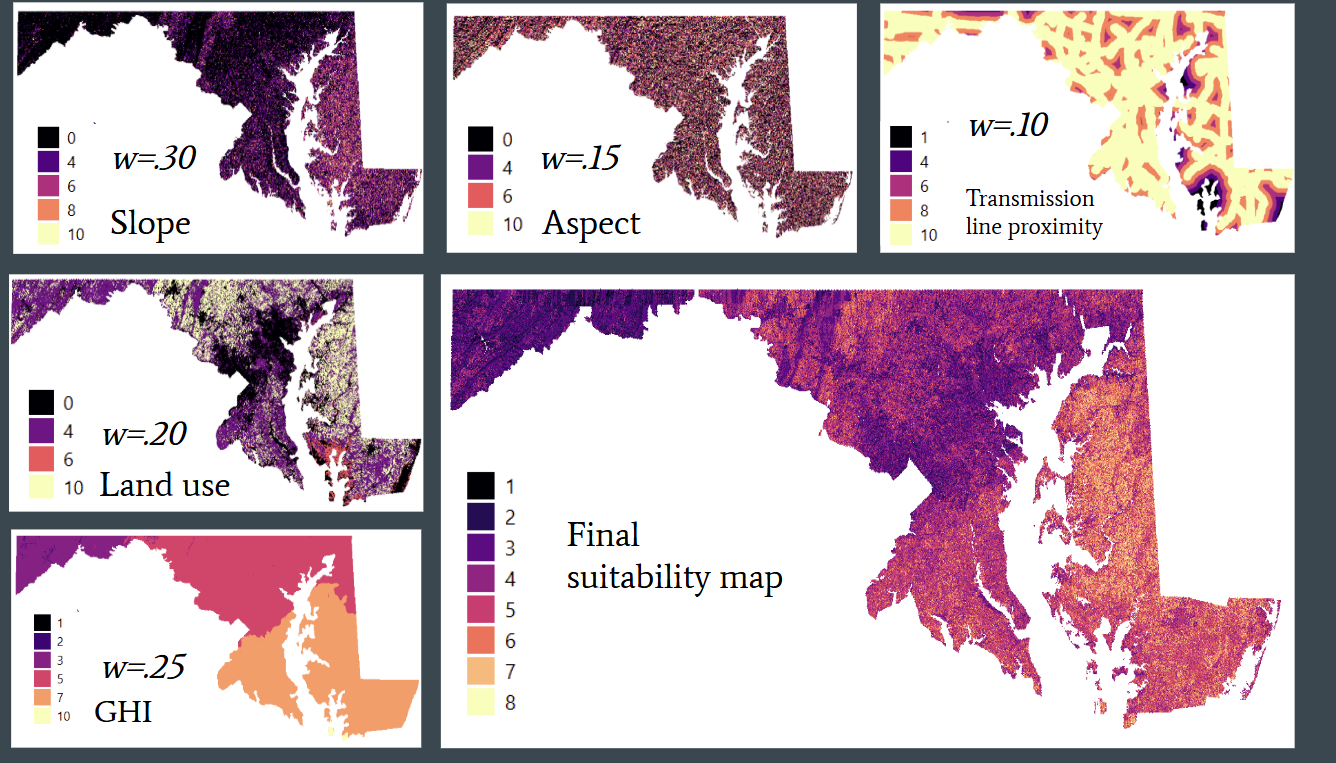
This project employed QGIS's Geographic Information System technologies to develop a suitability map for agrivoltaics across Maryland, based on expert ranked criteria. Factors such as slope, aspect, global horizontal irradiance, land use, and proximity to transmission lines were given weights in regards to their influence on solar power generation and reclassified to scores from zero to ten. The data used was all open access, coming from places like the USGS EarthExplorer, SolarGIS, US Census, and Maryland's Open GIS Portal. After a weighted sum calculation, the resulting map indicates areas with high solar suitability while balancing agricultural productivity, offering insights for stakeholders and sustainable energy policy.
Challenges and what I learned
There were a lot of challenges initially because I first started the project purely in Python because I was not familiar with existing software. After finding out about QGIS, there were some issues with getting all of the data imported and processed. Now, after all of the late nights of troubleshooting, I am competent at using QGIS, as well as the entire GIS workflow.
What's next for Solar & Soil: Mapping Maryland Agrivoltaics Potential
I have plans to use ArcGIS as it seems to be more robust. I also want to add even more data, such as seasonal precipitation, seasonal evapotranspiration, water stress index, proximity to rivers and lakes, airports, protected areas, roads and railways. I also want to consult with experts in the field.
Built With
- earthexplorer
- mdgis
- qgis
- usgs


Log in or sign up for Devpost to join the conversation.