-
-
Dashboard
-
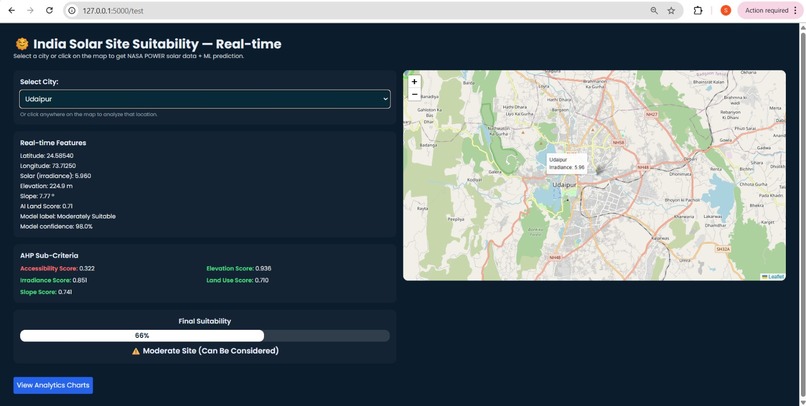
Suitability Score Page
-

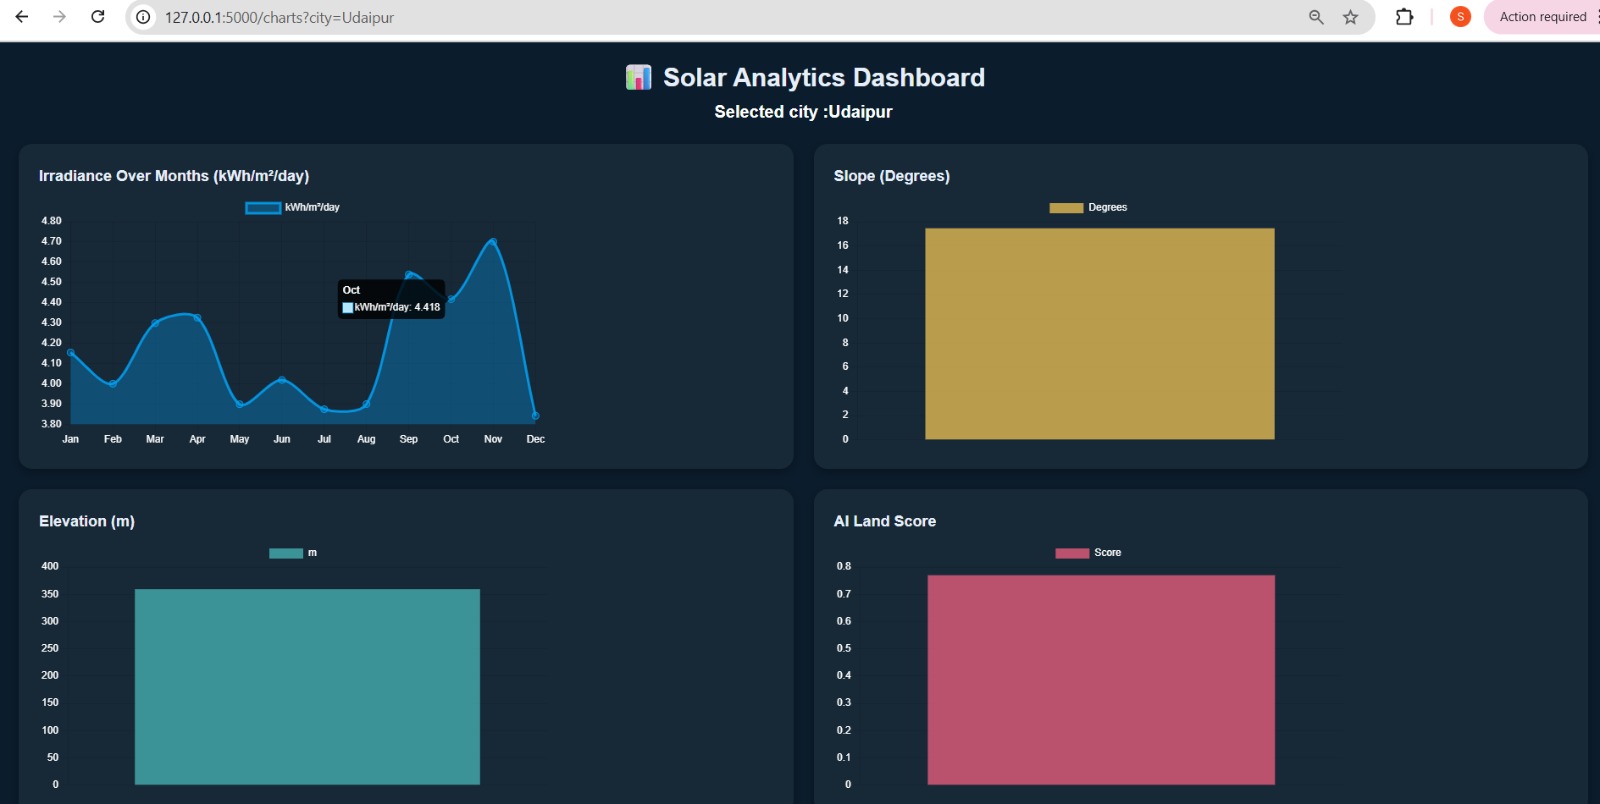
Solar Analytics Dashboard

⭐ Inspiration
Solar installation planning usually requires expert knowledge about irradiance, slope, elevation, and land conditions. I wanted to make this process simple and accessible. The idea was to build a tool where anyone can click on a map and instantly know whether a location (in India) is suitable for solar energy using real data and AI.
⚡ What it does
- Fetches real solar irradiance from the NASA POWER API
- Generates slope, elevation, and land-use scores synthetically
- Runs a Random Forest ML model to classify the site
- Computes a final suitability score using a weighted AHP-inspired formula
- Visualizes results on an interactive map (Leaflet.js)
- Displays analytics charts for irradiance, slope, elevation, and land score
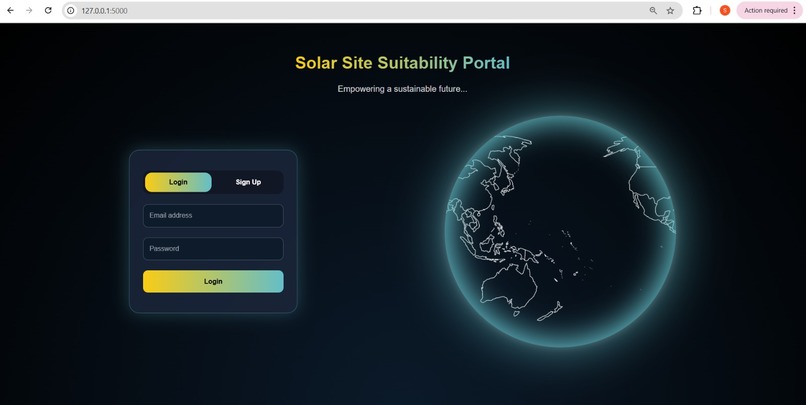
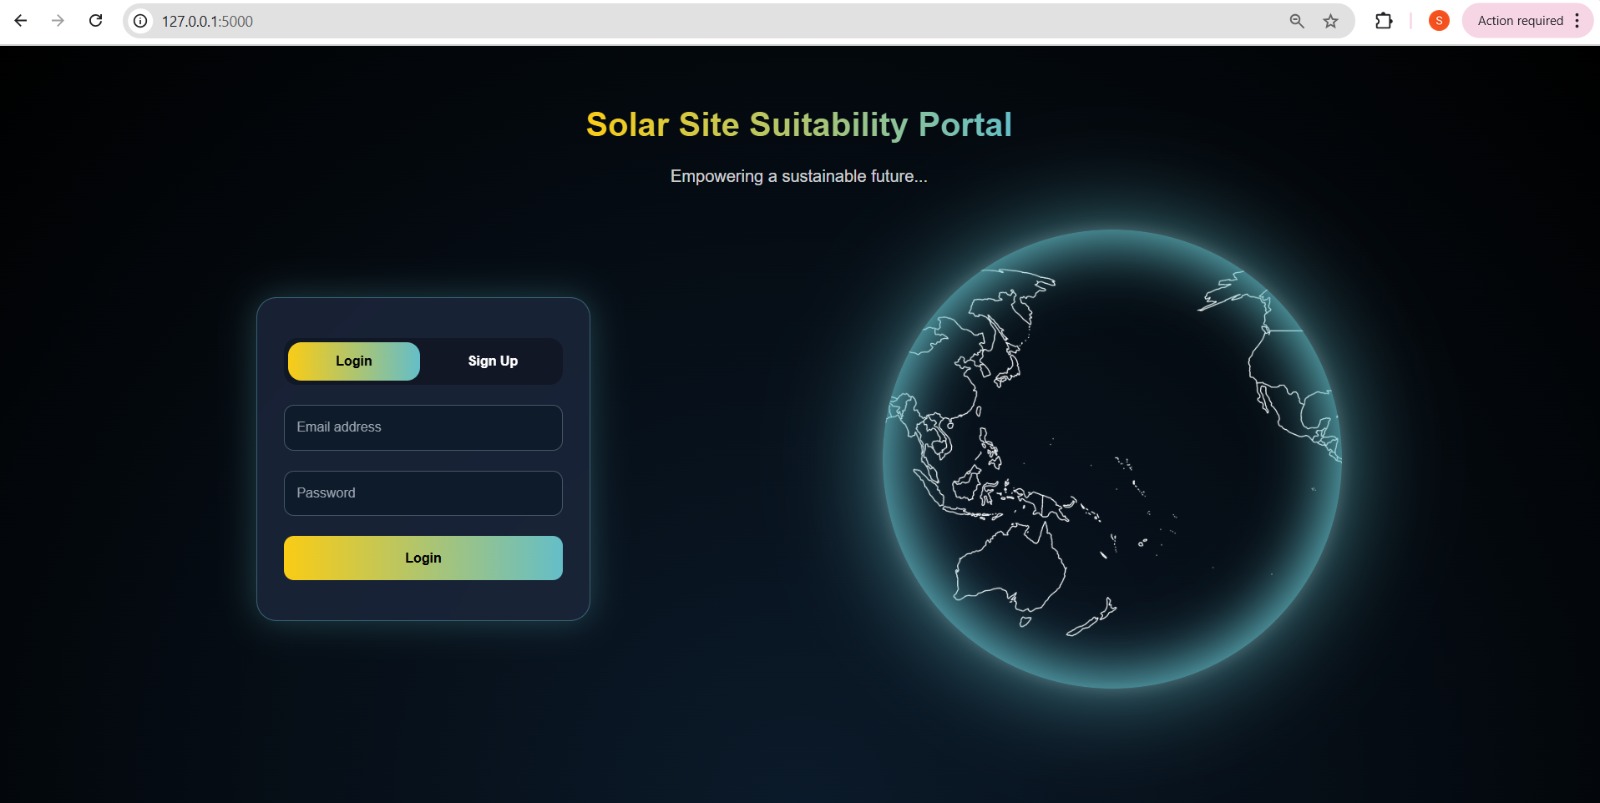
- Includes user authentication with signup and login
🛠️ How I built it
Node.js + MongoDB for authentication Flask (Python) for ML, NASA API integration, and suitability computation Leaflet.js for an interactive India map Chart.js for analytics dashboards TailwindCSS + Vanilla JS for the UI ML model trained on synthetic dataset based on heuristics AHP-style scoring function:
[ Score = 0.6 \cdot s_{\text{irr}} + 0.25 \cdot \left(1 - \frac{slope}{30}\right) + 0.15 \cdot landAI ] 🚧 Challenges I ran into
NASA API timeouts → solved using fallback synthetic irradiance No real labeled dataset → created synthetic training data Managing two servers (Node + Flask) without routing conflicts Dynamic chart generation required destroying and reinitializing charts Ensuring map interactions update all values smoothly
🏆 Accomplishments that I am proud of
Successfully integrated real NASA satellite data with ML predictions Built a fully functional map-based real-time analysis tool Implemented a hybrid model combining ML and AHP decision scoring Designed a clean analytics dashboard that updates based on user-selected cities Achieved a complete end-to-end workflow with two backends and multiple UIs
📚 What I learned
- Integrating geospatial data with ML models
- Designing synthetic datasets when real labels are unavailable
- Handling cross-backend communication (Node ↔ Flask)
- Building real-time map interactions with Leaflet
- Applying AHP-style multi-criteria decision-making
🚀 What’s next for Solar Site Suitability Portal
Use real DEM (elevation/slope) data instead of synthetic Add rooftop segmentation using computer vision Provide ROI and cost-benefit analysis Deploy on cloud platforms for public use
Built With
- chart.js
- express.js
- flask
- javascript
- leaflet.js
- mongodb
- nasapowerapi
- node.js
- poppings(googlefont)
- python
- randomforest
- scikit-learn
- tailwindcss


Log in or sign up for Devpost to join the conversation.