-
-
Solar Shield Logo
-
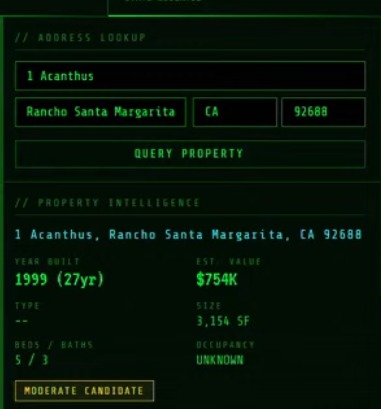
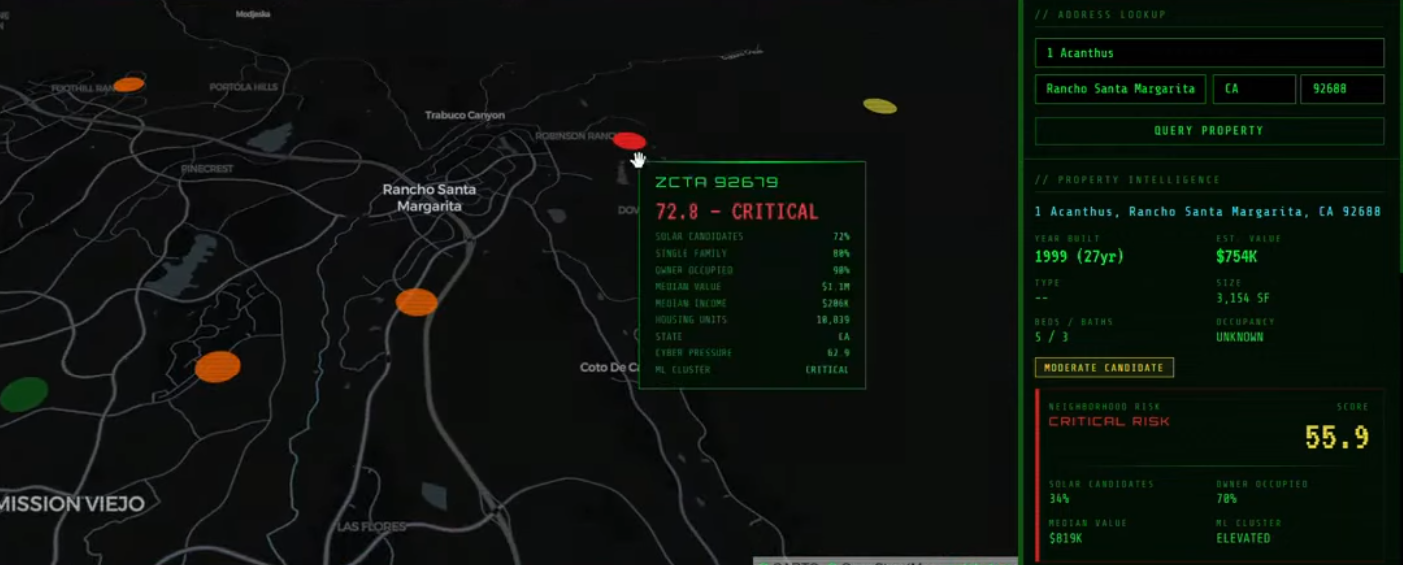
Melissa Property API Address Lookup
-
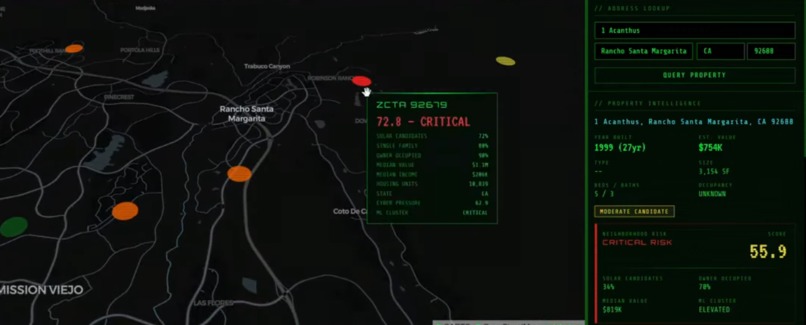
Critical Risk Assessment View
-
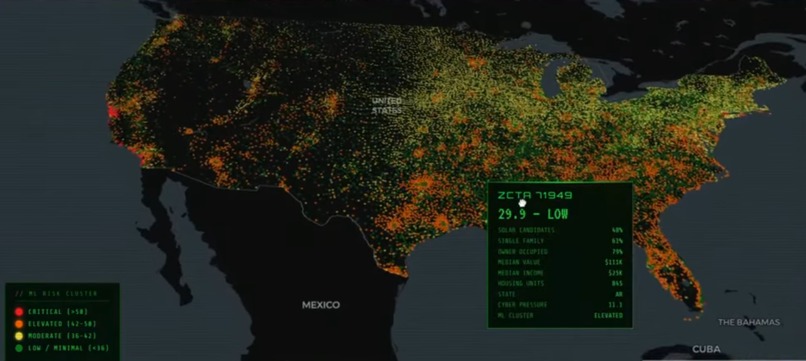
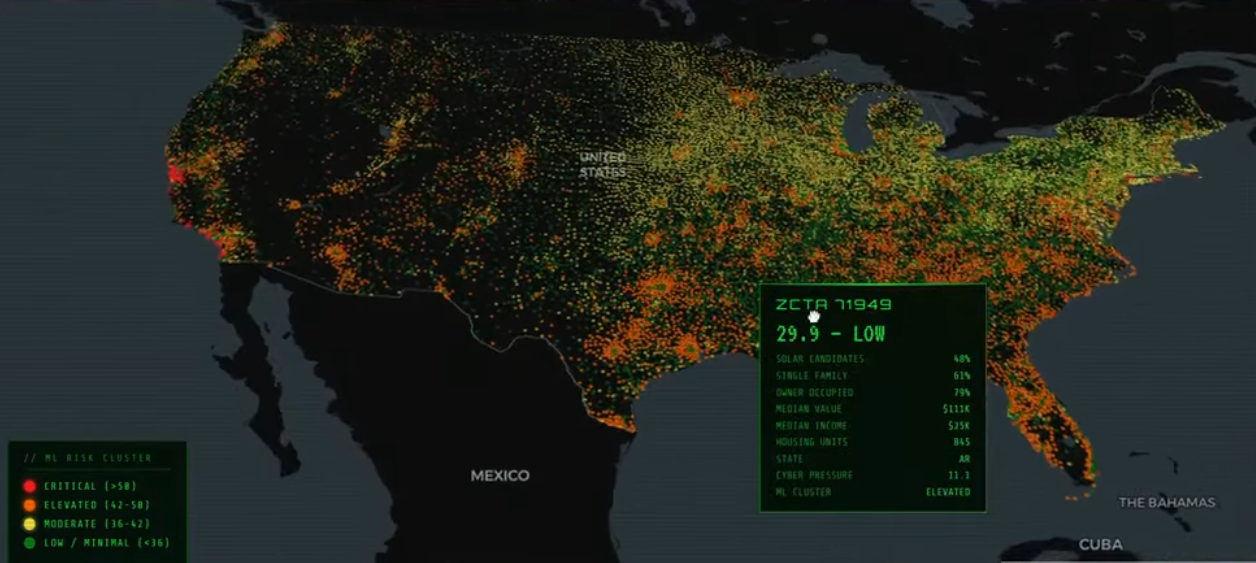
Top-down U.S. Risk Trends

Inspiration
In 2015, hackers infiltrated Ukraine’s power grid control systems, remotely shutting off electricity to 230,000 people.
Solar invertors are a critical access point to power grid systems that hackers target. The world's third-largest invertor manufacturer shipped devices with a default password of "123456." 35,000 solar devices from 42 vendors are publicly exposed on the internet right now. Researchers found that controlling just 2% of invertors is enough to trigger a cascading blackout.
Solar Shield predicts vulnerable risk regions and notifies residents before an attack.
What it does
Solar Shield scores every ZIP code in the United States on how likely they are to contain vulnerable solar invertors. It combines two things: where solar infrastructure is most concentrated, and how severe the known cyber vulnerabilities are. The result is an interactive threat map that shows utilities and grid operators exactly where to focus.
How we built it
We pull cyber threat intelligence from NIST's vulnerability database and CISA's catalog of actively exploited vulnerabilities. We pull community data from the U.S. Census for every ZIP code nationwide: housing types, home ownership rates, property values, income. We use the Melissa Data API for property-level address lookups so users can check a specific home against its community risk profile. We score each community on solar readiness, weight it against real CVE severity data, and cluster ZIP codes into five risk tiers. Everything is served through a FastAPI backend to a deck.gl map dashboard.
Challenges we ran into
Getting clean nationwide coverage across 33,000 ZIP codes. The Census API doesn't support per-state queries at the ZIP level, so we had to build a single national request and handle the joins carefully. We also had to be disciplined about what the model claims. It predicts where vulnerable infrastructure is likely concentrated, not that any specific device is compromised.
Accomplishments that we're proud of
Full nationwide coverage in one pipeline run. Every ZIP code in the country scored, clustered, and rendered on a live map with real vulnerability data behind every number.
What we learned
The gap between "vulnerability disclosed" and "devices patched" is measured in years, not weeks. The CVEs that enabled real attacks, like SolarView devices hijacked for bank theft in Japan and Growatt bugs that let anyone take over another user's installation, are still unpatched and live.
What's next for Solar Shield
Live Shodan integration to cross-reference our predictions against actually exposed devices. Utility service territory overlays so grid operators can filter by their own coverage area. Automated alerts when new solar CVEs hit communities in the top risk tier.
Built With
- cisa-known-vulnerabilities-api
- claude
- css
- deck.gl
- eia
- fastapi
- html
- javascript
- melissa-data-address-object
- nist-national-vulnerability-database
- python
- u.s.-census-acs

Log in or sign up for Devpost to join the conversation.