Inspiration
Space knowledge is beautiful but fragmented. A planetary image may live in a mission archive, solar observations in a NASA instrument feed, and space-weather context in a NOAA product.
We wanted to create a different kind of educational experience: not a dense dashboard and not a simplified animation, but a cinematic, source-linked atlas that makes people curious enough to ask: What am I looking at? Who observed it? And how does the Sun connect to Earth?
What it does
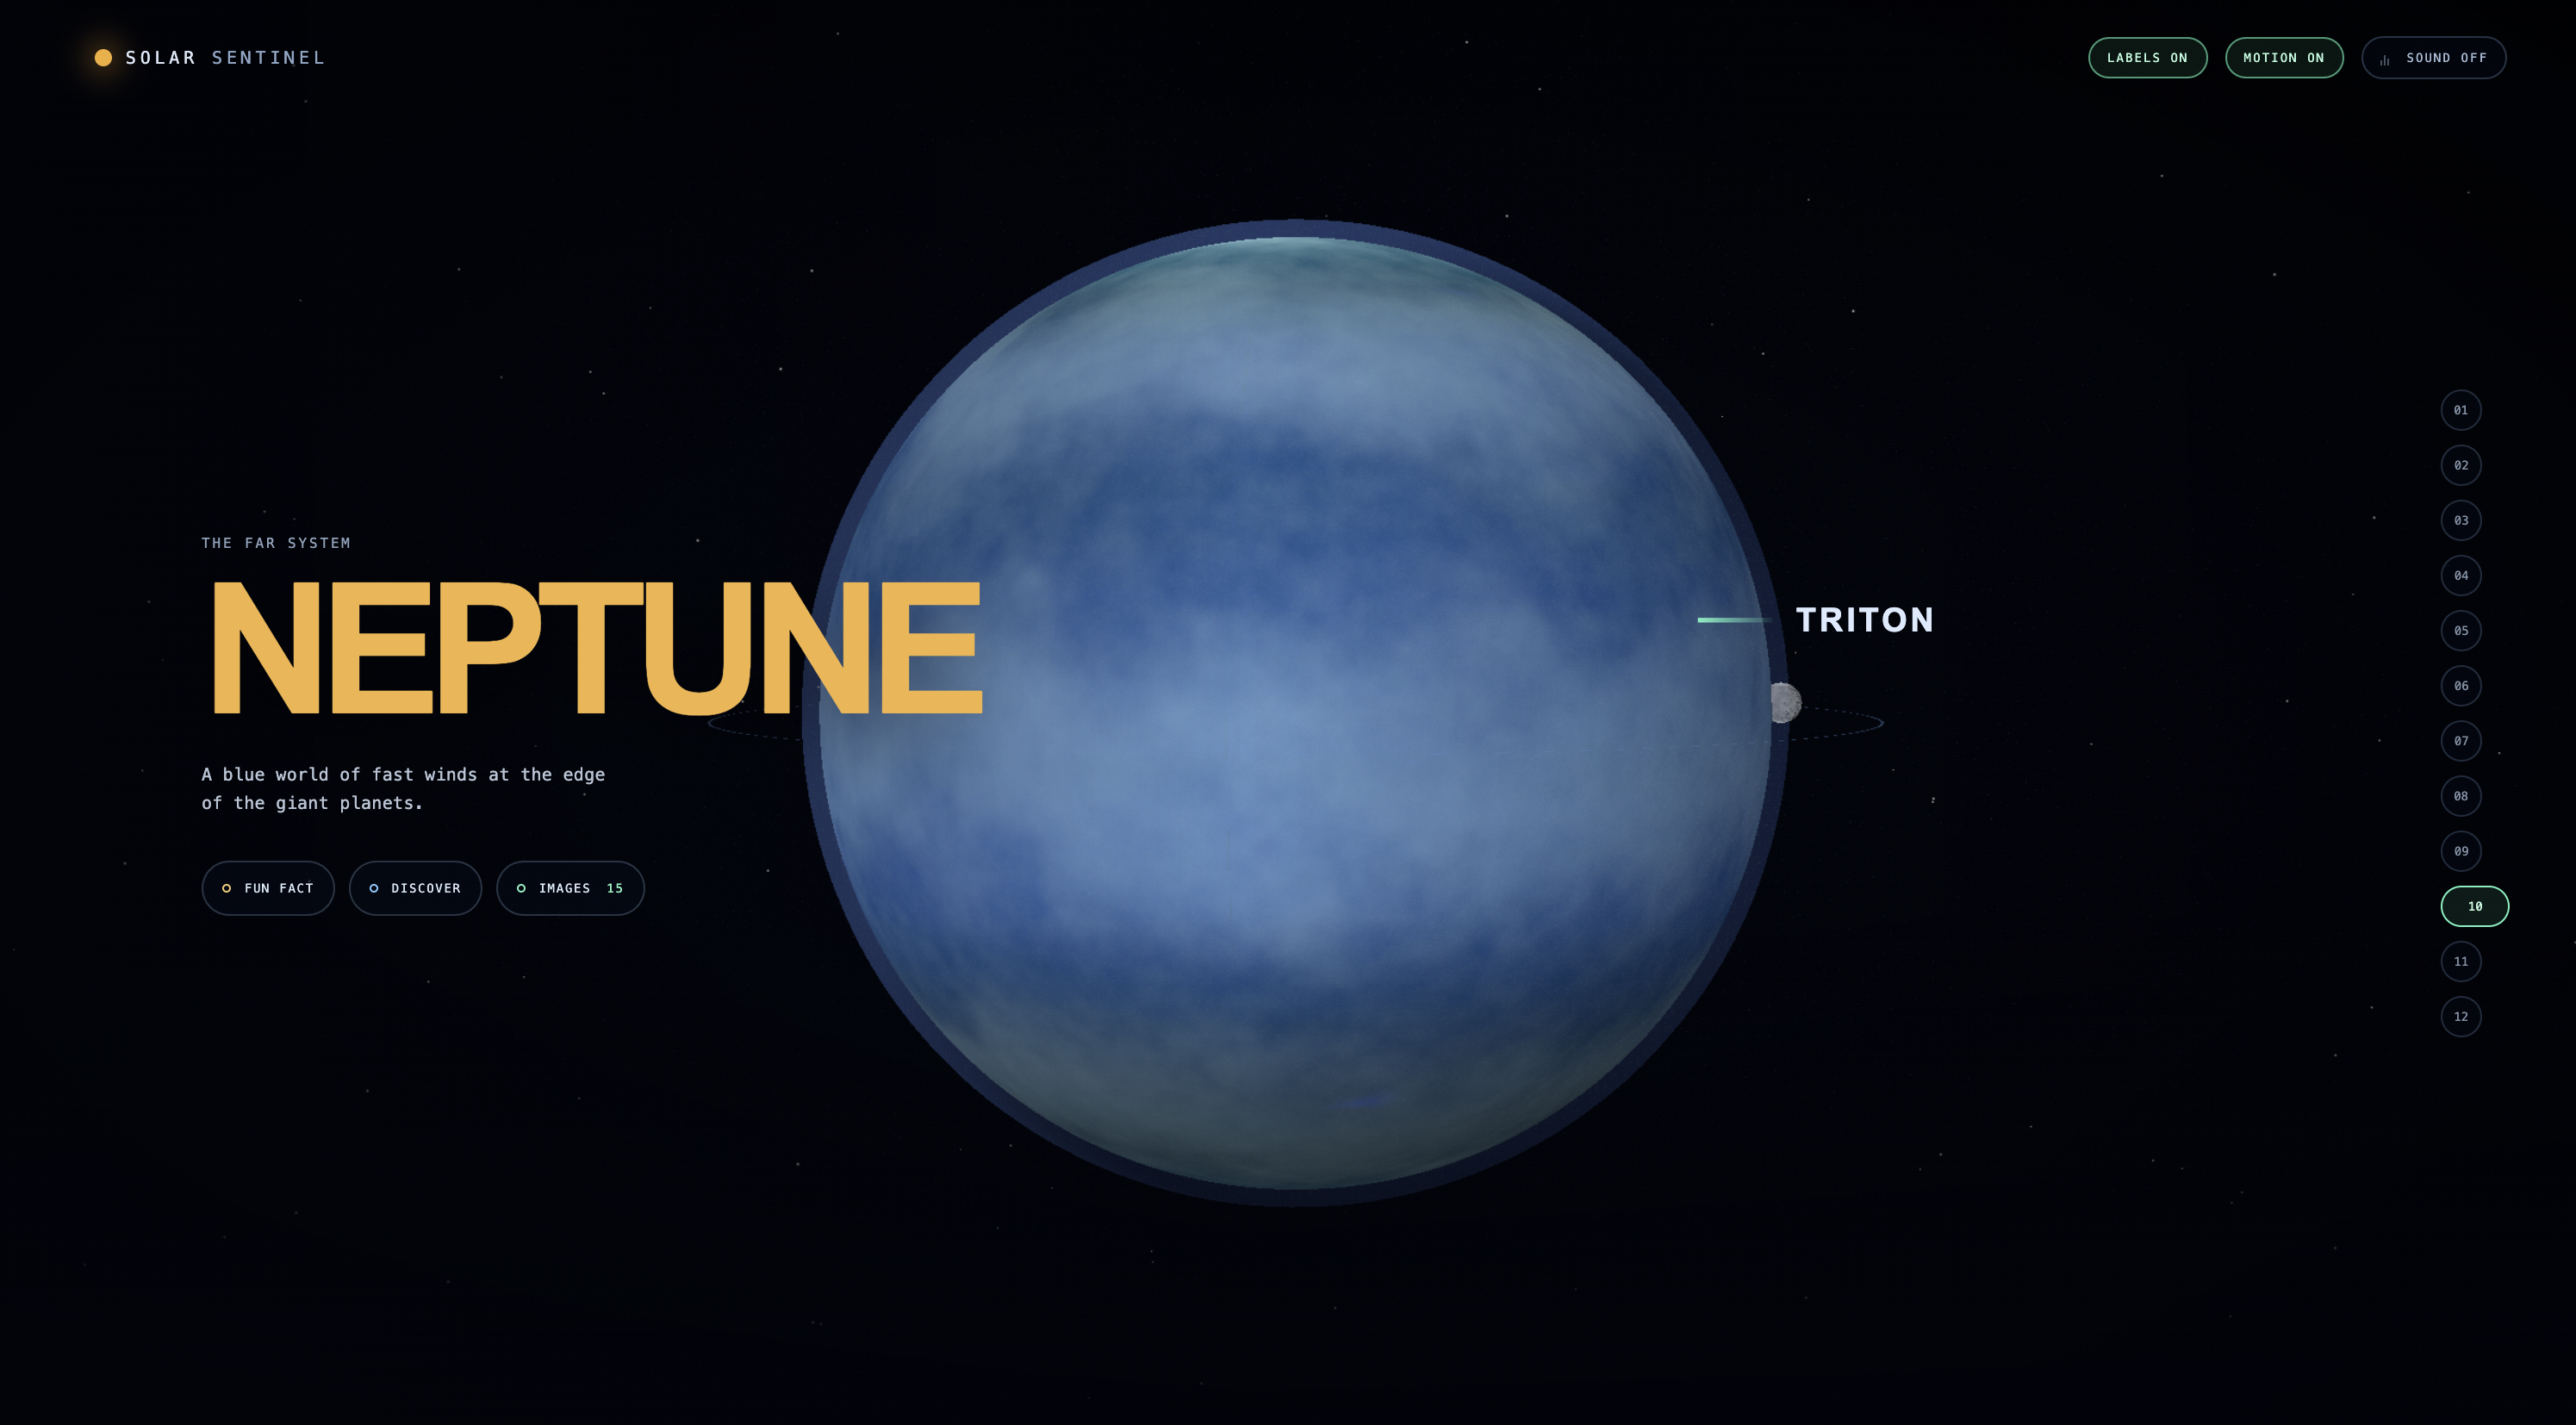
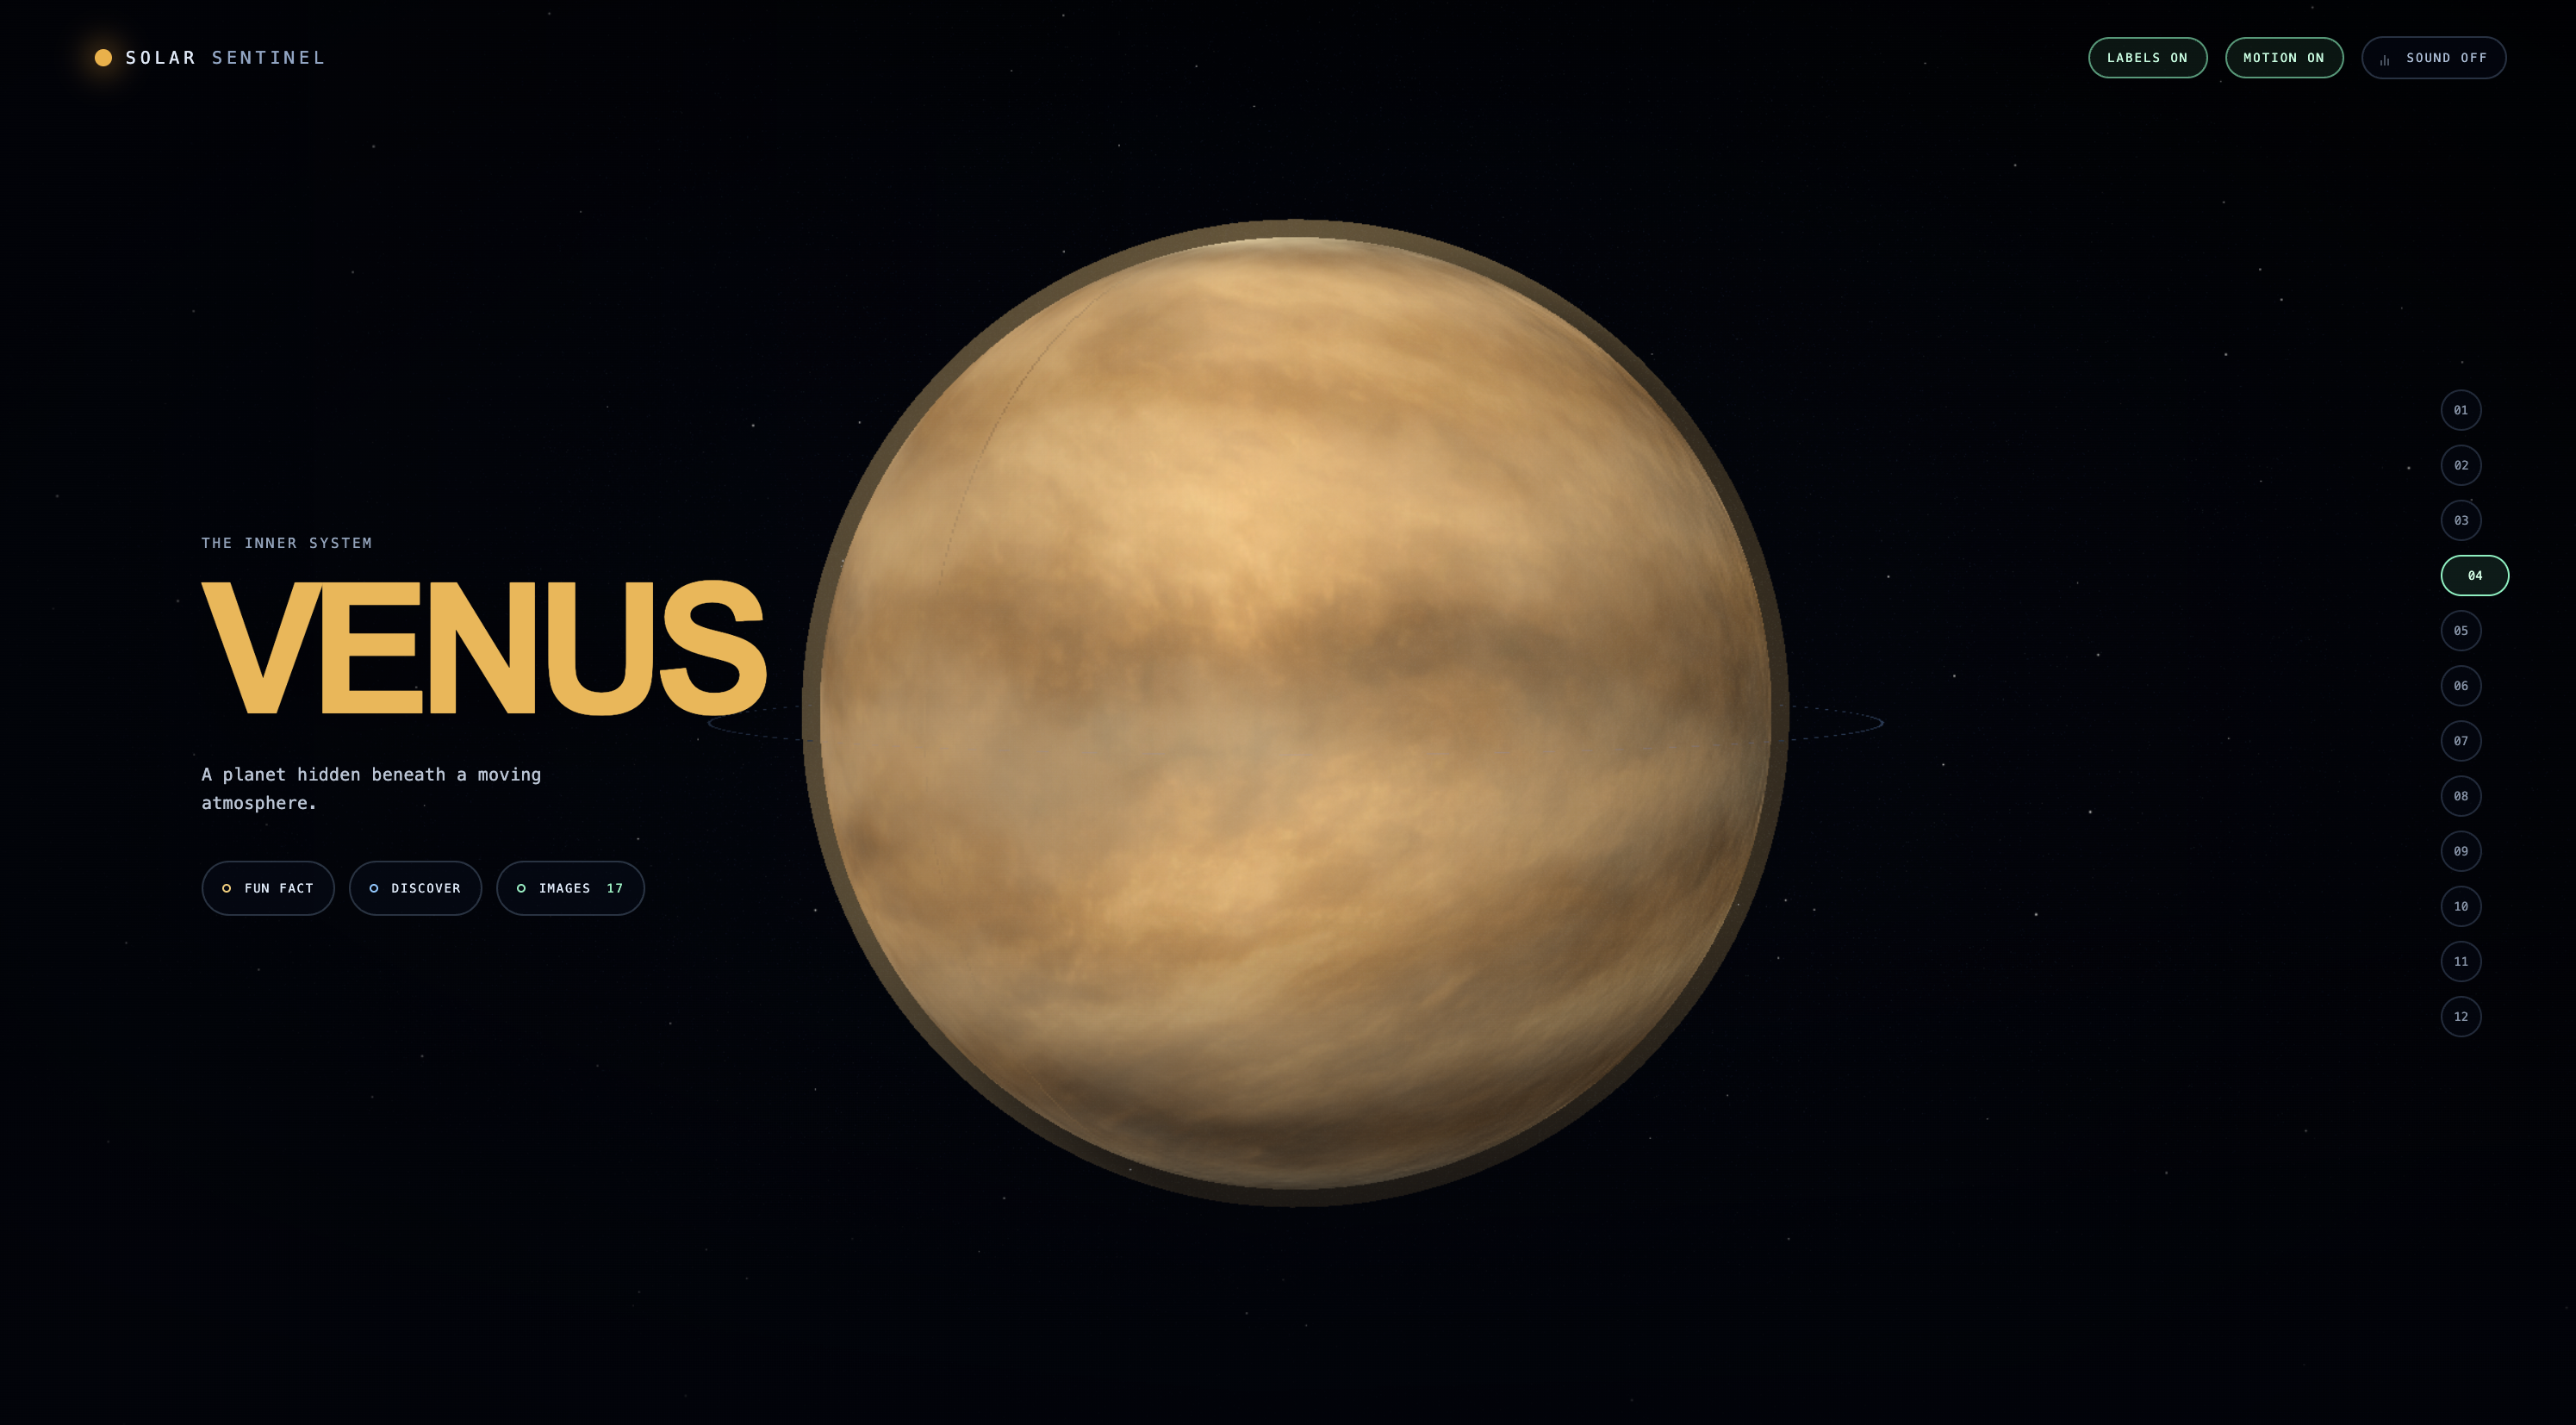
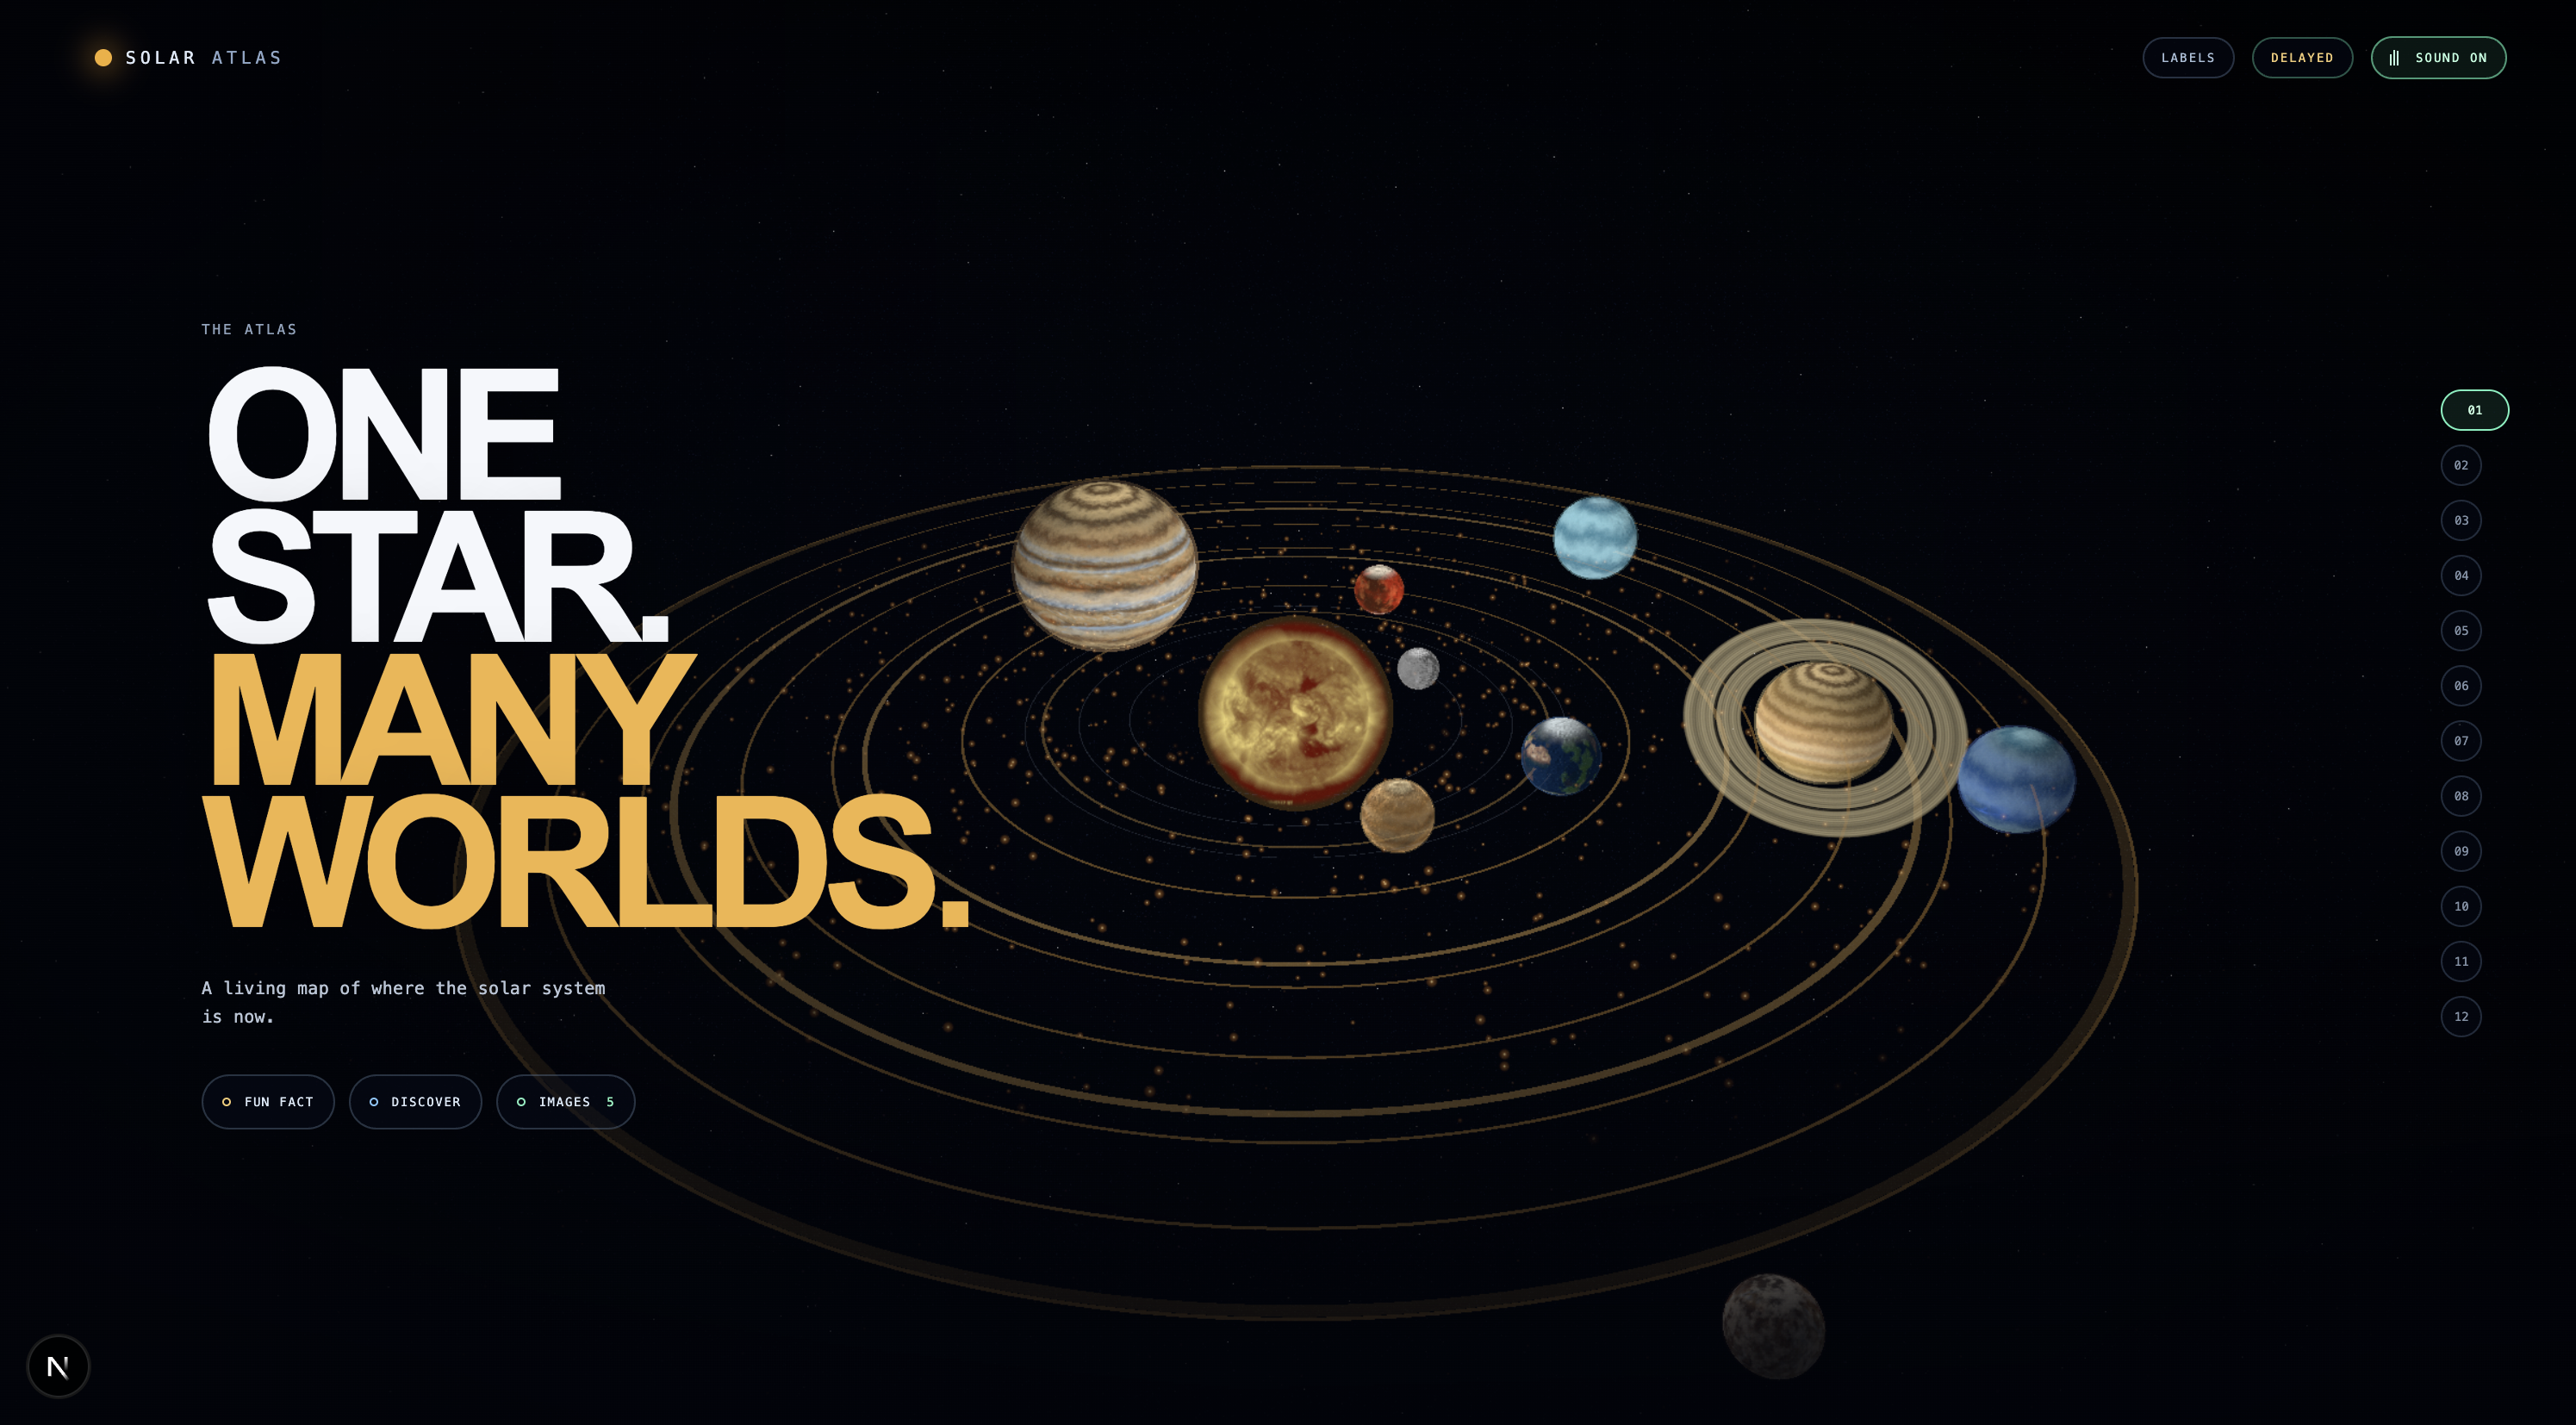
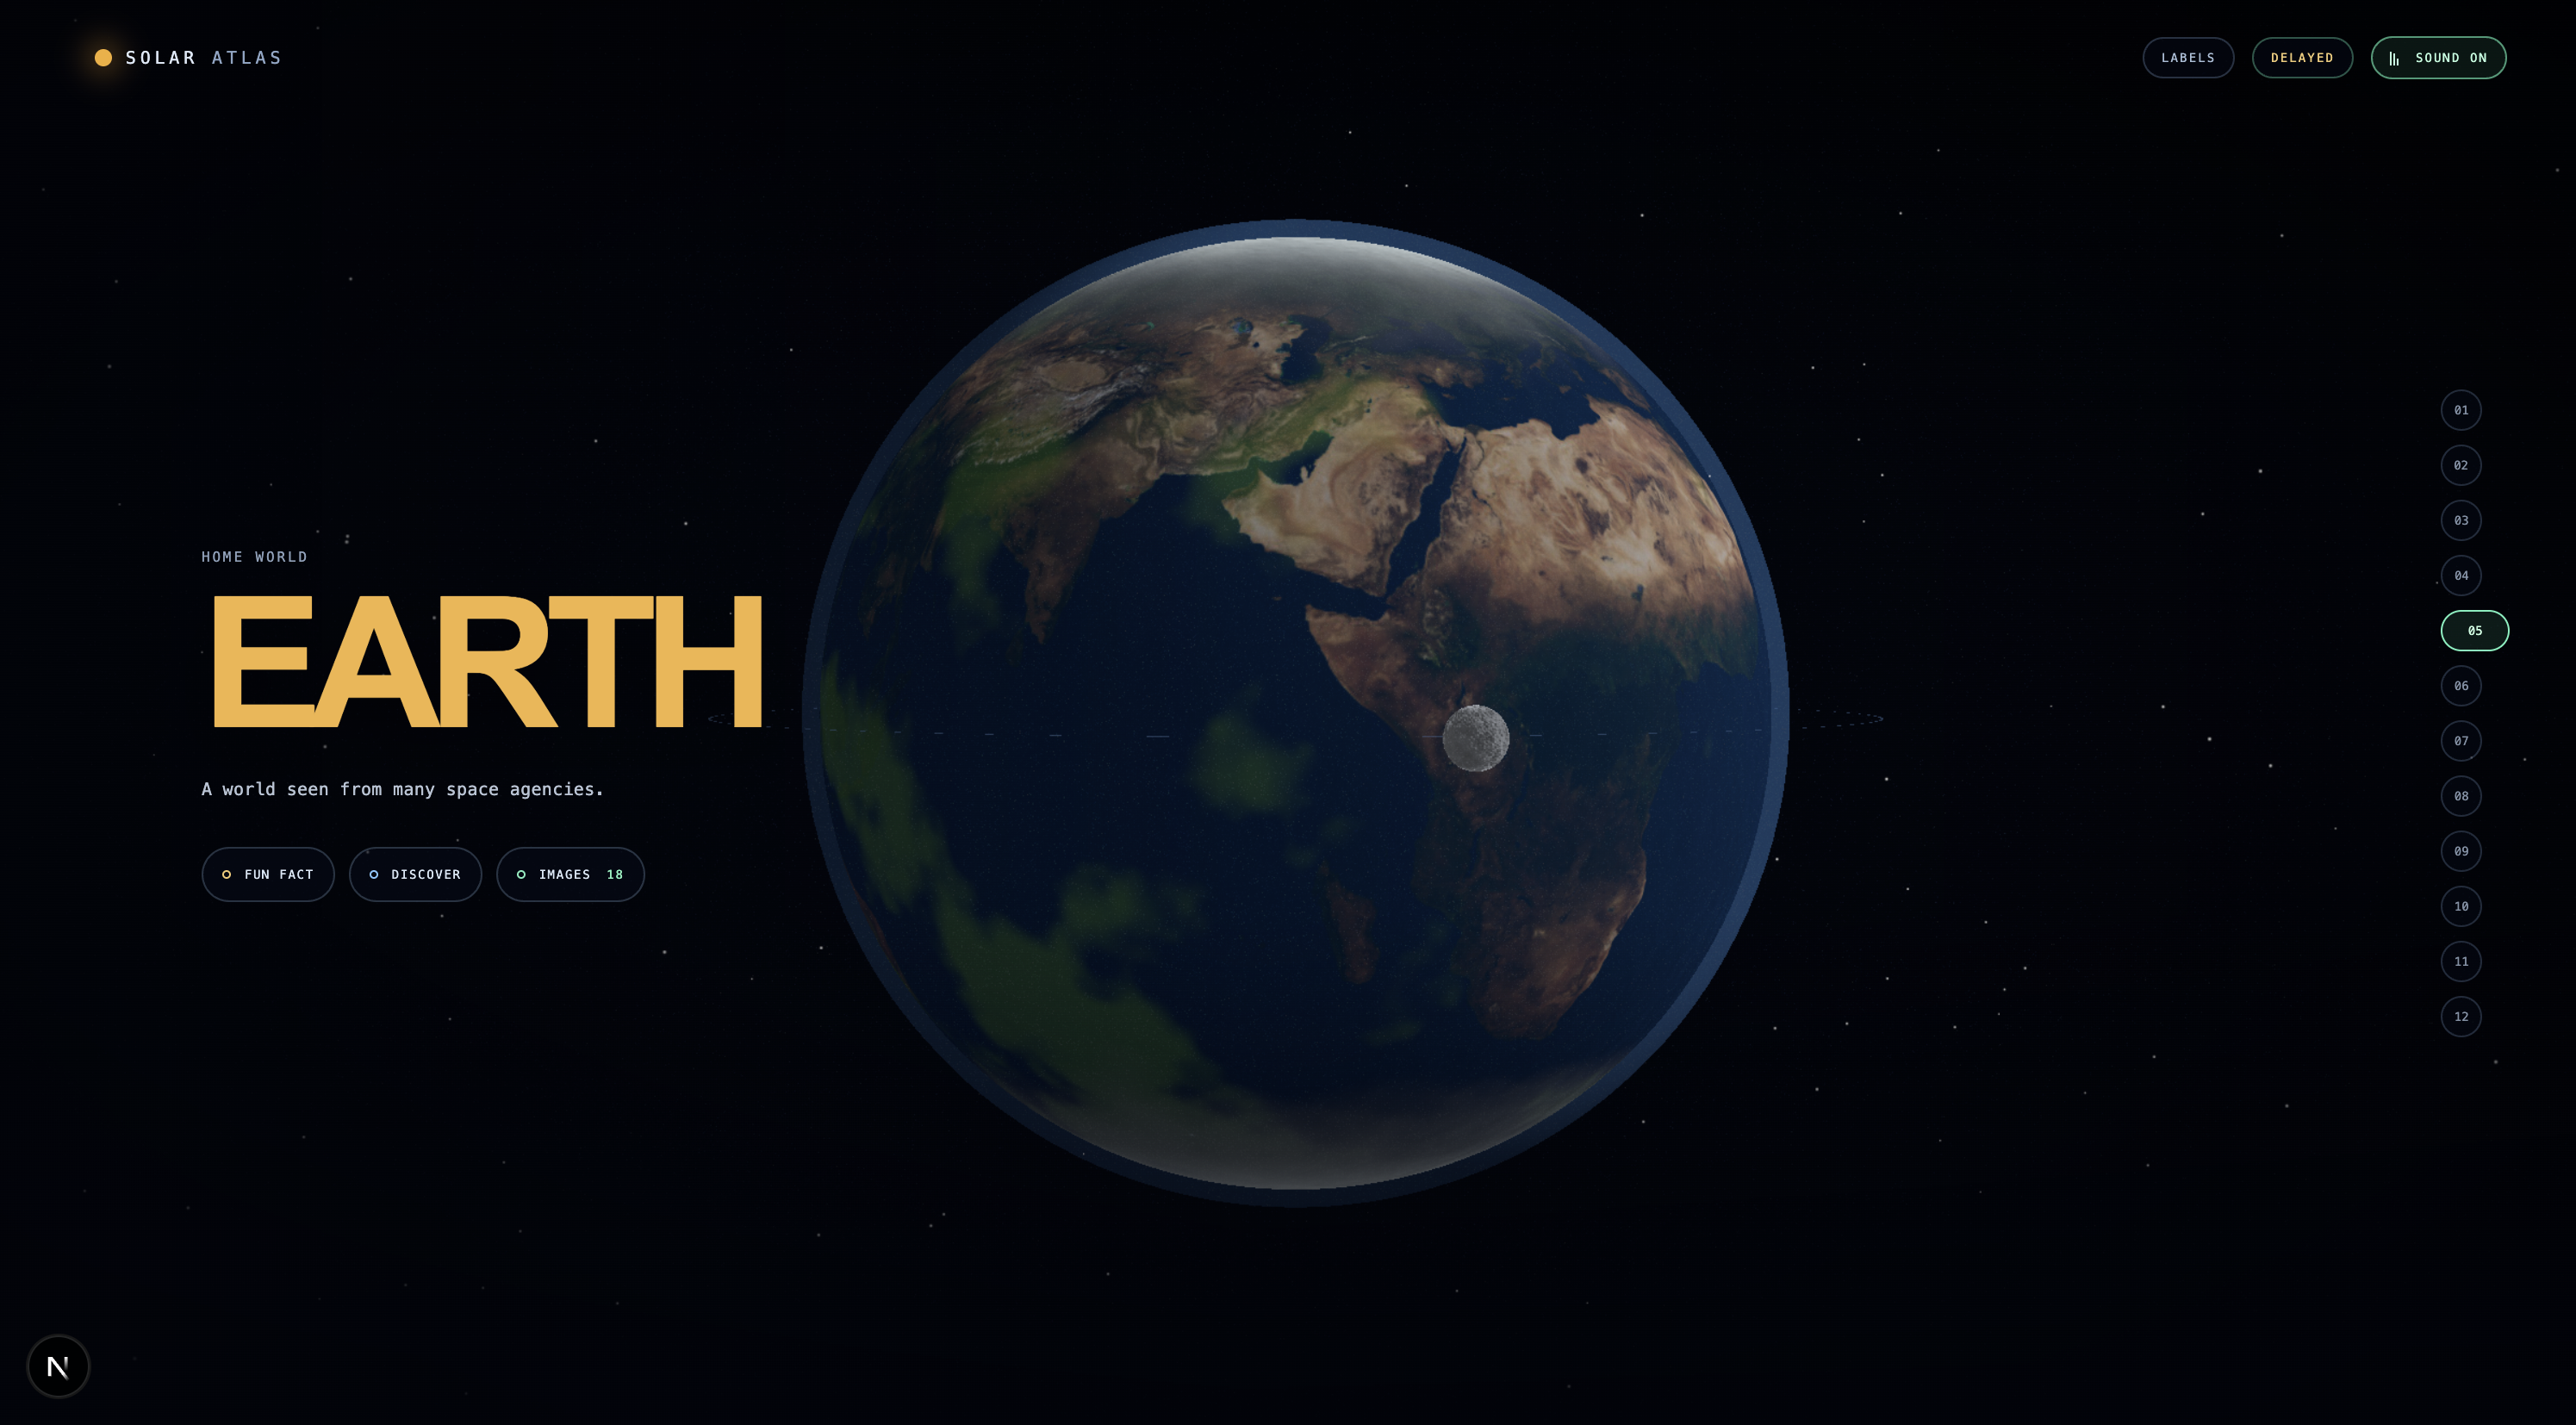
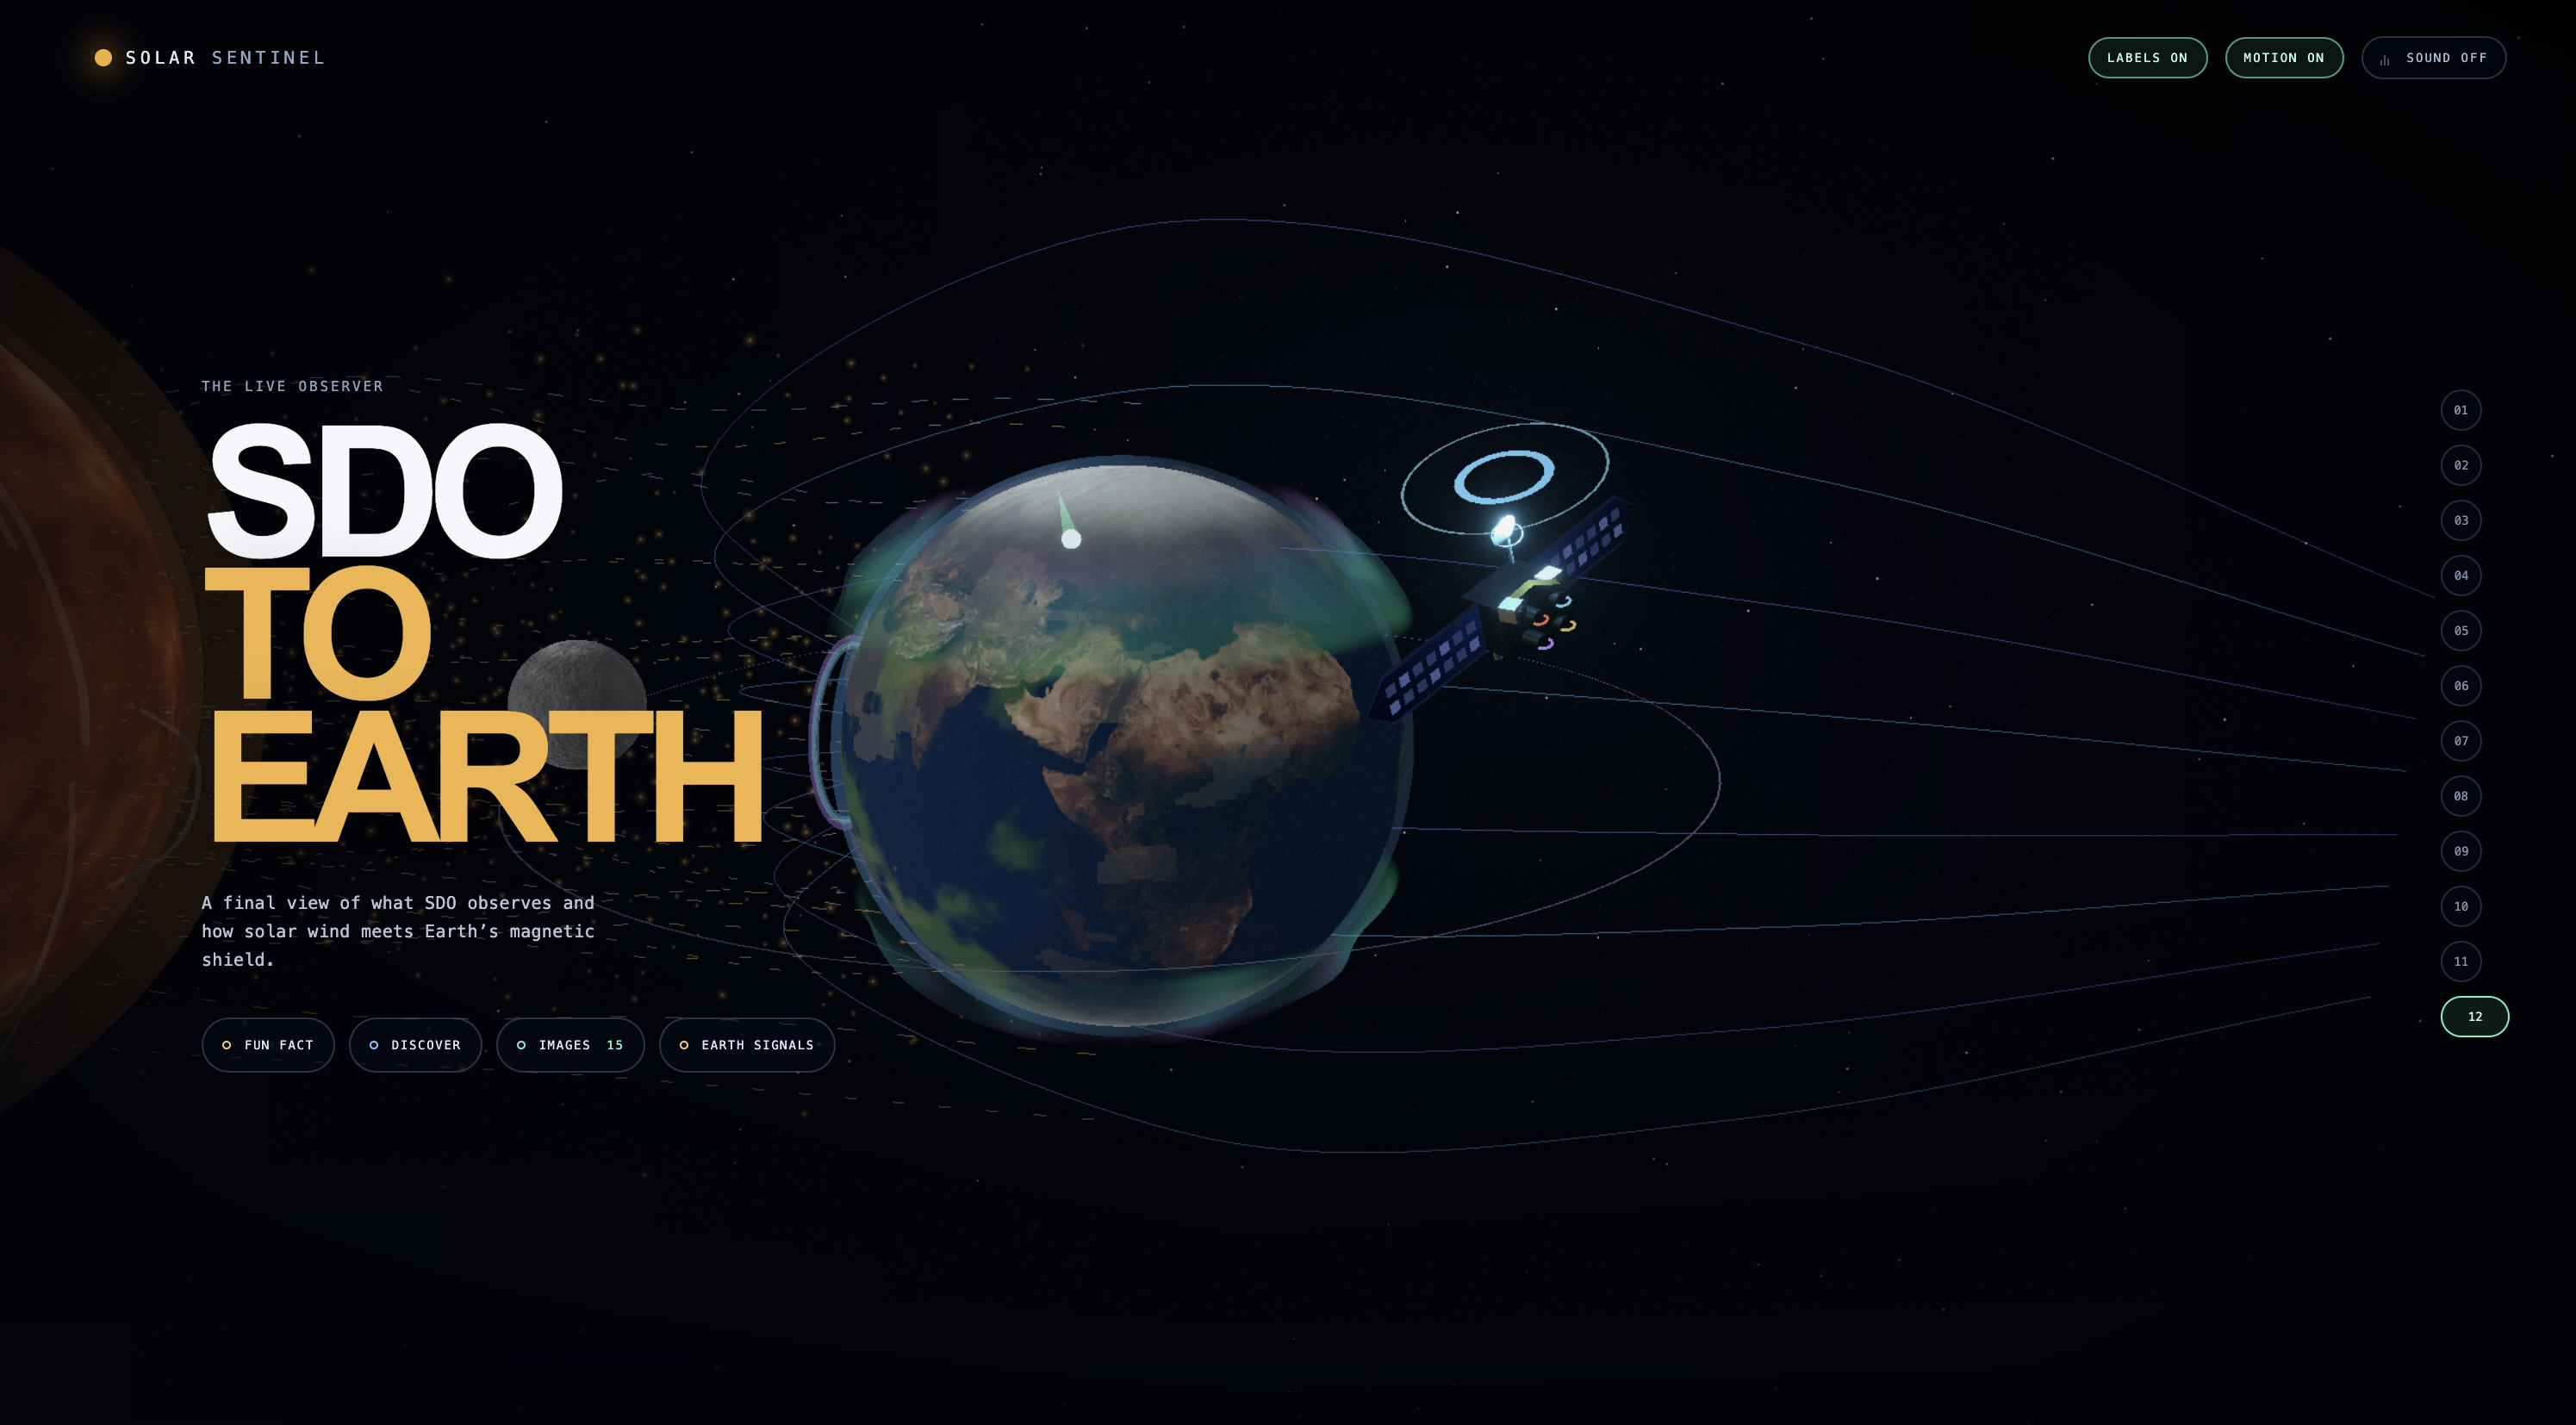
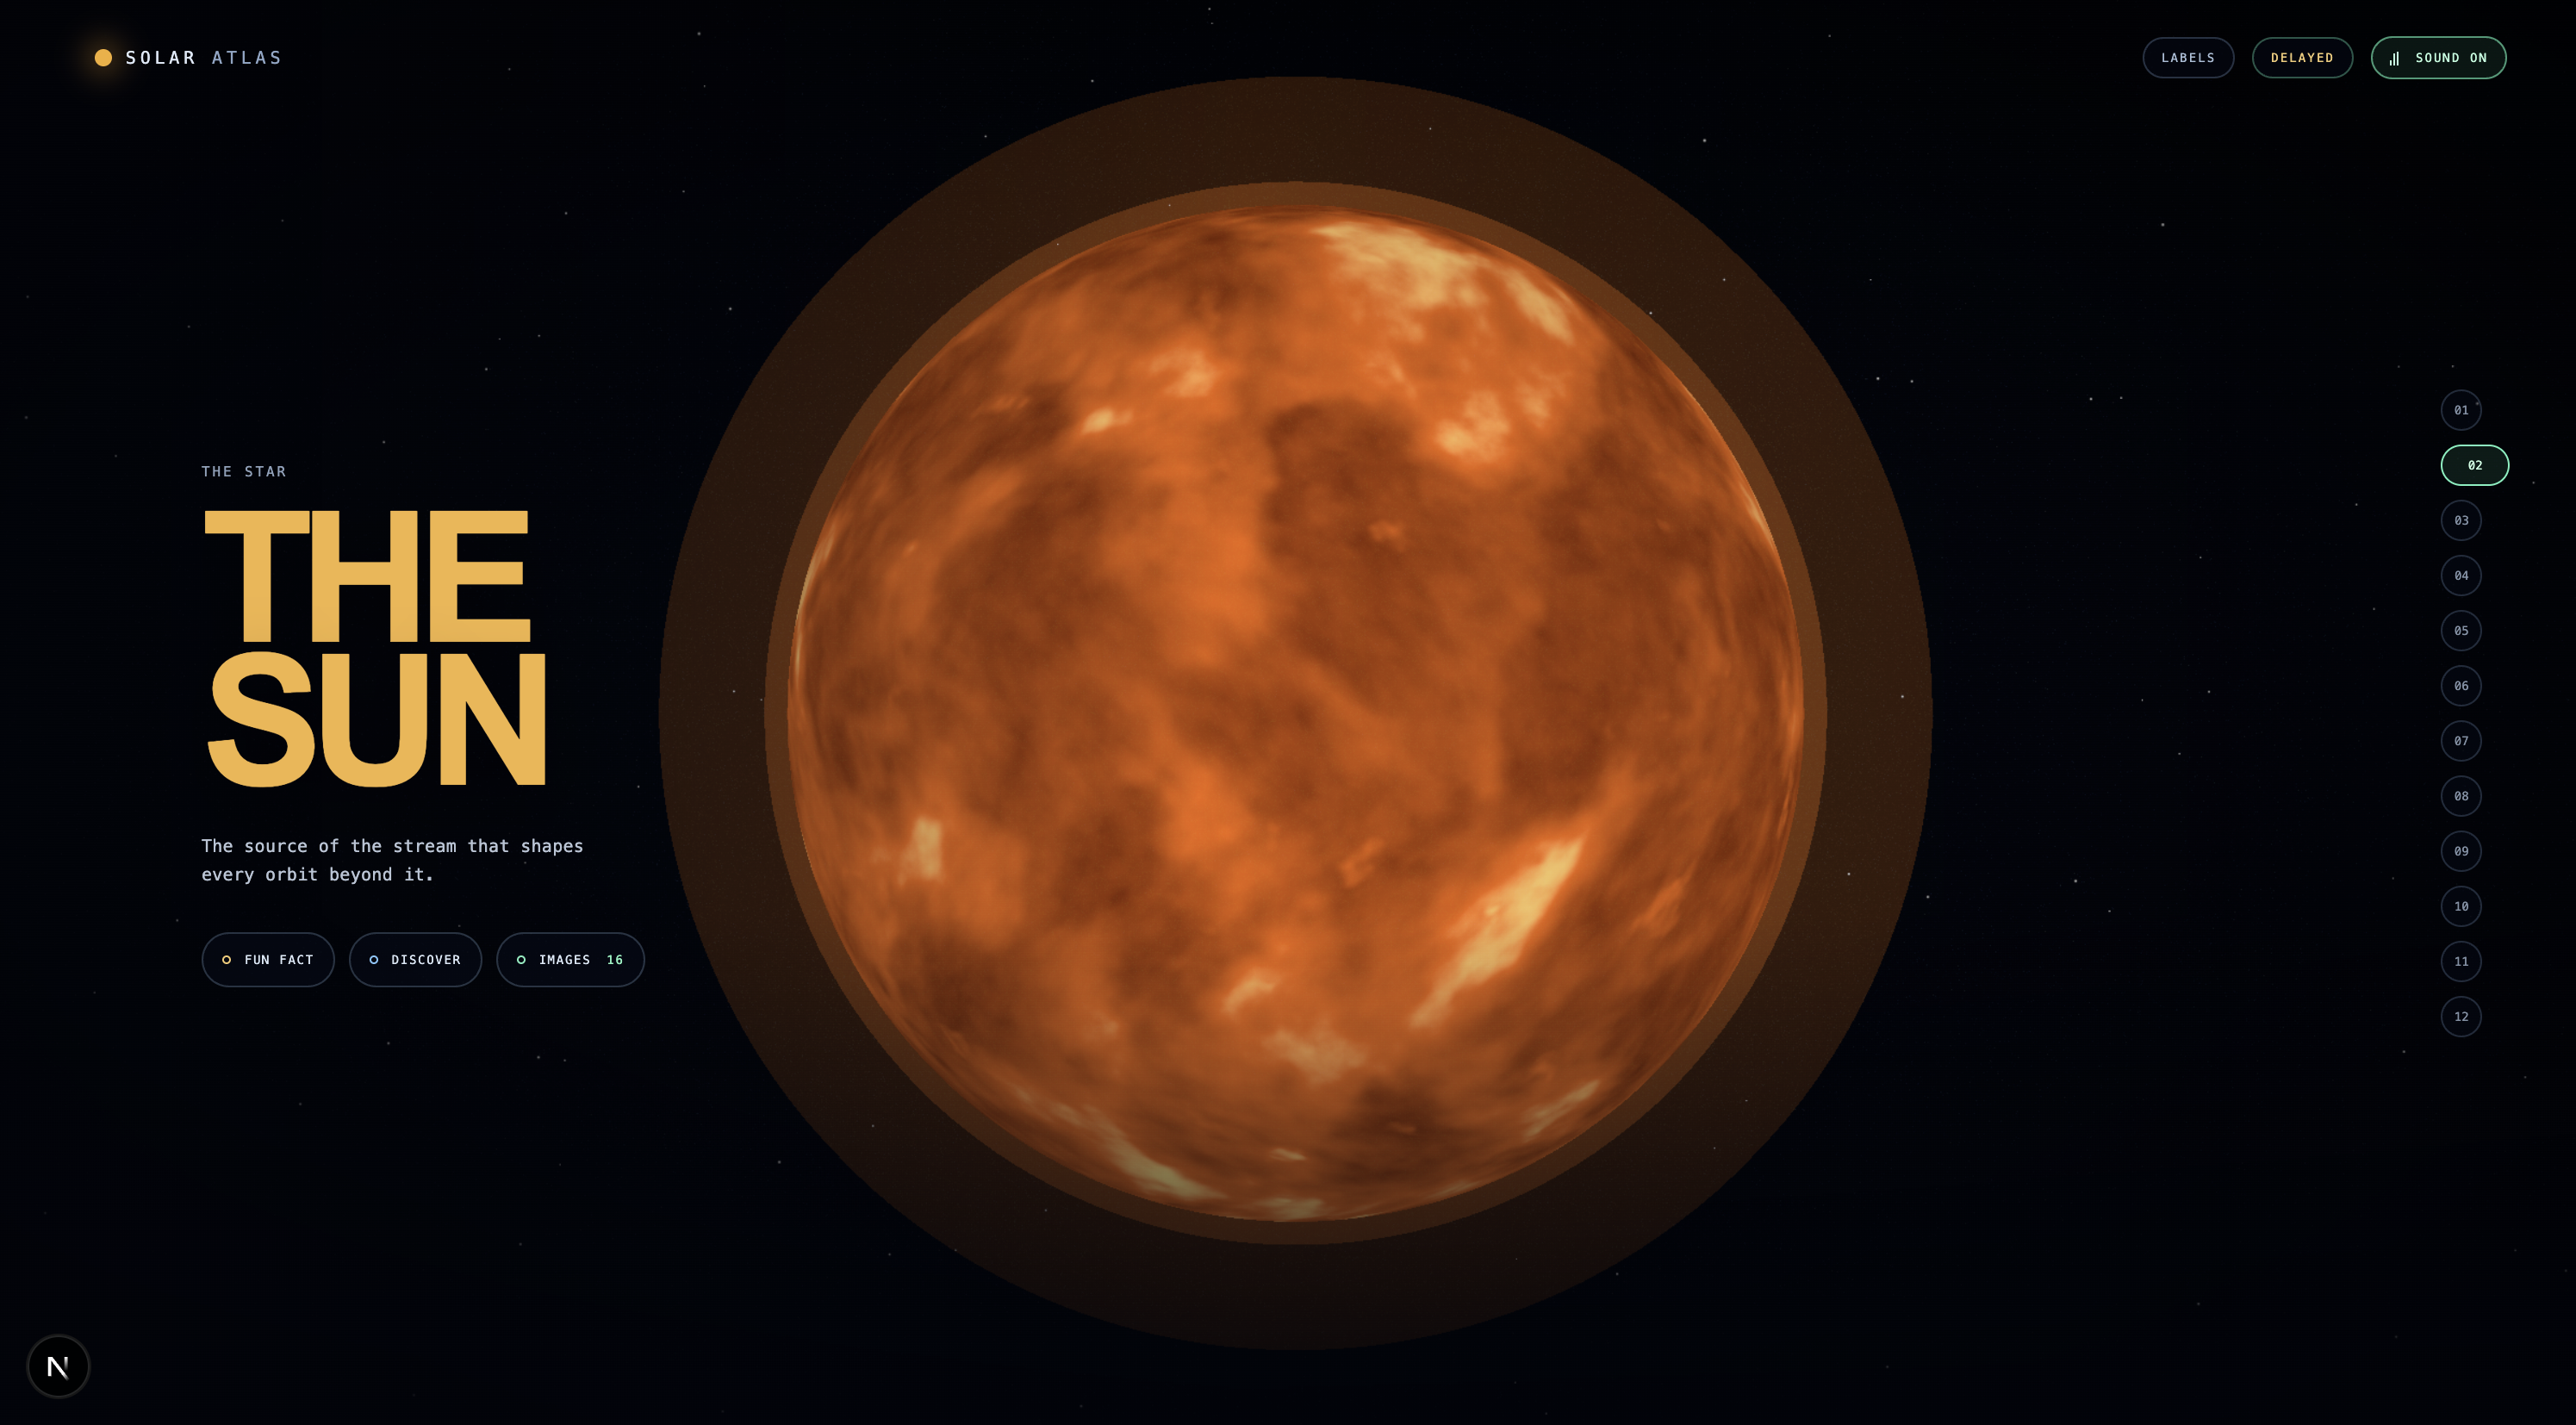
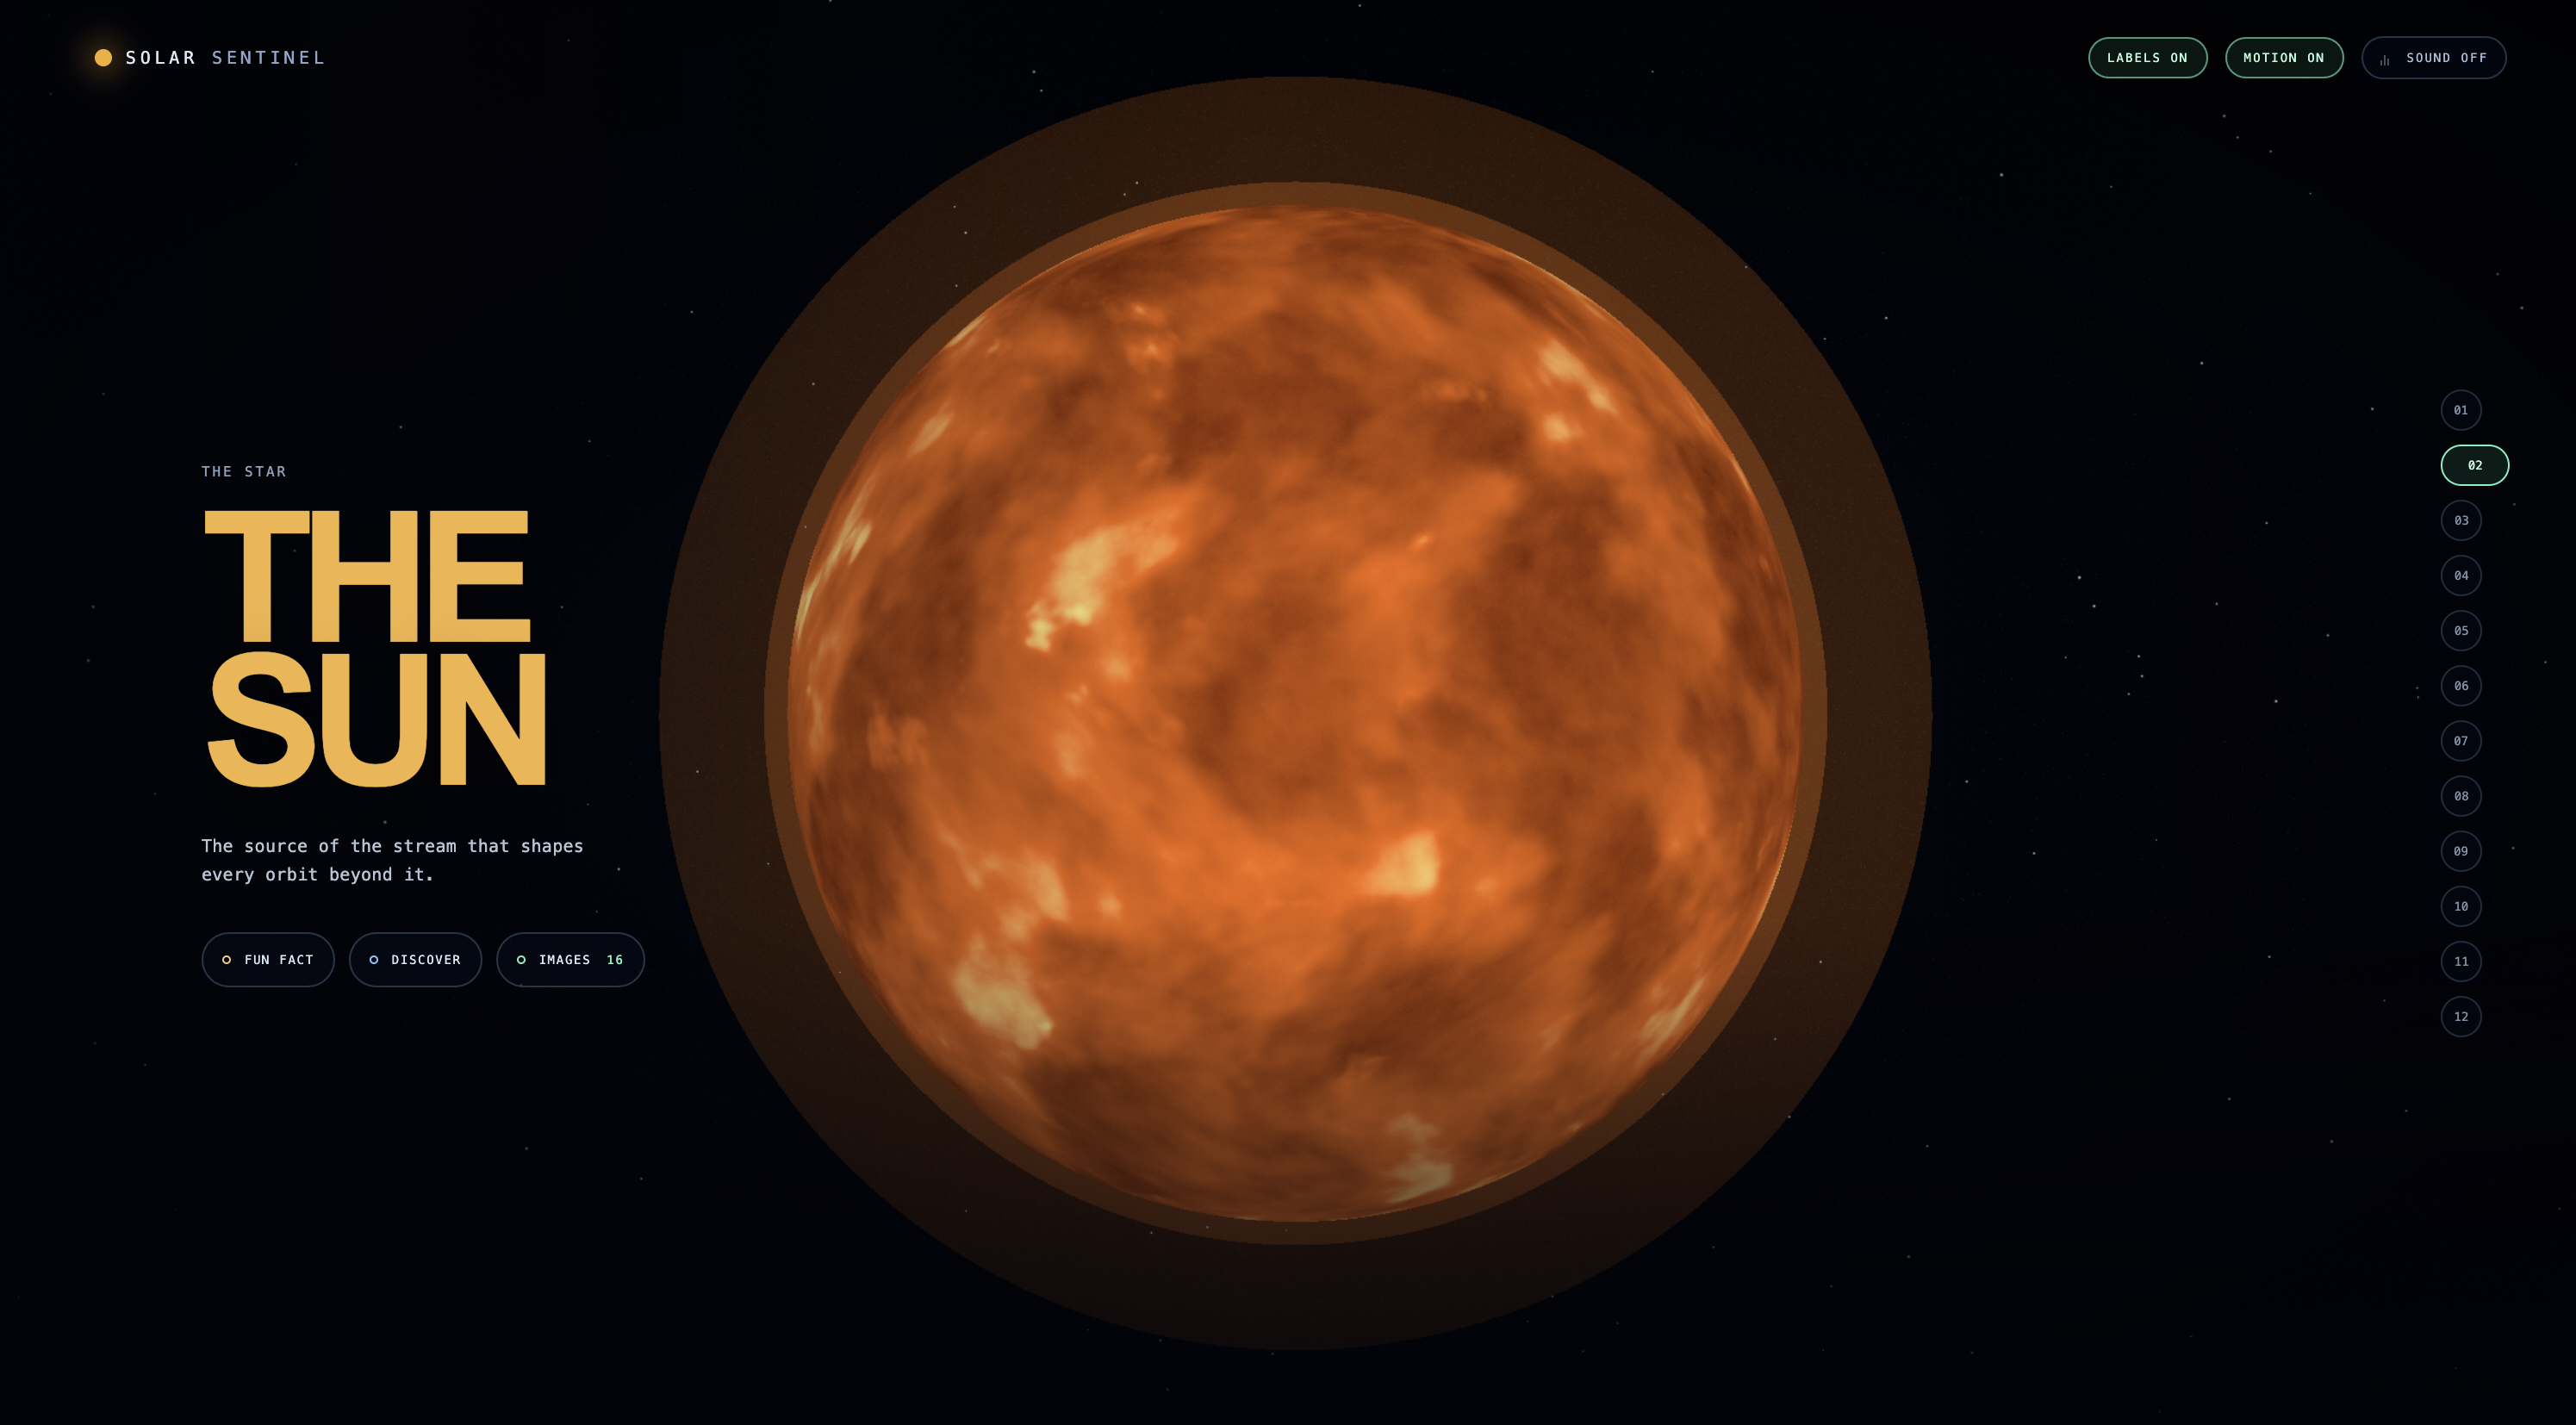
Solar Sentinel is an interactive Solar-System Atlas that takes visitors from a live-position system map through the Sun, planets, moons, and finally a dedicated SDO-to-Earth space-weather chapter.
Each world has a consistent, low-text interaction model:
- Fun Fact for quick learning
- Discover for mission and science context
- Images for a source-linked gallery
The experience combines NASA/JPL orbital data, NASA SDO solar imagery, NOAA space-weather signals, and curated references from agencies including ESA, JAXA, ISRO, UAE/MBRSC, and historical mission archives.
The final Earth chapter separates:
- Observed space-weather signals
- Official NOAA forecast context
- An educational “What If?” scenario
- Source and limitation information
How we built it
We built Solar Sentinel with Next.js, TypeScript, React, React Three Fiber, and Three.js.
The site uses a chapter-based, scroll-snapped 3D scene system with cinematic camera transitions, procedural atmosphere and glow effects, planet materials, lighting, orbital composition, source cards, and interactive galleries.
Live and source-backed data includes:
- NASA/JPL Horizons for planetary positions
- NASA SDO for solar imagery
- NOAA SWPC for current space-weather context
- Mission references and imagery records from multiple international agencies
Codex helped us iterate on the scene architecture, visual materials, source mapping, data-state design, automated tests, and project decision log. We made the final calls on scientific scope, visual direction, and responsible claims.
Challenges we ran into
The hardest challenge was balancing visual quality with scientific honesty.
Official imagery is not always a seamless, render-ready planetary texture. Some images are observations, some are maps, and some are mission composites. We learned to separate visual surface treatment from the scientific source record rather than imply every texture is a literal live observation.
Other challenges included:
- Representing enormous distances and sizes without making the system unreadable
- Maintaining a cinematic visual language without fabricating dramatic solar events
- Making source provenance visible without covering the experience in text
- Distinguishing observed data, official forecast, and educational scenarios
- Keeping real-time data understandable when feeds are delayed or unavailable
Accomplishments that we're proud of
We are proud that Solar Sentinel is becoming more than a 3D solar-system demo.
- A 12-chapter visual journey from the Solar System to Sun-to-Earth space weather
- A consistent educational interaction pattern across every destination
- Source-linked galleries and mission context instead of uncredited imagery
- Real NASA/JPL, NASA SDO, and NOAA-backed data layers
- A responsible Earth Signals experience that clearly separates reality from simulation
- A visual system designed to keep text quiet until someone asks for more
- Automated checks covering the Atlas content and data structures
What we learned
We learned that provenance is not a footnote—it is part of the product experience.
A good science interface does not just display data. It helps people understand what was observed, what is interpreted, what is forecast, and what remains uncertain.
We also learned that visual polish has to serve learning. The Sun can be dramatic, but it should not invent a flare. Earth can be beautiful, but a scenario must never be presented as a prediction.
What's next for Solar Sentinel: Global Solar-System Atlas
Next, we will turn the Atlas into an even stronger learning and exploration platform:
- Add a visible, source-grounded GPT explainer that distinguishes observed data, official forecasts, scenarios, and uncertainty
- Bring city-aware Earth context into the Atlas journey
- Add a clearly labelled historical replay of a real geomagnetic event
- Expand the international mission library responsibly, with provenance and usage review for every source
- Add more mission timelines, spacecraft stories, moon chapters, and multilingual learning paths
- Continue refining physically inspired shaders, atmosphere, solar wind, aurora, and cinematic transitions
Our goal is simple: make the Solar System feel alive, understandable, and visibly connected to the people and missions observing it.
Built With
- chatgp
- codex
- nextjs
