-
-
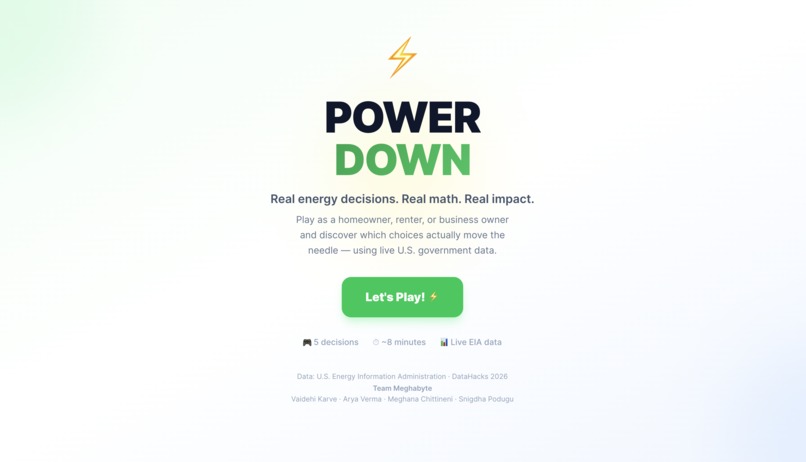
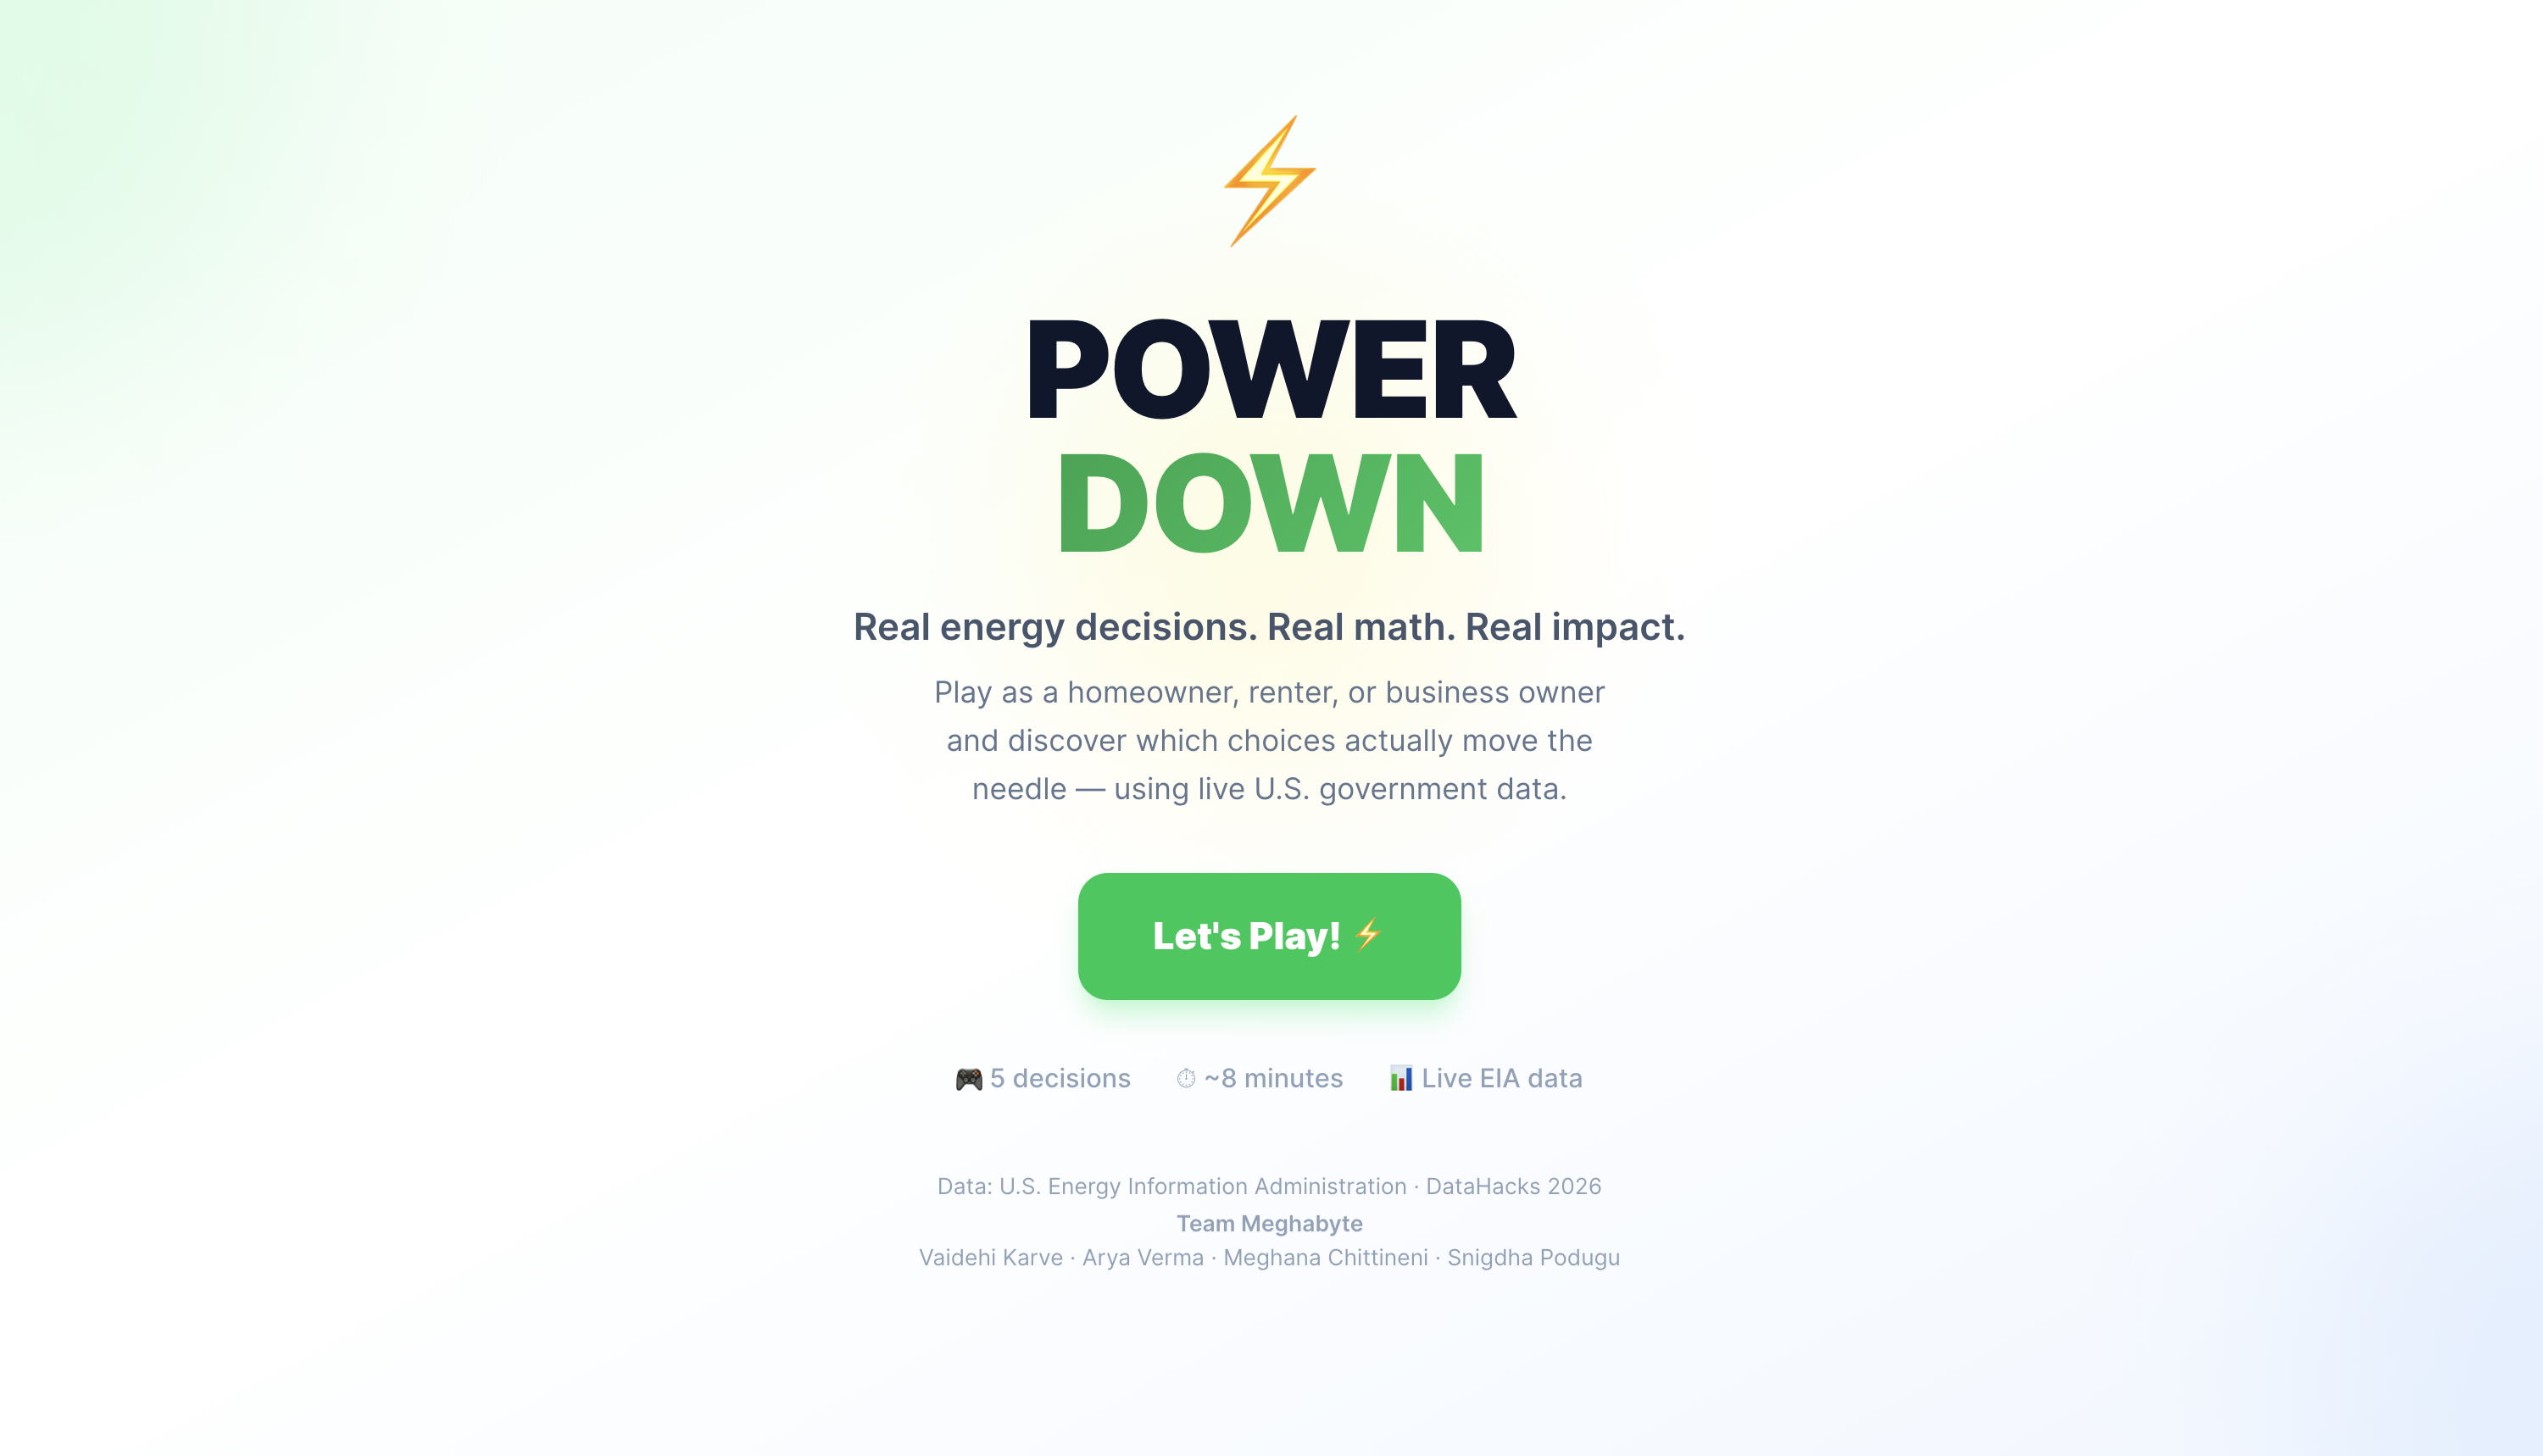
Landing page
-

Title page
-

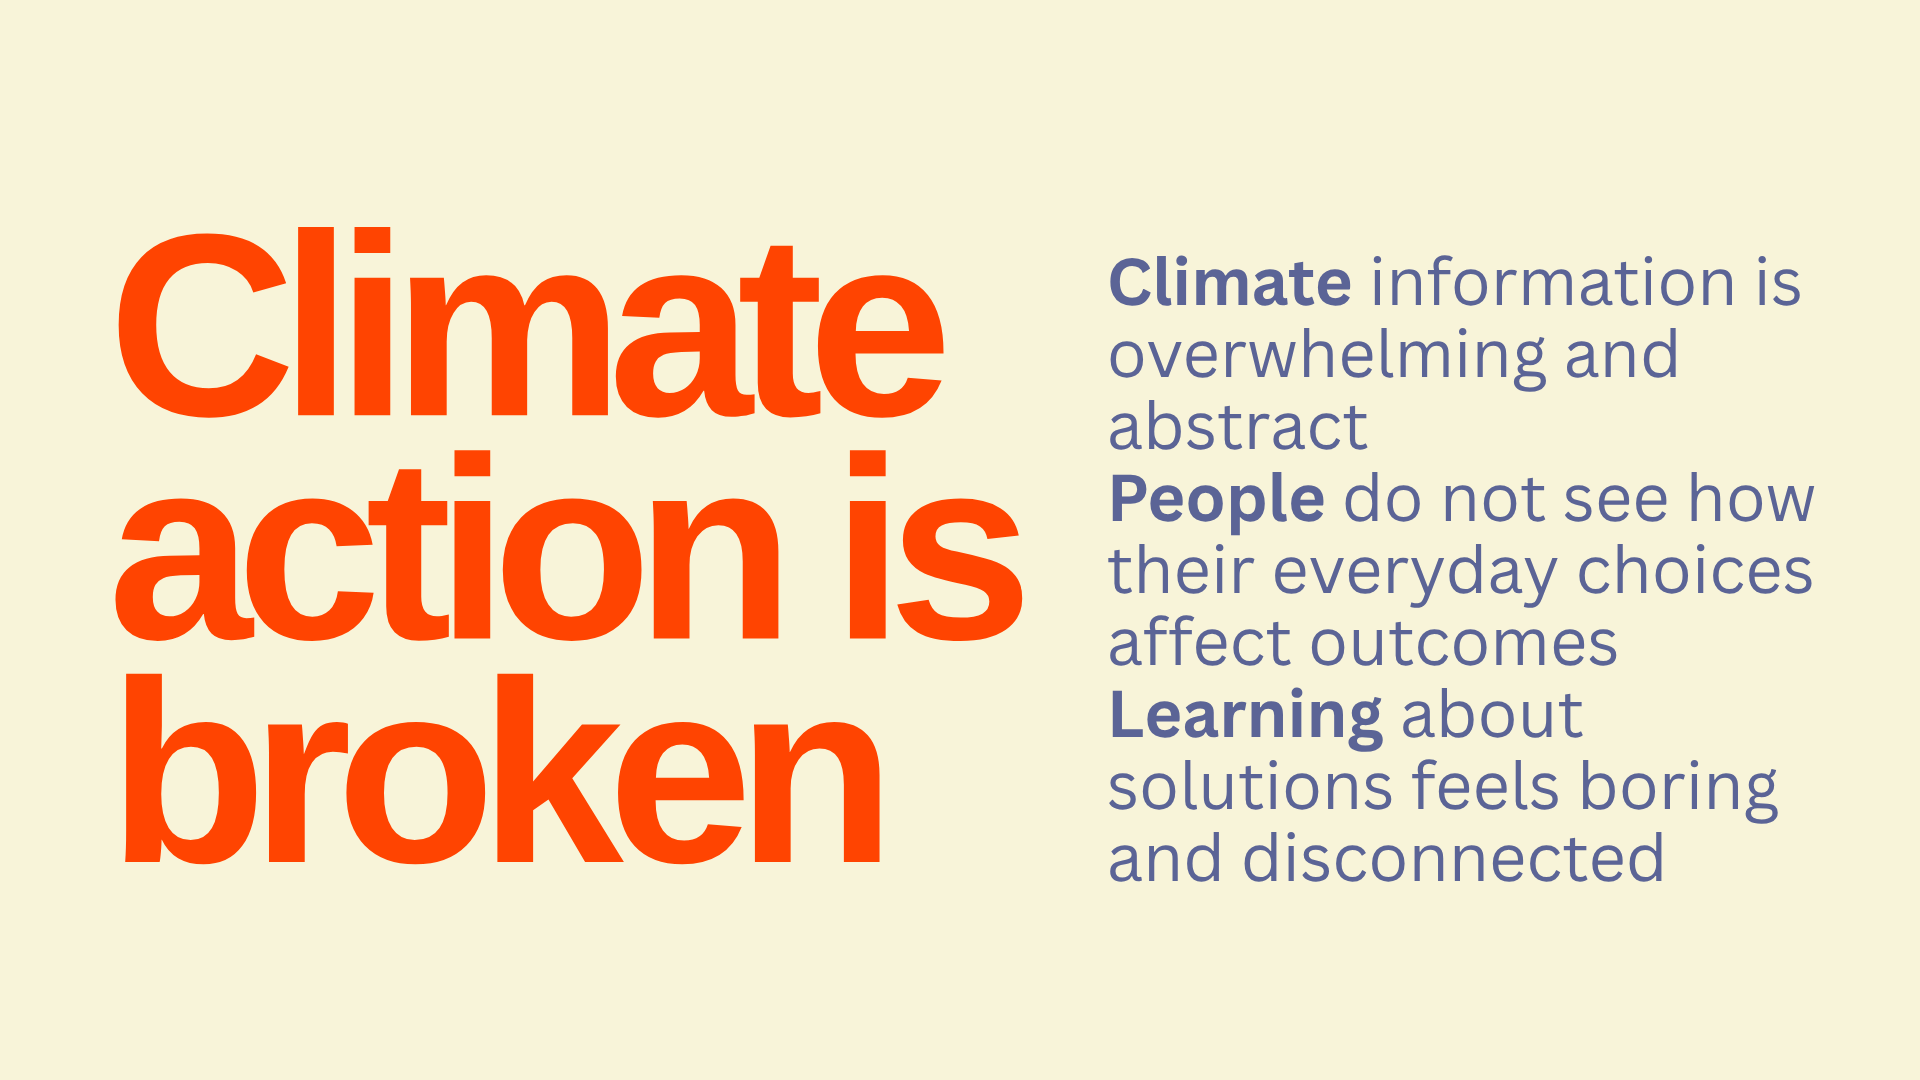
Problem slide 1
-
Problem slide 2
-
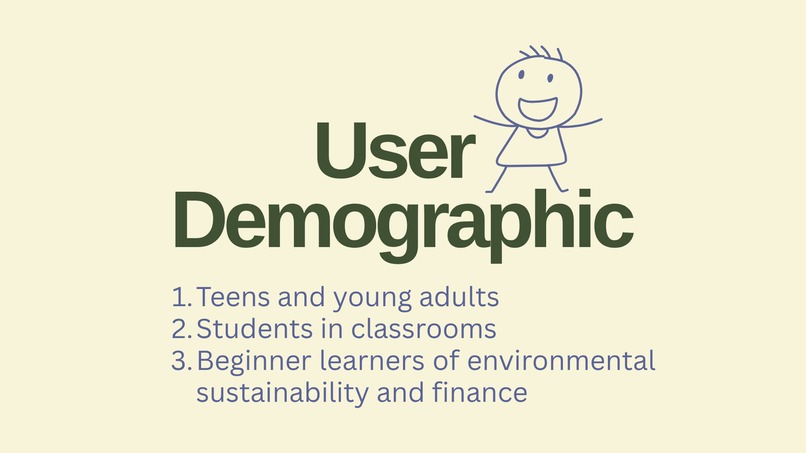
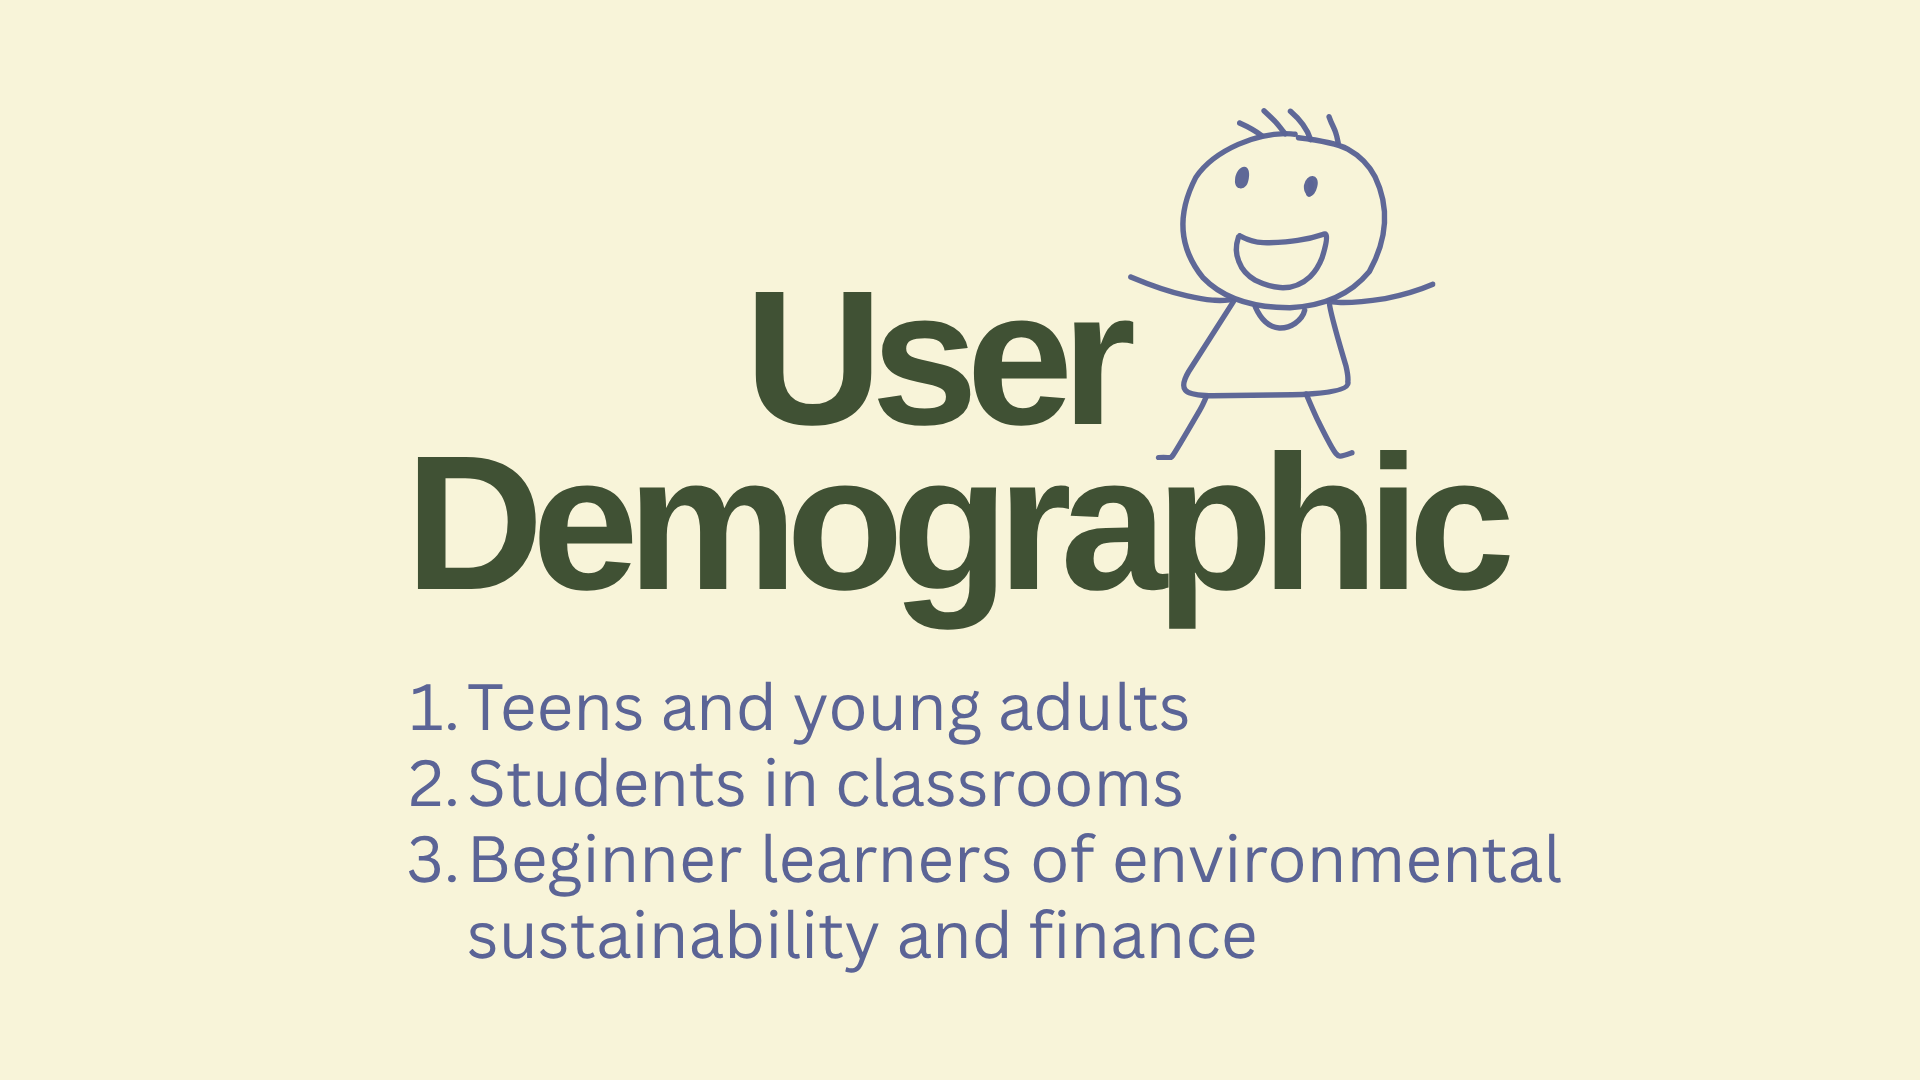
User demographic slide
-
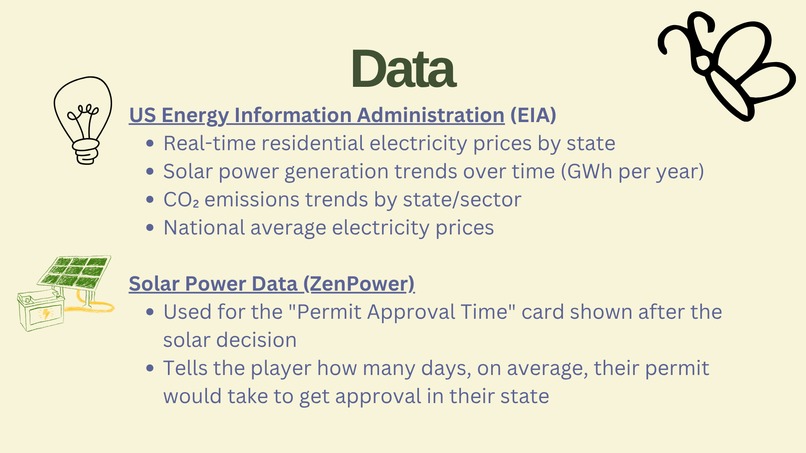
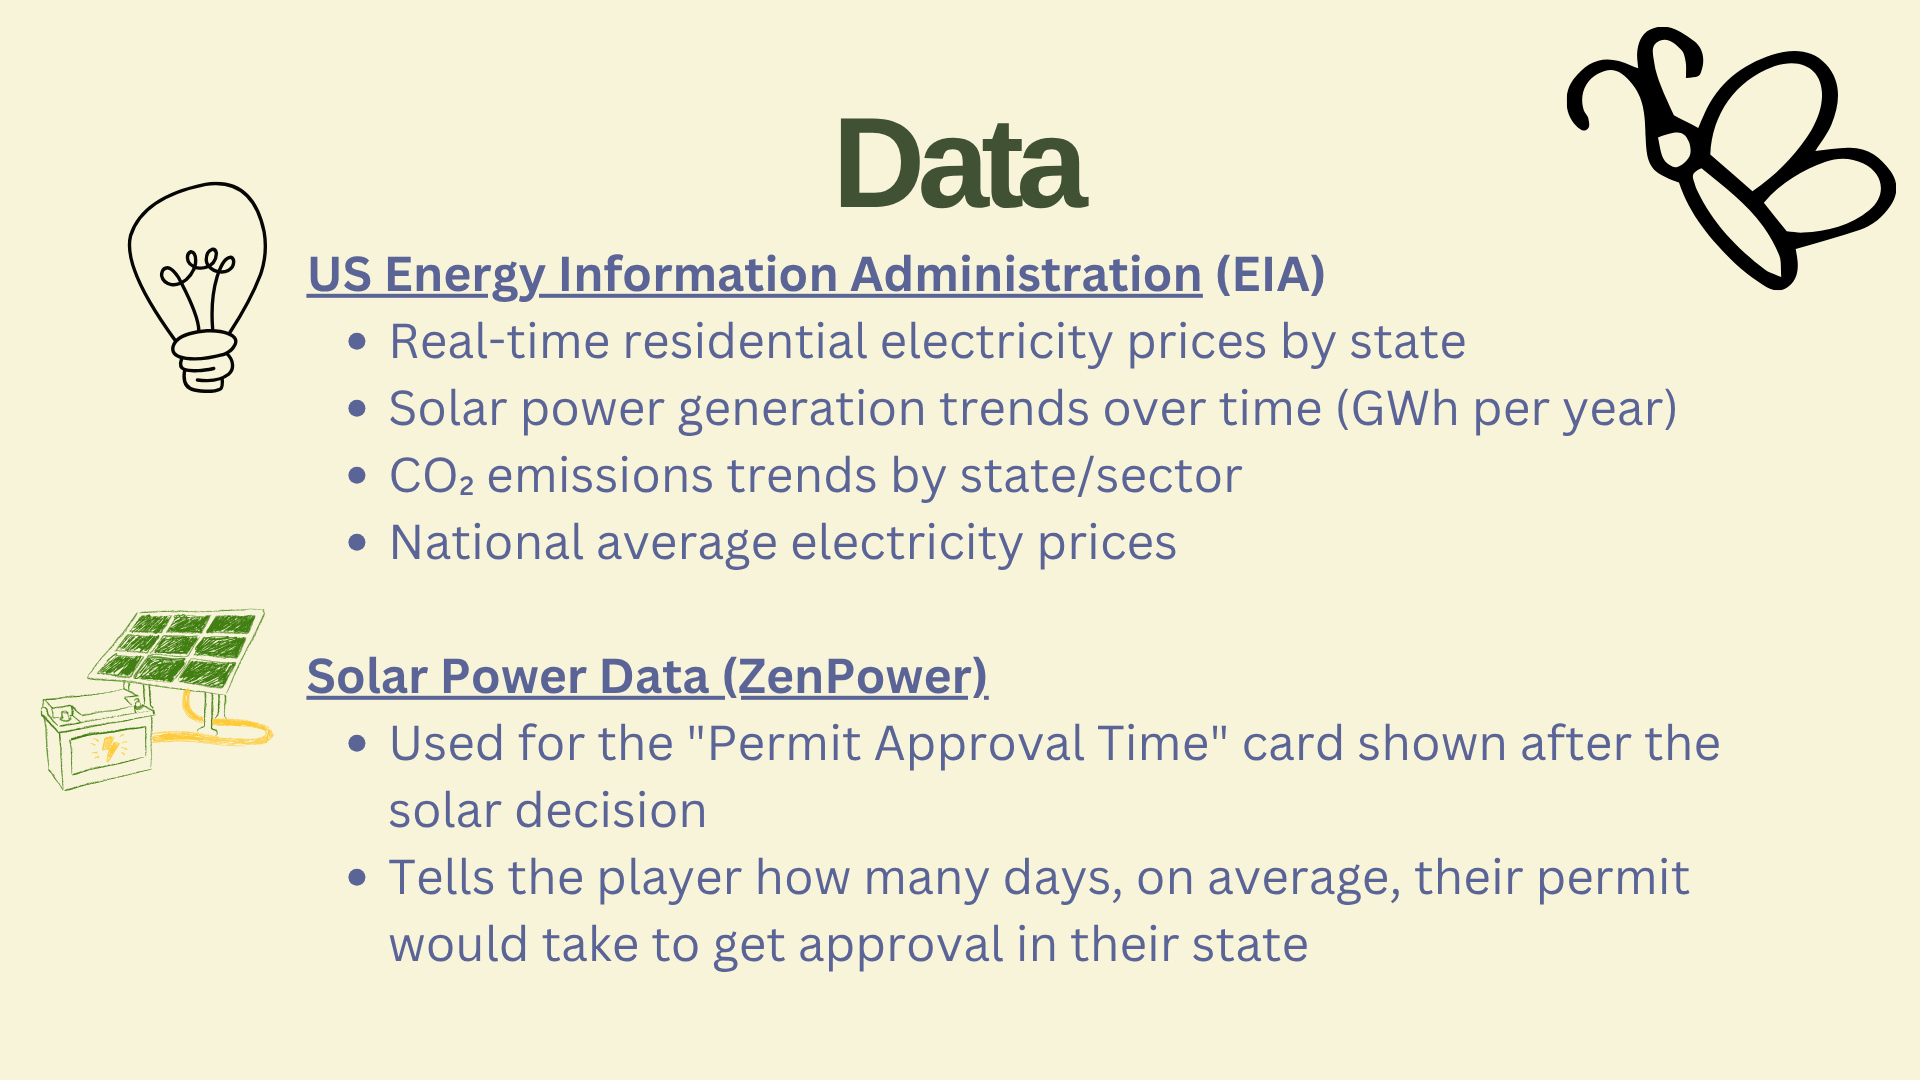
Data slide
-
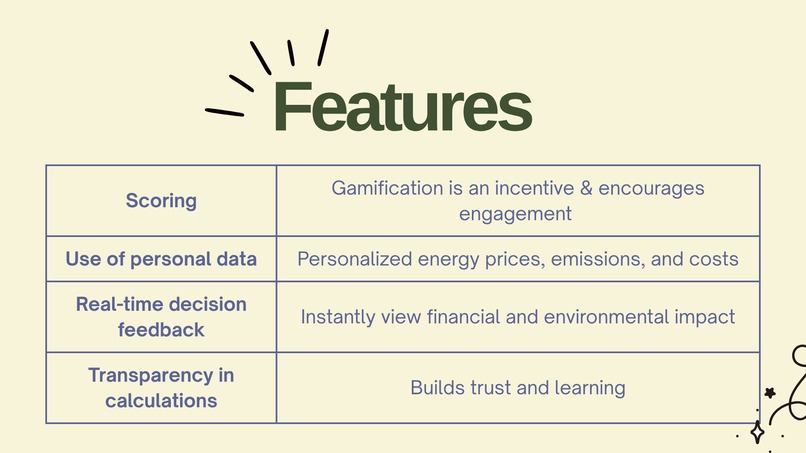
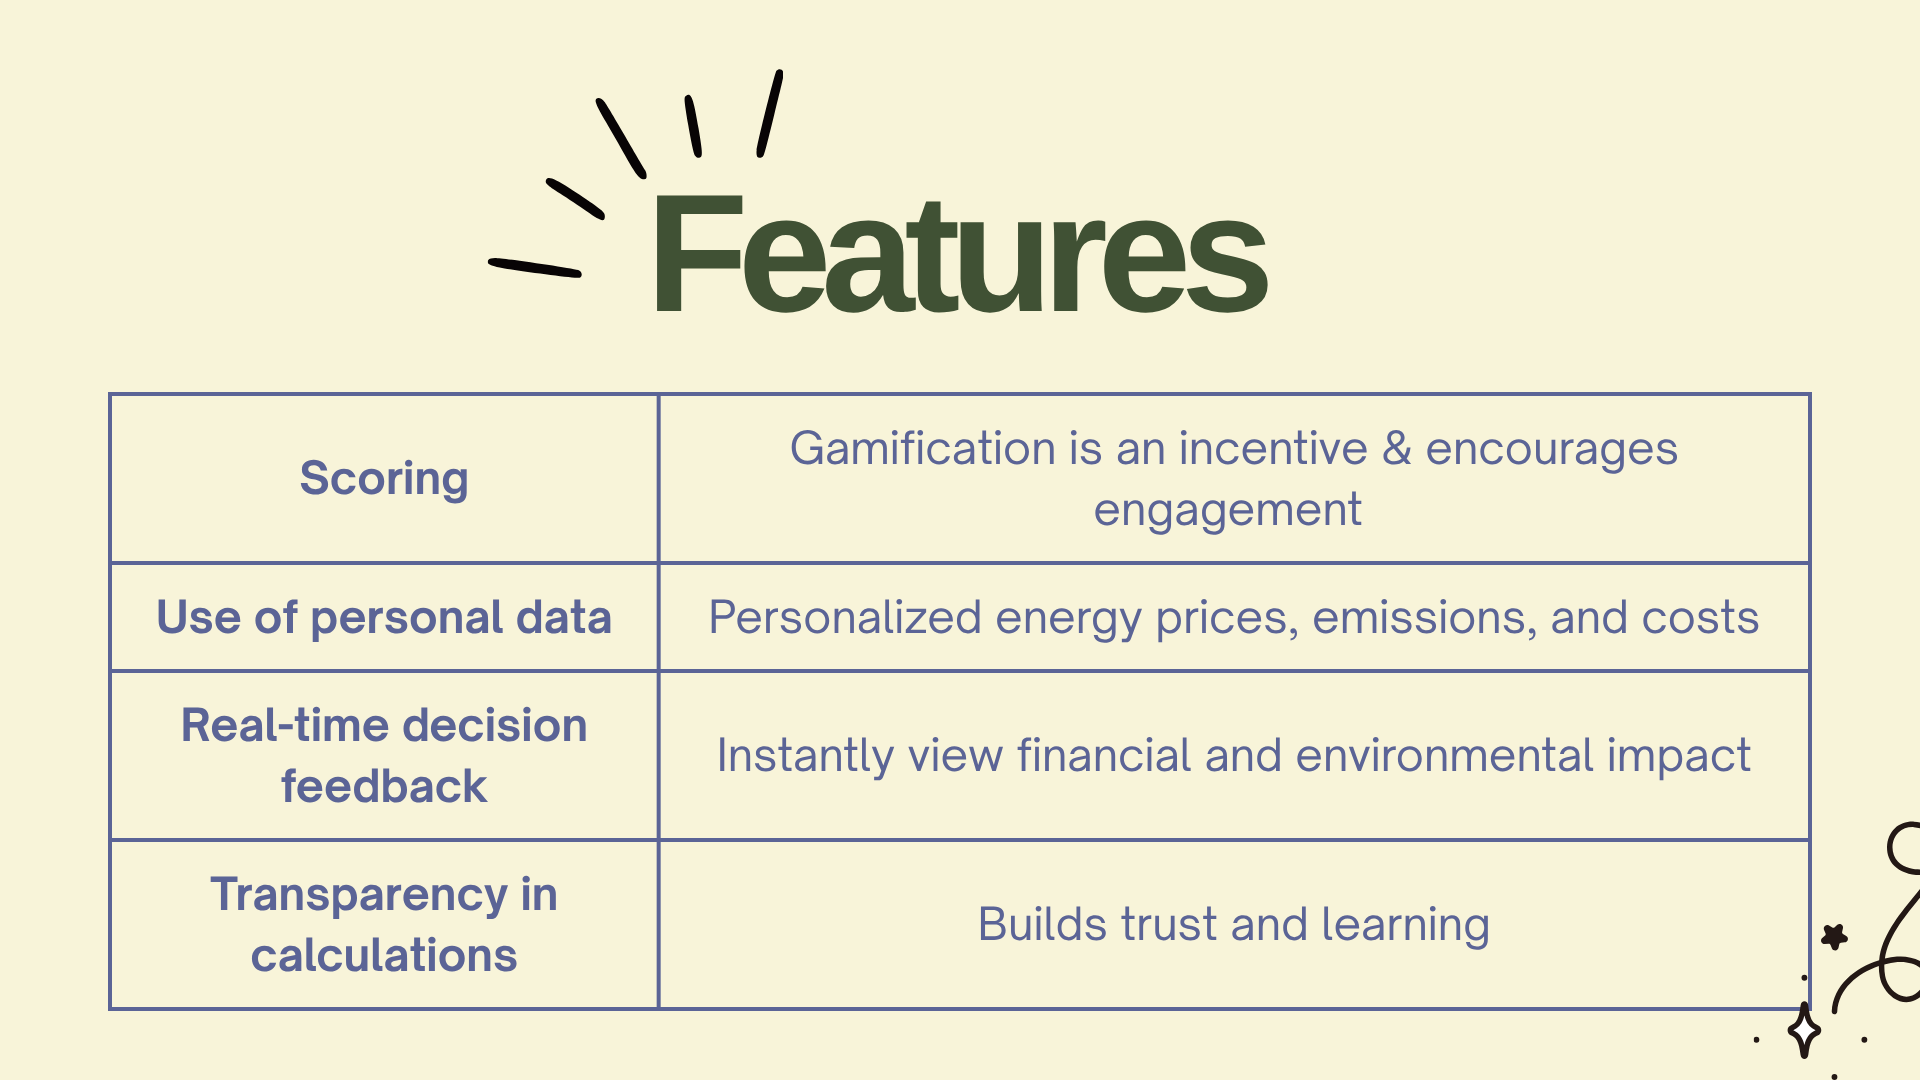
Features slide
-
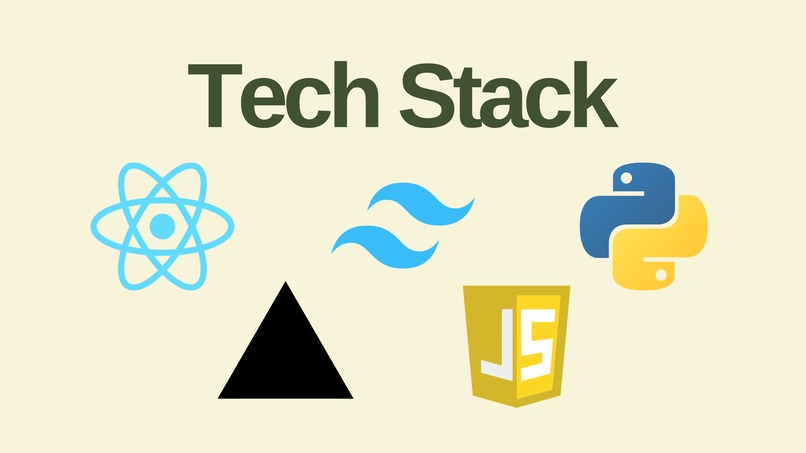
Tech stack slide
-
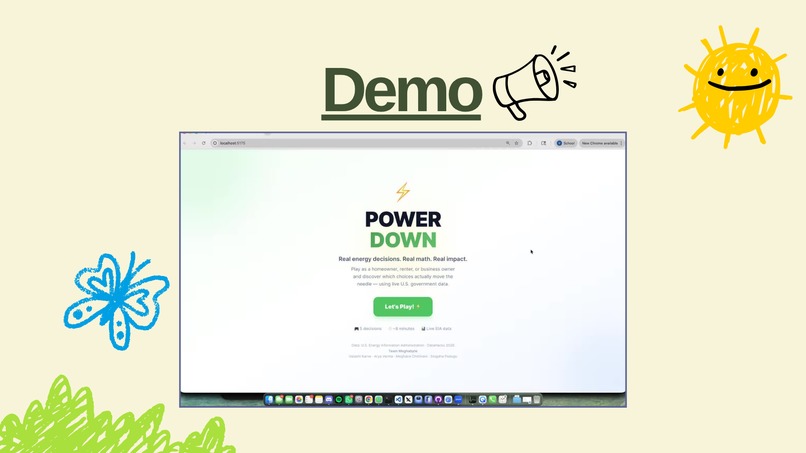
Demo slide
-

Thank you slide


Inspiration
Climate action often feels abstract and disconnected from everyday life. Teens and young adults rarely see how their energy decisions affect their wallets or carbon footprint in real, concrete terms. Existing tools influence your decisions without data clarity or outcome impacts. Moreover, there is no concrete clarity regarding solar power decisions, upfront cost, future opportunity cost or even bureaucratic barriers like permit approval lag. We wanted to build something that makes these results immediate, personal, and easy to understand, especially for teens and young adults who are rarely exposed to real financial or energy decision-making.
What it does
Power Down is an interactive simulation where users make decisions and instantly see the financial and environmental consequences. Users choose a persona (homeowner, renter, or small business owner), enter their ZIP code, and receive location-specific energy data. They then make decisions like adopting solar energy or adjusting consumption habits. Every financial and environmental outcome is calculated from real US government data. As users decide, an animated building updates in real time; solar panels appear on the roof, EVs pull into the driveway, and neighbouring houses light up with community solar. After the solar decision, a Permit Approval Time card powered by the ZenPower dataset shows the real average days between permit filing and approval in the user's chosen state, making bureaucratic friction visible. We also implemented a breakdown system that explains how each outcome was calculated using data and formulas. The app aims to tackle one of the most important questions when it comes to personal sustainability- how much does your impact really matter?
How we built it
Power Down is a React and Vite app deployed on Vercel, built around three layers. Data layer: The EIA Open Data API provides state-level electricity prices, solar generation capacity, and CO2 emissions factors fetched live at game start. The ZenPower solar permit dataset provides installation records and real permit approval timelines by state, with a national average fallback for states not in the dataset. Calculation layer: Every number is computed from real data. Monthly bills use actual state electricity prices times persona-specific consumption. CO2 avoided uses EIA state emissions factors. Five-year savings incorporate real state gas prices from the EIA petroleum API. Permit approval times come directly from the ZenPower comparison dataset. Experience layer: The building is a layered SVG where each decision triggers a construction animation before the new element appears. A personalized "Did You Know?" card appears after each choice, giving a small fact related to the decision made. A full methodology page exposes every formula and data source so users can verify what they're seeing.
Challenges we ran into
One of the biggest challenges was making data usable in an interactive simulation. Government datasets are not designed for real-time user interaction, so we had to structure and simplify them without losing accuracy, which meant carefully connecting EIA prices, ZenPower permit records, and CO2 factors into coherent calculations. Another challenge was designing a system where decisions feel both realistic and immediate. Modeling long-term impacts like cost savings, emissions reduction, and payback periods required balancing realism with user experience. We also faced difficulty designing the visualization system so that every decision changes the environment without overwhelming the user. Anticipating load inconsistencies with EIA API, we built a full fallback system that continues the game with clearly labelled national average estimates if any call fails. The ZenPower integration required transparent handling of incomplete state coverage so users always see a badge indicating whether they're seeing state-specific or national average data.
Accomplishments that we're proud of
We are proud of building a fully interactive simulation that connects data to user decision-making in real time. A major accomplishment was creating a system where financial and environmental impacts are not only calculated accurately but also visualized instantly through changes in the user’s environment. We are also proud of the transparency feature that lets users see how outcomes are calculated, helping build trust and making the learning process more meaningful. Every number in Power Down is traceable to a real source. When the app tells a user in Texas their solar installation saves $1,200 per year, that uses Texas's actual EIA rate. When it tells a Florida user their permit takes 13.89 days on average, that comes directly from ZenPower.
What we learned
We learned how important it is to translate complex data into something intuitive and engaging. Data becomes understandable when users can interact with it directly rather than just read about it. We also learned how combining financial literacy with climate education makes sustainability much more relevant to everyday decisions. When users see a specific dollar amount saved, a specific CO2 impact, and a specific permit wait time all at once, the decision becomes visible in a way that abstract climate doesn’t. Finally, we learned how impactful transparency is in simulation systems, as showing users why something happens increases trust and understanding.
What's next for Power Down
Next, we plan to expand the number of personas and decision scenarios to make the simulation even more realistic and diverse. We also want to improve the precision of our modeling by incorporating more detailed energy consumption data and expanding geographic coverage beyond ZIP-based averages. In the future, we aim to bring Power Down into classroom environments as an educational tool and potentially gamify it further with challenges, scoring systems, and collaborative scenarios.
Built With
- javascript
- python
- react
- tailwind


Log in or sign up for Devpost to join the conversation.