Inspiration
We were inspired by the lack of intuitive tools to understand blockchain activity in real time. While platforms like explorers exist, they are often too technical and static. We wanted to build something that makes wallet behavior, risk, and transaction relationships visually and intelligently understandable.
At the same time, we saw an opportunity to combine on-chain data (Solana) with off-chain analytics (Snowflake) and AI insights, creating a powerful full-stack data intelligence platform.
Problem Statement

The explorer does not give instinctive overview of a wallet activity but plain texts.
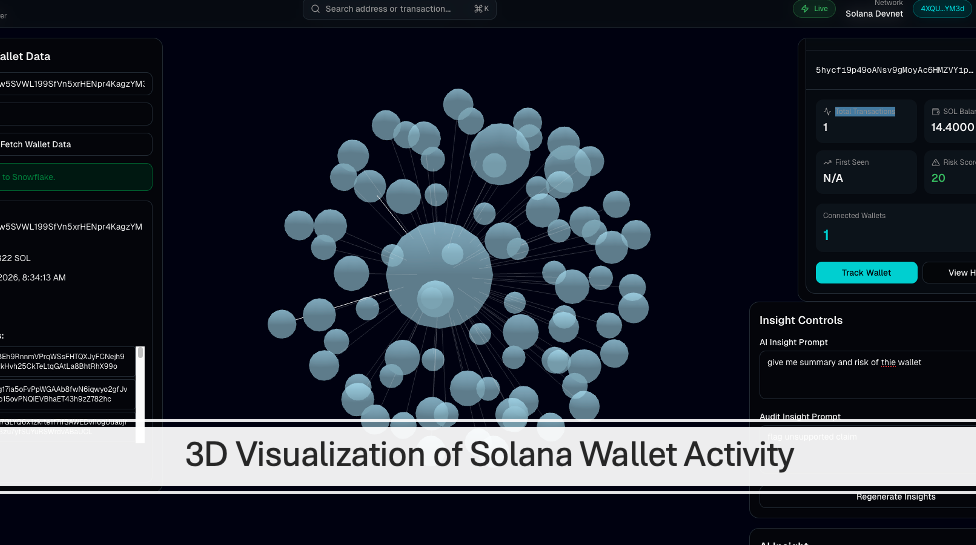
Node Metrics & Visualization

This view highlights node-level metrics, including operational data and performance tracking. It enables users to monitor system behavior and make data-driven decisions.
What it does
SolaNode is an AI-powered blockchain analytics platform that:
Visualizes wallet relationships in an interactive 3D graph (WebGL) Tracks wallet behavior, balances, and transaction flows Generates AI-powered insights (risk scores, suspicious patterns, whale activity) Stores and analyzes historical data using Snowflake Saves AI insights into MongoDB for audit and tracking Enables users to explore blockchain activity like a live data network
Think of it as a “Google Maps for blockchain intelligence”.
How we built it
Frontend: Next.js + React + WebGL (Force Graph 3D) Blockchain Data: Pulled from Solana devnet APIs Backend: FastAPI + Node.js API routes Database: Snowflake for structured analytics MongoDB for AI insight storage AI Layer: DigitalOcean Gradient AI for generating insights Voice (optional extension): ElevenLabs for audio explanations of wallet activity
We also implemented:
Wallet graph generation (nodes = wallets, edges = transactions) Dynamic node sizing based on wallet balance Real-time API pipeline from Solana → Snowflake → AI → frontend
MLH Track - Best Use of Solana
We deeply integrated Solana by:
Fetching live wallet data, balances, and transaction signatures Mapping wallet-to-wallet interactions into a graph structure Visualizing on-chain activity in real time Enabling exploration of transaction relationships beyond traditional explorers
This transforms Solana data from raw logs into interactive intelligence.
MLH Track - Best Use of Snowflake
We used Snowflake as our analytics backbone:
Ingested and stored wallet metrics and transaction history using the Snowflake SQL API Queried structured blockchain data using Snowflake SQL for downstream processing Enabled scalable, high-performance analytics across large datasets Integrated Snowflake Cortex AI to generate intelligent insights from blockchain activity
Snowflake allowed us to bridge real-time blockchain data with enterprise-grade analytics and AI, transforming raw transaction data into actionable insights.
MLH Track - Best Use of ElevenLabs
Using ElevenLabs, we explored:
Converting AI-generated wallet insights into natural voice explanations Allowing users to listen to blockchain analysis instead of reading it Making complex data more accessible and engaging
MLH Track – Best Use of DigitalOcean
We leveraged DigitalOcean to power our AI-driven audit insight pipeline:
Hosted our backend microservices that process wallet activity data Integrated with Snowflake Cortex AI to analyze structured blockchain data Generated real-time audit insights on wallet transaction nodes Served AI results through scalable APIs for visualization and interaction
DigitalOcean enabled us to run lightweight, scalable inference services that bridge on-chain data (Solana) with off-chain analytics (Snowflake), creating a modular and responsive AI architecture.
Challenges we ran into
Handling real-time blockchain data efficiently Designing a graph visualization that scales with many nodes Debugging Snowflake integration (query errors, schema mismatches) Managing multiple services (Next.js + FastAPI + AI + DB) Structuring AI outputs to be both useful and interpretable
Accomplishments that we're proud of
Built a full end-to-end data pipeline (Solana → Snowflake → AI → UI) Created an interactive 3D blockchain visualization tool Integrated multiple modern stacks (Web3 + AI + data cloud) Designed a system that can scale into a real-world analytics platform
What we learned
How to combine on-chain and off-chain data systems Practical challenges of real-time data pipelines How to build AI-driven insights on top of raw data Importance of visualization in understanding complex systems Managing full-stack architecture across multiple technologies
What's next for SolaNode
Add fraud detection and anomaly scoring models Expand to multi-chain support (Ethereum, Cosmos, etc.) Improve graph performance with large-scale datasets Add user dashboards and alerts for suspicious activity Integrate voice assistants and natural language querying Deploy as a production-ready SaaS analytics platform
Built With
- cortex-ai
- digitalocean
- mongodb
- next.js
- python
- snowflake
- solana
- typescript

Log in or sign up for Devpost to join the conversation.