Inspiration
We were browsing on the various Government Open Data available and thought why not to mash up different KPIs to see whether they actually co-relate as per what we have been hearing and have learnt till date..! Hence, as a part of ChallengePost Summer Jam Open Data Mash up, we came up with insights and dashboards to analyse State performance over various KPIs.
How it works
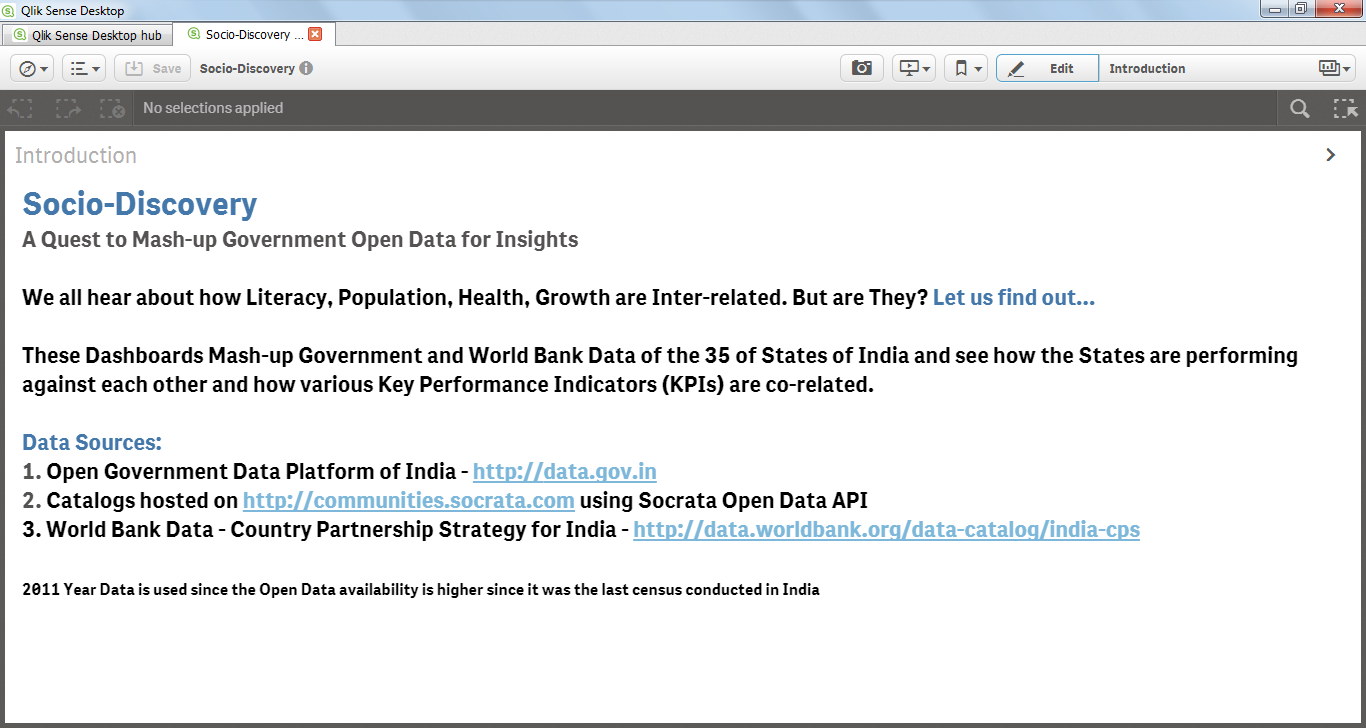
Socio Discovery Dashboards Mash-up Government and World Bank Data of the 35 of States of India and see how the States are performing against each other and how various Key Performance Indicators (KPIs) are co-related.
Below Key Indicators are analysed:
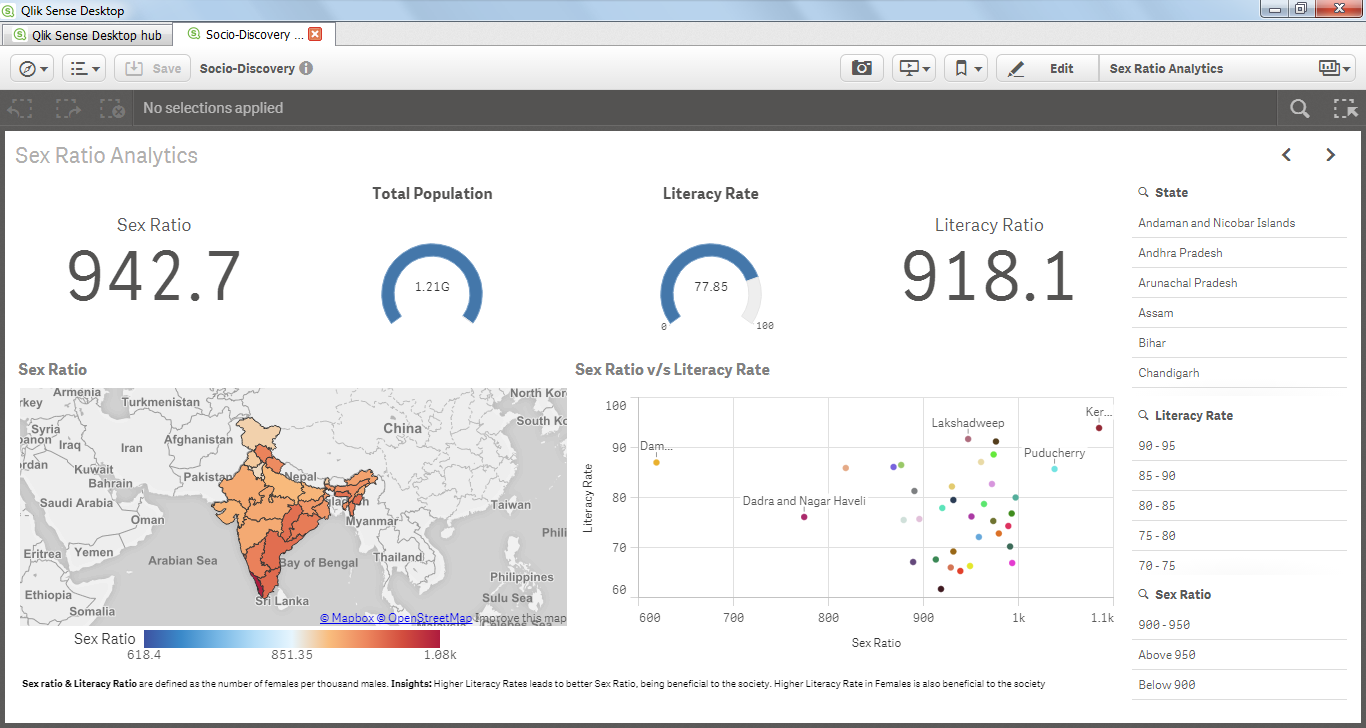
- Sex Ratio
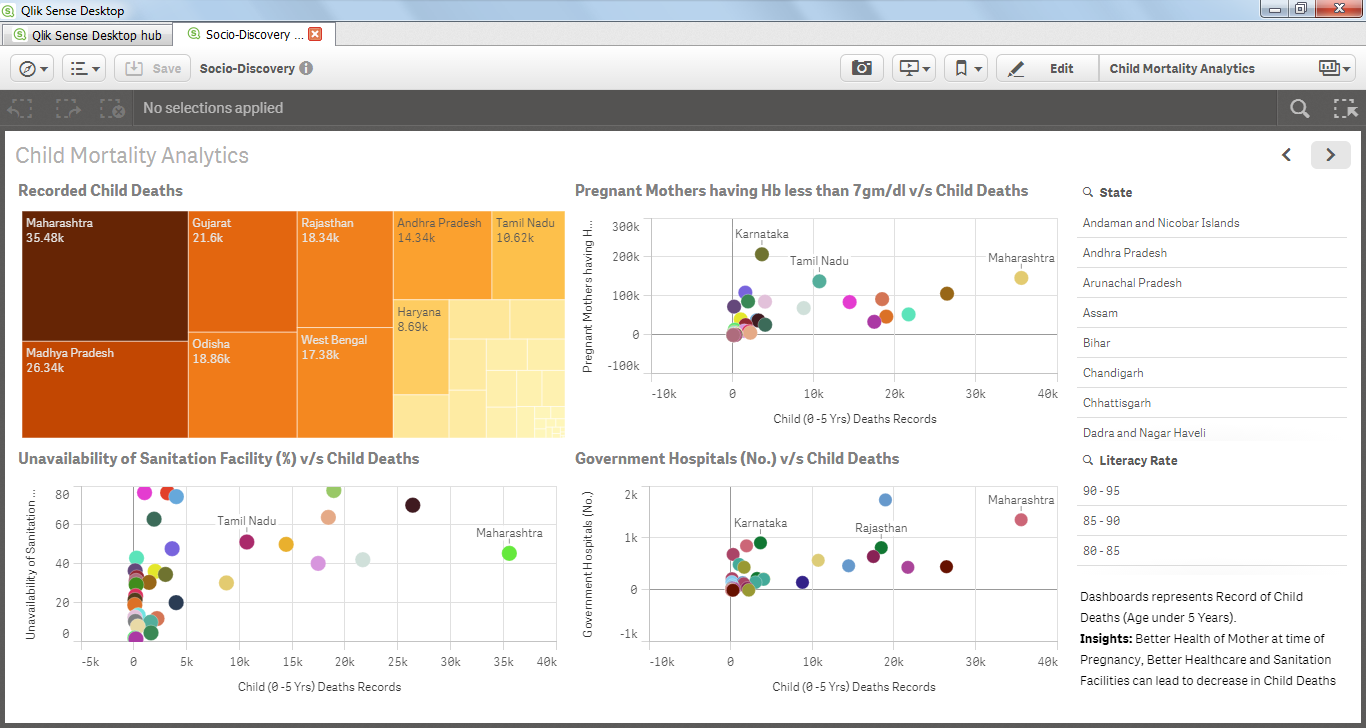
- Child Mortality
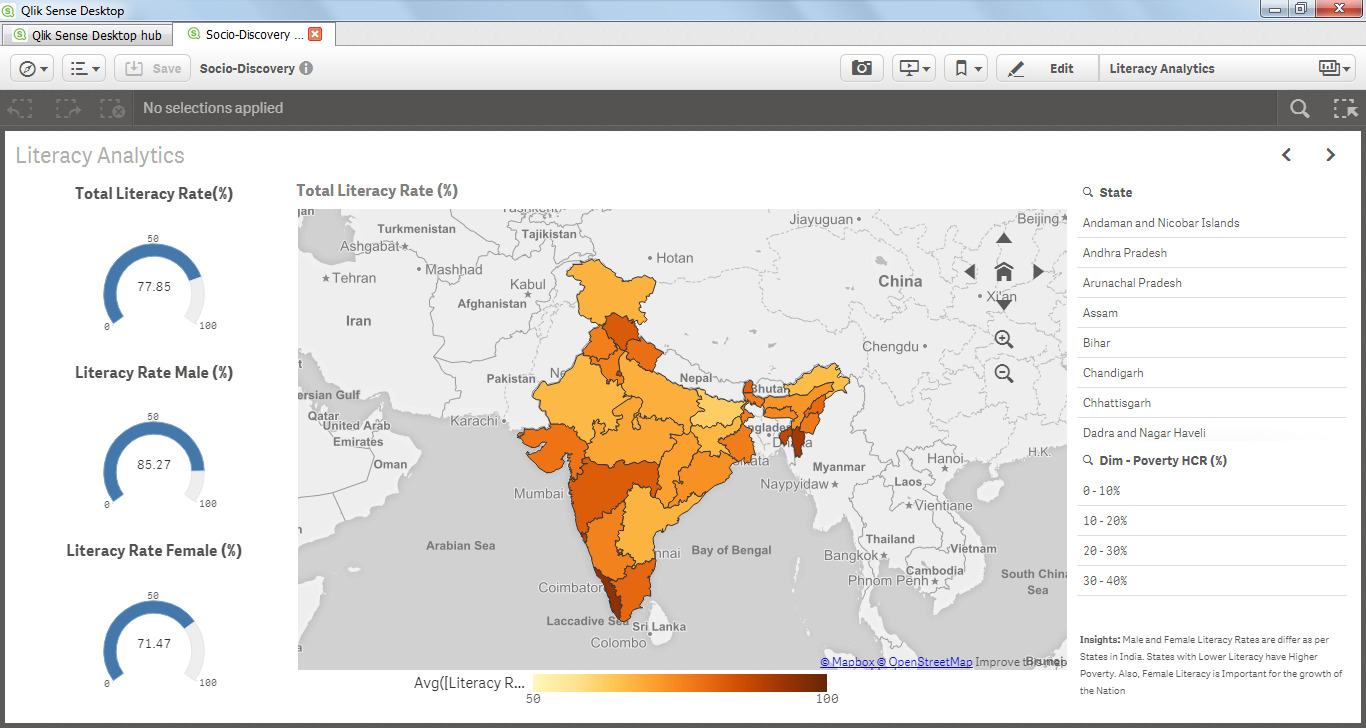
- Literacy
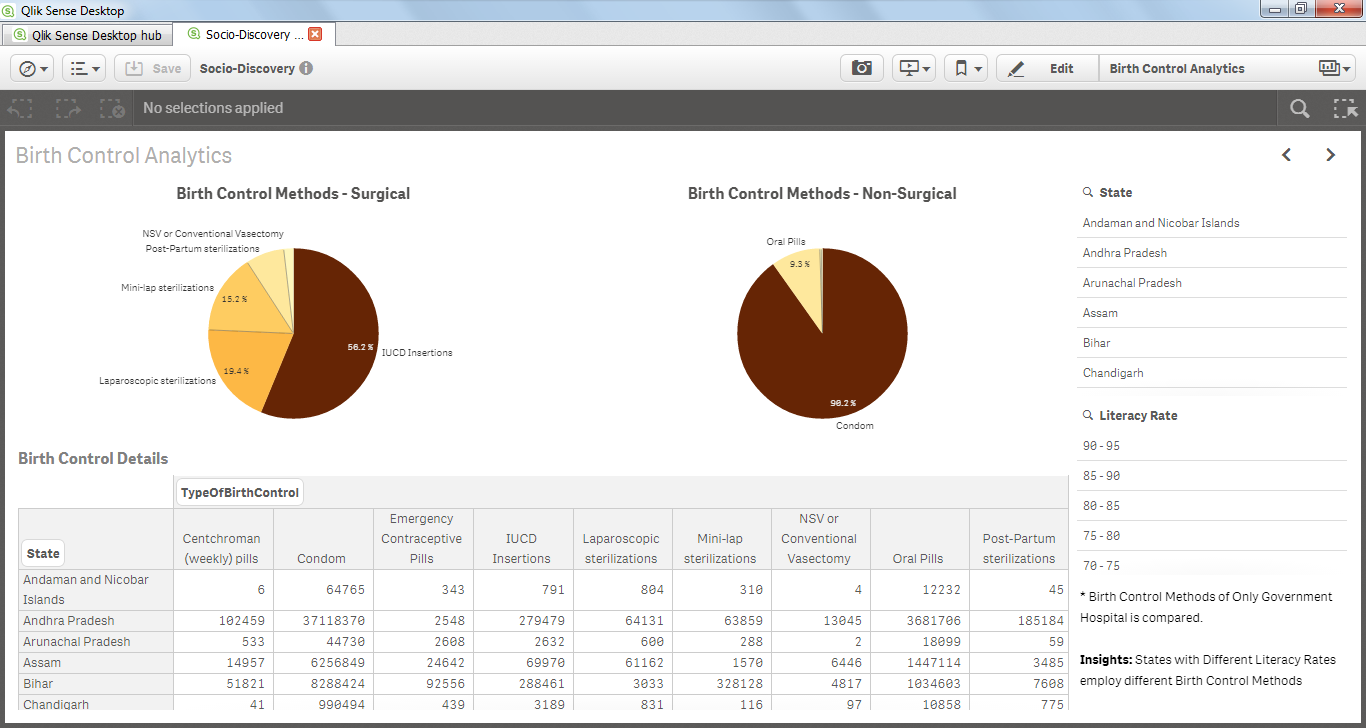
- Birth Control Methods
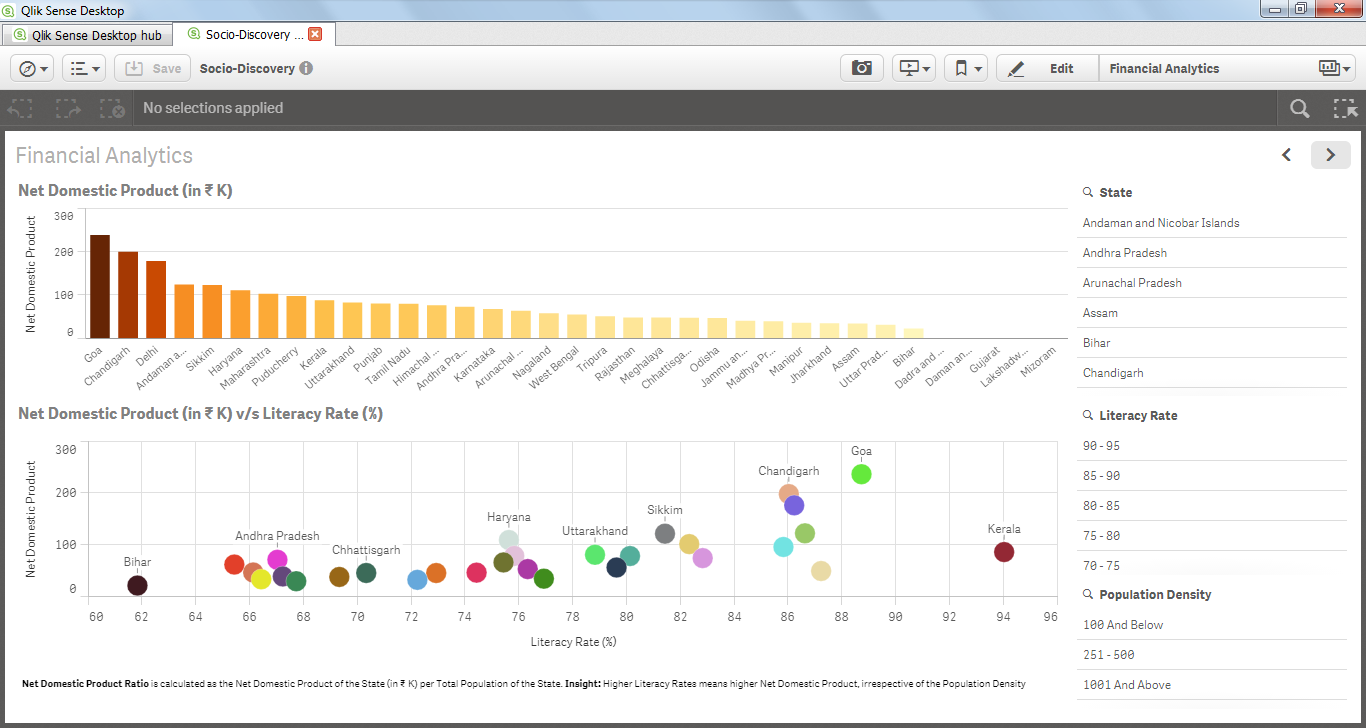
- Financial Analytics
Below Open Data Sources were used:
- Open Government Data Platform of India - http://data.gov.in
- Catalogs hosted on http://communities.socrata.com using Socrata Open Data API
- World Bank Data - Country Partnership Strategy for India - http://data.worldbank.org/data-catalog/india-cps
Challenges I ran into
To find the right set of data and to find co-relations between them
Accomplishments that I'm proud of
Learning how to create dimensions and measures and plotting them on charts and maps!
What's next for Socio Discovery
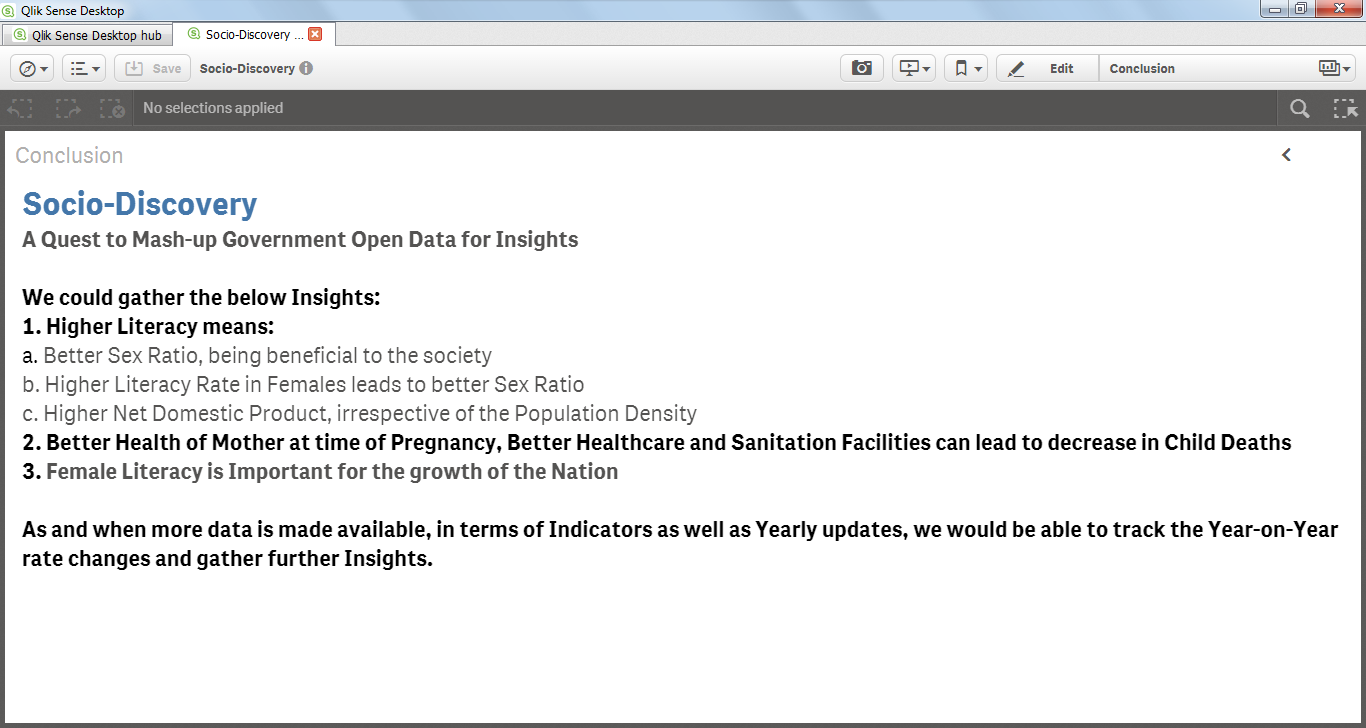
The current Dashboards analyses State performance against each other on the various KPIs. As and when more data is made available, in terms of Indicators as well as Yearly updates, we would be able to track the Year-on-Year rate changes and gather further Insights.
Built With
- qliksense
- socrata
- socrata-open-data

Log in or sign up for Devpost to join the conversation.