-
-

Web App Logo
-
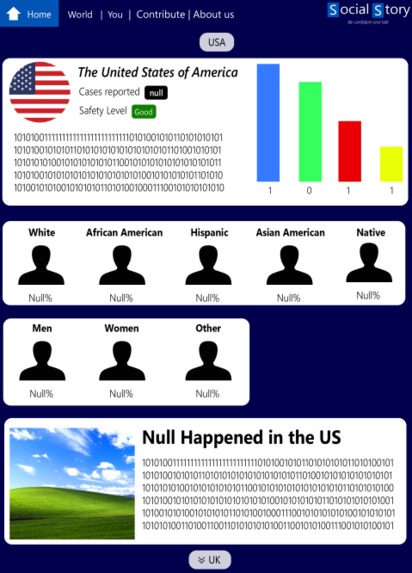
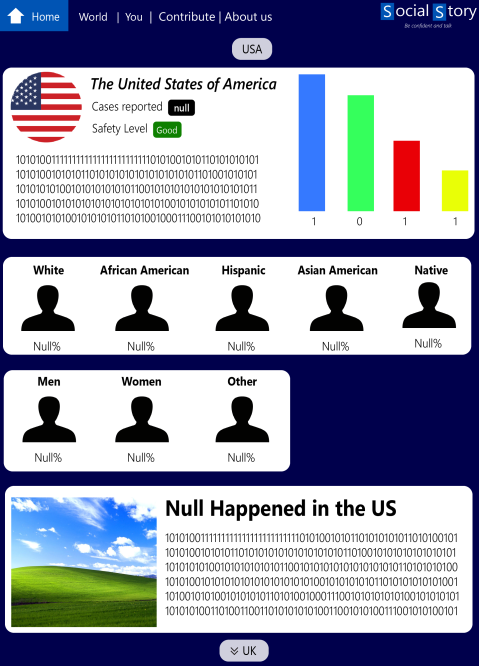
Vision for future Country pages
-
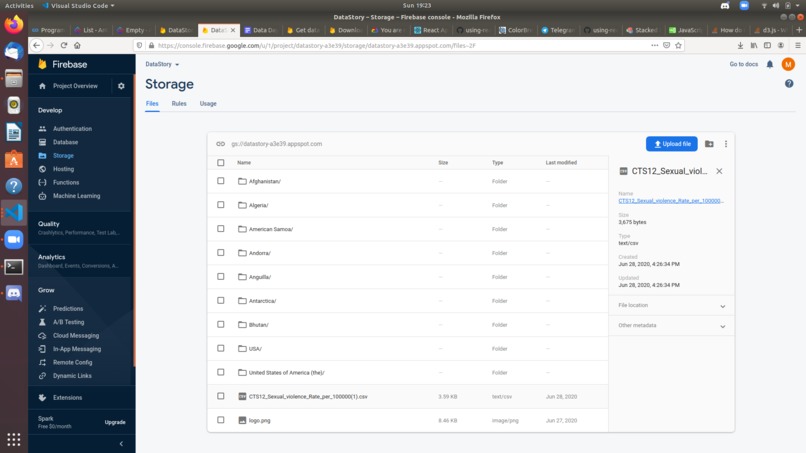
Firebase Storage
-

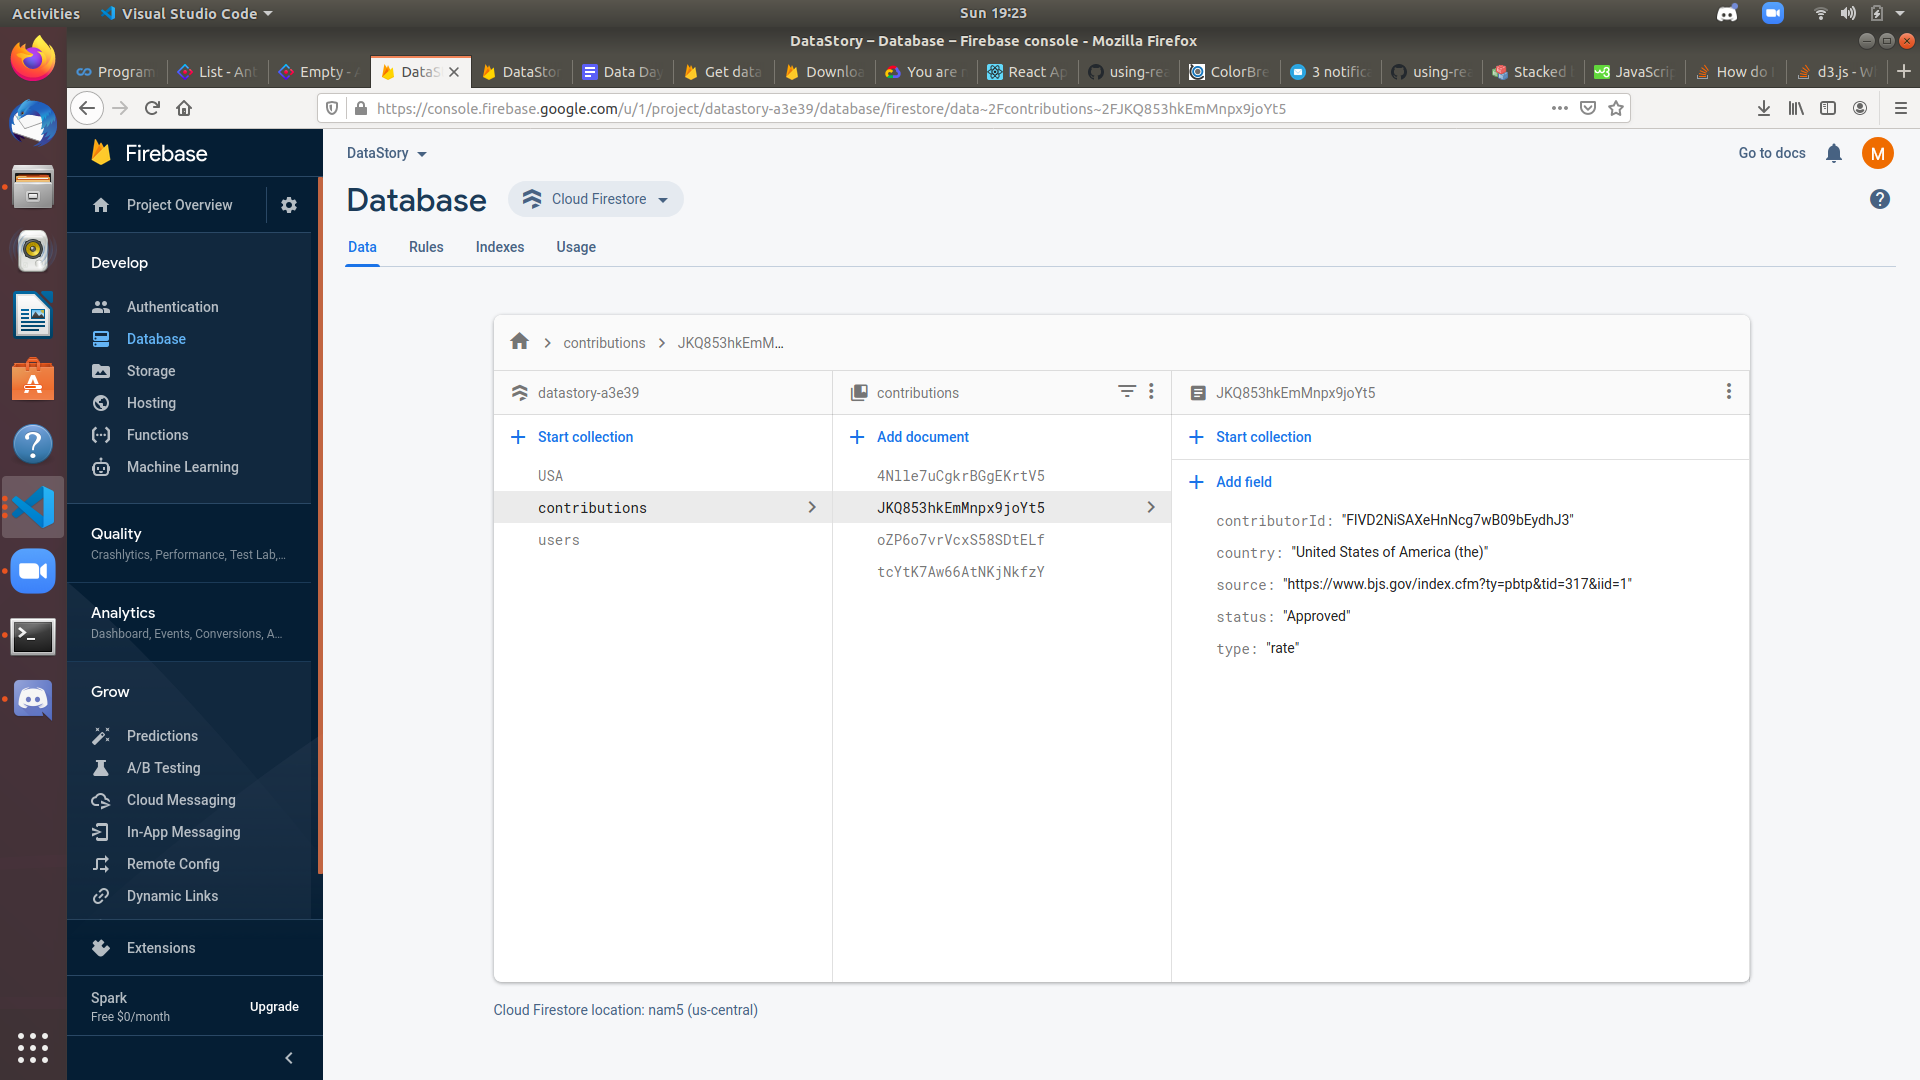
Firestore


Inspiration
We were intrigued by the statistics of various social issues around us. While there is an abundance of data in this era of technology, data still appears scare and scary. We are interested in the story that data tells about our society and want everyone to explore that story with us through this project. For instance, there has been an increase in the number of sexual harassment cases reported after the #MeToo movement. So we decided to illustrate the data trends for sexual harassment cases reported all over the world and see the changing trends with time through data.
What it does
Social Story is a web application that hopes to tell stories about our society through data. The initial launch hopes to inform the public about the social issue of sexual harassment and how cases have risen as more people are speaking up about their story. Related data and visualizations for the U.S. is provided. As data is scattered everywhere (especially regarding social issues), we want this platform to act as a means to consolidate it. This process will take place both through scraping popular news websites for information and relying on the open source community. As an open source project, people can contribute data attached with their trusted sources, which will then be reviewed by the maintainers of the project. There is also a list of resources and help centers for victims of sexual harassment which can also use more support of the community to cover a large part of the world.
How I built it
We used React as the main front-end framework for our web application and hosted the database and media storage on Google Firebase. After creating a world map via d3.js , we allow navigation to a country of choice, where the sexual harassment statistics for that country are displayed. We created a user authentication system and a contribution form that loads the information provided by an authenticated user to be stored in Firebase.
Challenges I ran into
We had trouble working with asynchronous functions in Javascript and getting certain elements to render properly in the DOM. There were difficulties extracting the data from CSV files and storing them into the Firestore, as well as fetching those data from the database and displaying them visually (i.e tables, graphs, charts). We especially struggled with data visualization when attempting to use the D3 React library because of structuring the layouts.
Accomplishments that I'm proud of
We managed to create our own authentication system and prohibit contribution to non-users. The data from the Firebase database was successfully fetched from our back-end and applied to our visualizations on the front-end. We were also able to render maps and stacked bar charts using d3.js!
What I learned
We learned about integrating Google Firebase with our React app and how to interact with the Firestore and Storage from the front-end through APIs. We got more practice programming in Javascript and understood why Promises are so important to the functionality. Our team had no prior experience with d3.js and we learned a lot about it.
What's next for Social Story
Social Story depends hugely on public contributions. Our web application currently only features data on the United States, so we are announcing a call to action and raise awareness on sexual harassment statistics. We plan to scrape more data from various trusted sources and expand the data availability for all countries, not just the U.S. From there, we think we could integrate other social issues in relation to sexual harassment.


Log in or sign up for Devpost to join the conversation.