Inspiration
Socioeconomic stress in an area correlates with lower educational outcomes. We wanted to find North Carolina public high schools meeting strong academic benchmarks despite being under high community stress.
What it does
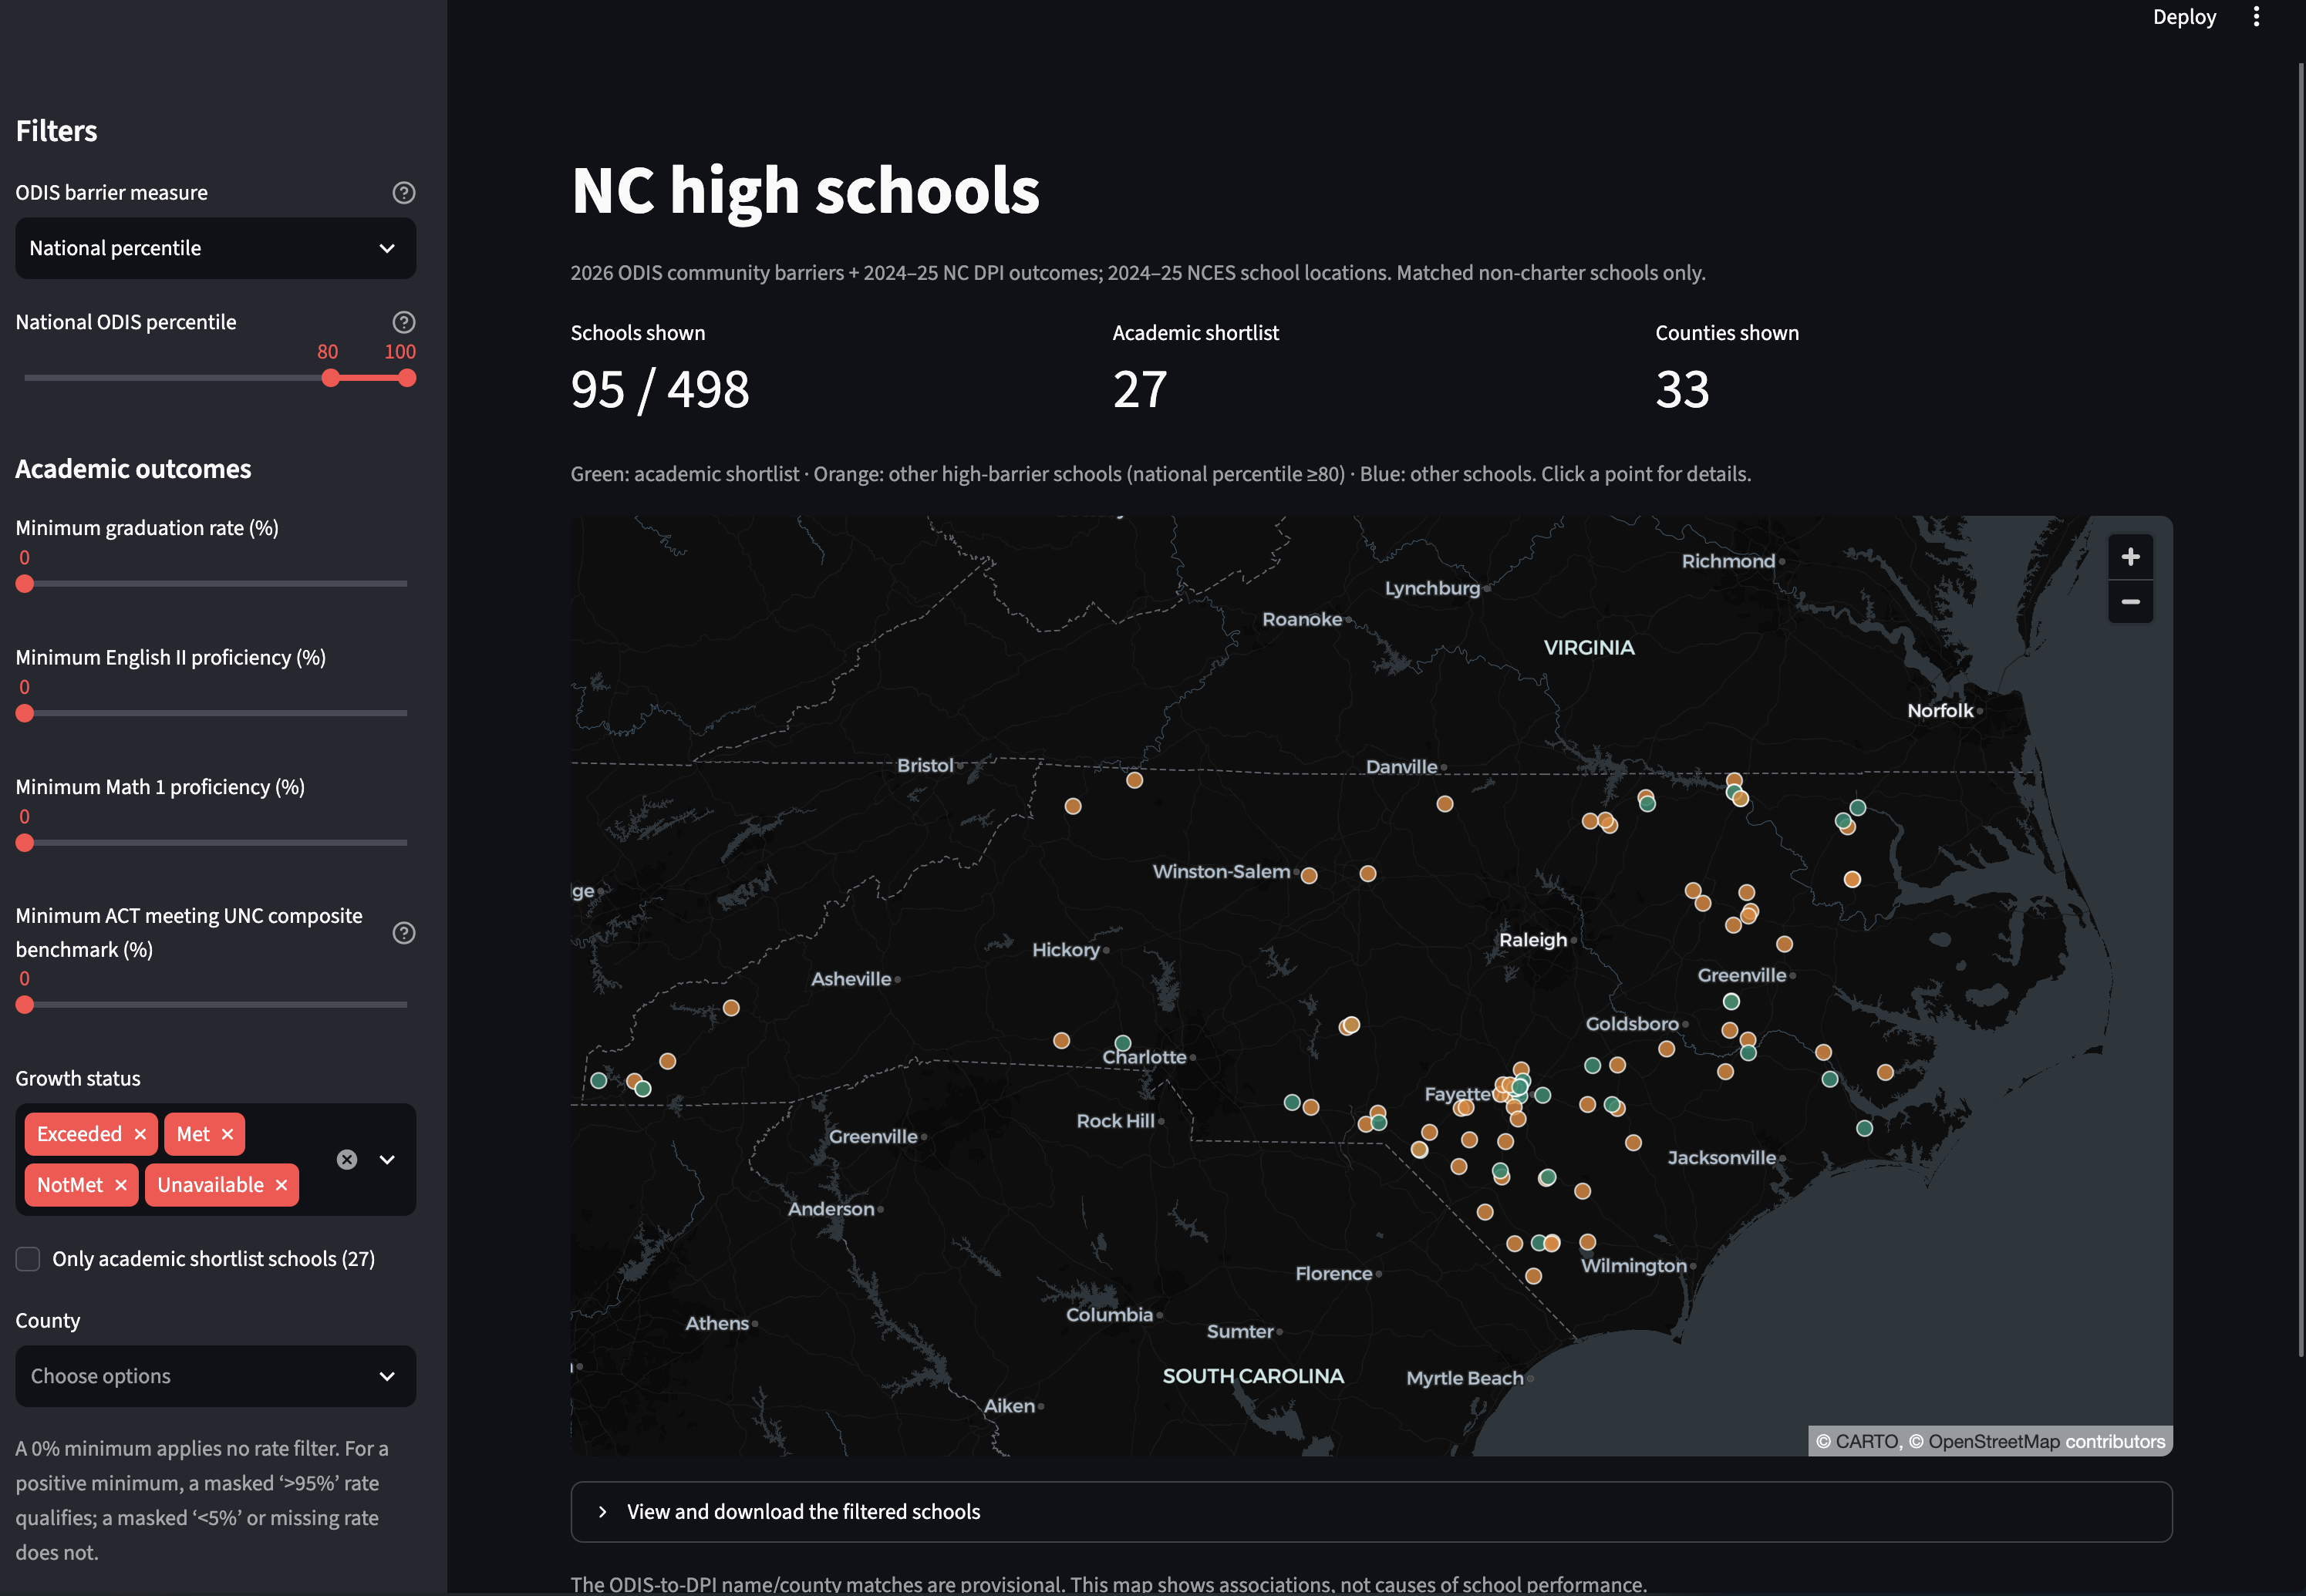
It is an interactive map of NC high schools. There are options to filter by ODIS score, Math 1, English 2, Act, and graduation scores.
How we built it
- Joined and cleaned ODIS dataset with NC DPI for education results.
- Found school coordinates using NCES school data.
- Analyzed the data and made graphs using Matplotlib.
- Created interactive map using Streamlit and PyDeck.
Challenges we ran into
- In the ODIS dataset, school identifiers couldn't be reliably used to join other datasets together, so not all schools could be matched.
- Some school data was masked with >95% and <5%, we preserved those bounds rather than treating them as exact scores
- The "Regular" label doesn't distinguish from traditional high schools and specialized programs
What we learned
- 70.4% of the schools with high educational outcomes despite community barriers were early college programs. These schools had lower absenteeism, fewer beginning teachers, smaller cohort size.


Log in or sign up for Devpost to join the conversation.