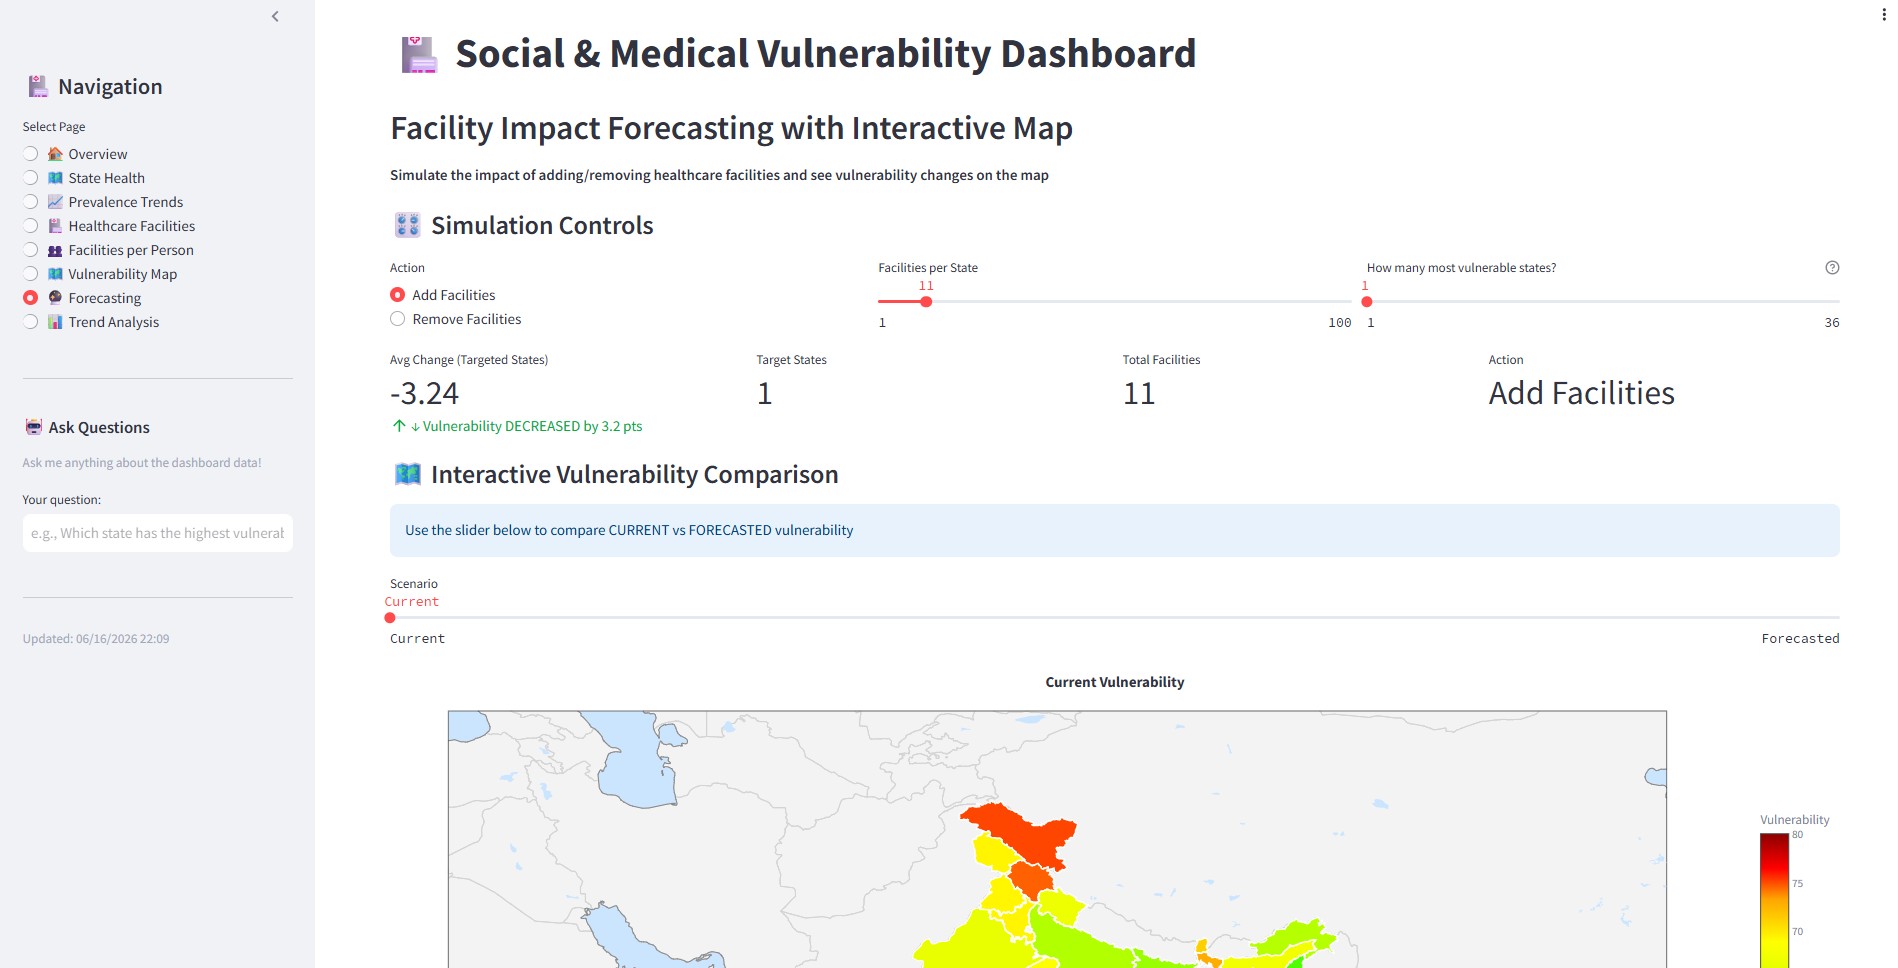
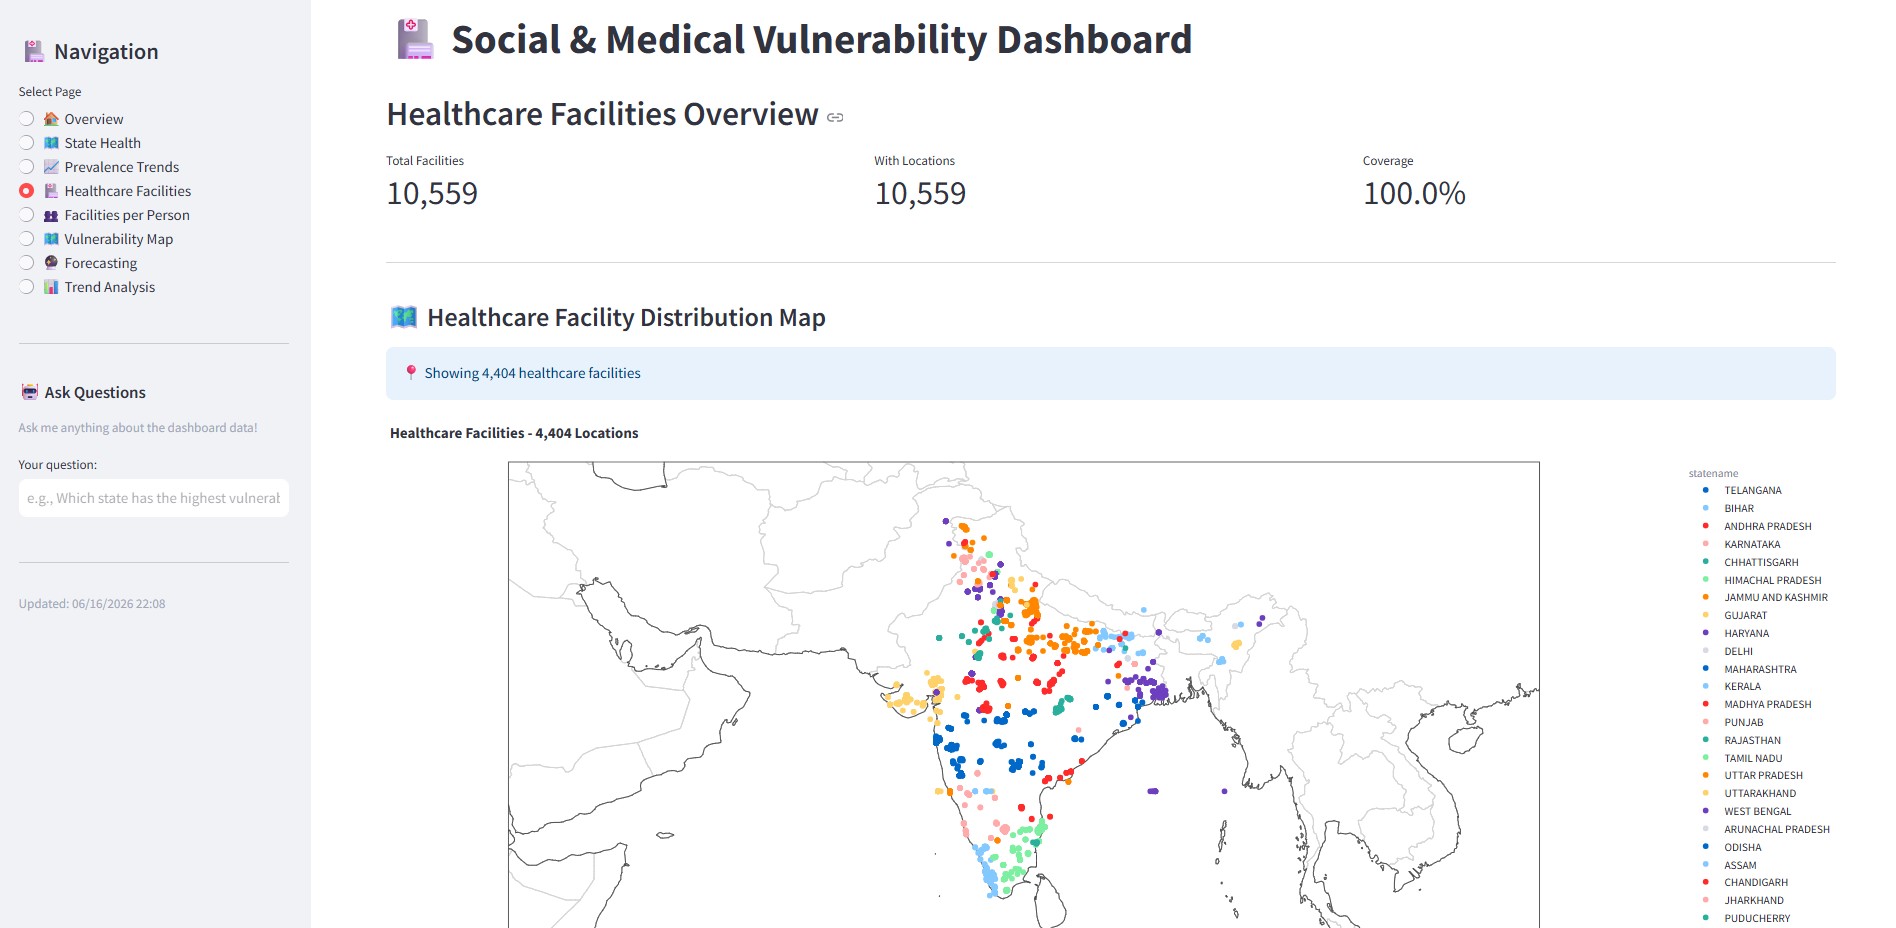
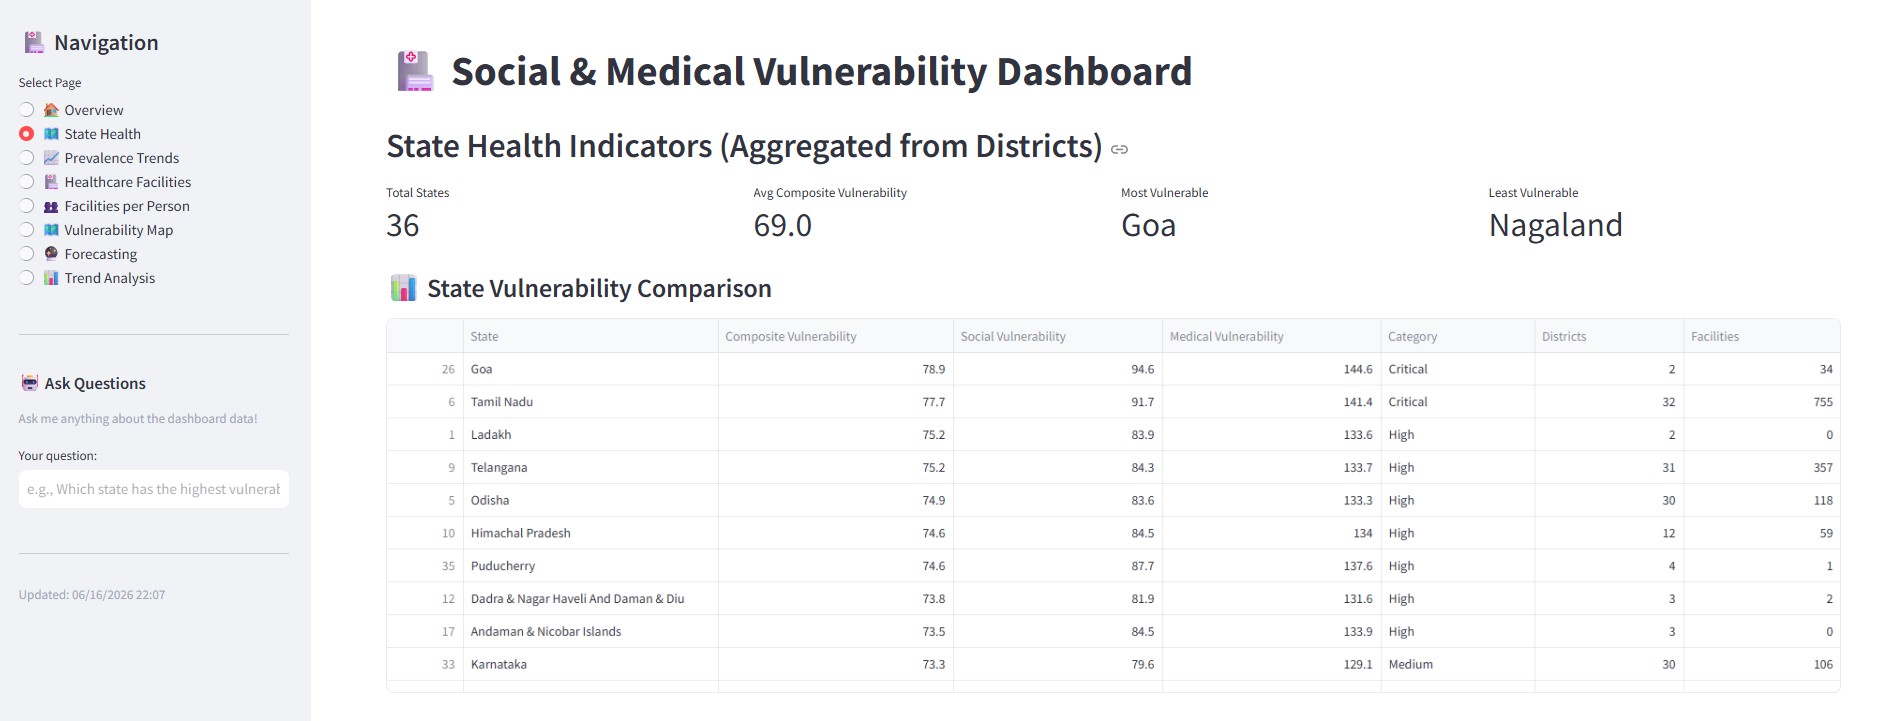
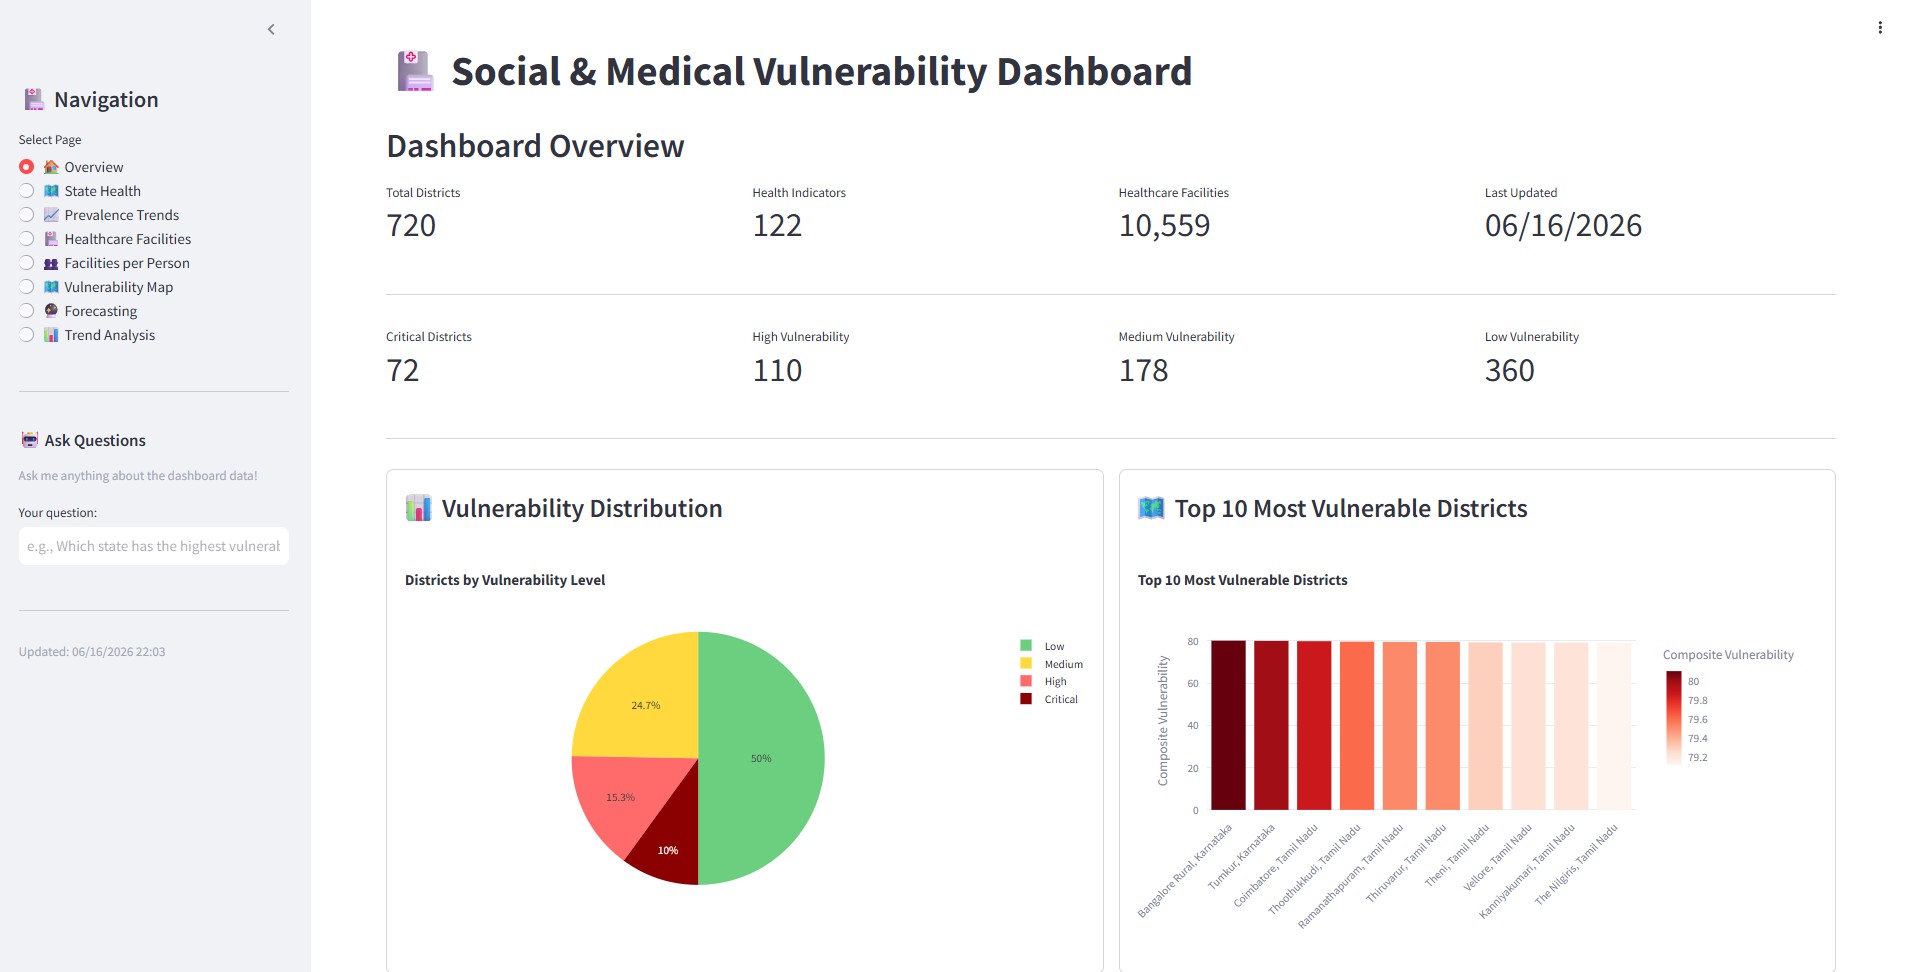
This dashboard locates areas of social & medical vulnerability throughout India. It can also forecast the decrease (or increase) in vulnerability if new medical facilities were built in poorer areas.
What it does - Uses healthcare data to identify areas of high vulnerability and forecasts vulnerability changes should new healthcare facilities should be built (or removed) from the most vulnerable areas.
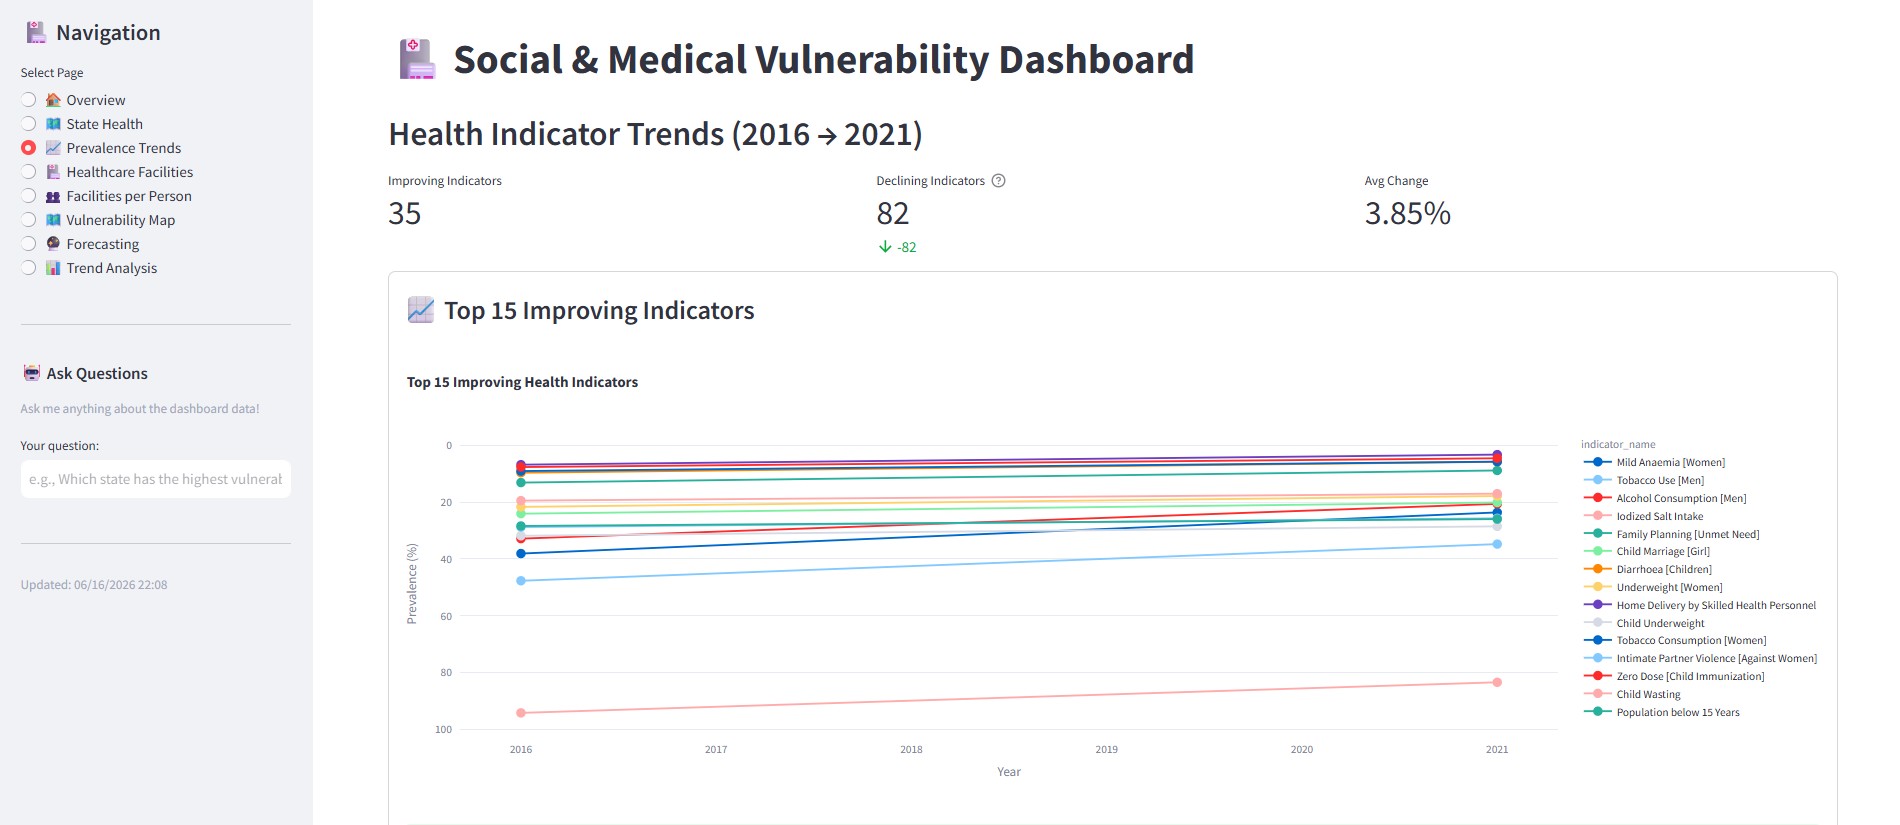
How we built it - We built it as an app in Databricks, using SQL, Python, JSON, and other languages. The data came from provided healthcare info, and we integrated the India Policy Insights dataset for a more holistic view of healthcare access throughout India.
Challenges we ran into - We had difficulties integrating maps with the proper delineations into the app, and there were also issues of the app reverting when implementing new changes.
Accomplishments that we're proud of - We are proud of developing a real, working app in Databricks that includes an agentic AI that could be used as a framework in our own work to illuminate areas of high social and structural vulnerability.
What we learned - We learned how to take developed code and create an app that can be used by the public. We also learned the best way to utilize Genie and Genie One. Finally, we learned how to take an agentic AI and embed it in the project to help guide decisionmakers.
What's next for Social & Medical Vulnerability in India - This app framework will be used in our current healthcare industry to help inform upper leadership and allow stakeholders to both see the data and interact with it via the agentic AI.

Log in or sign up for Devpost to join the conversation.