Inspiration
In the digital age, public opinion is a powerful force, capable of shifting in an instant and shaping everything from brand reputation to public policy. We were inspired by the sheer volume of conversation happening on social media platforms and the challenge of distilling this chaotic stream of data into something understandable. We realized that while many tools can track mentions or engagement, few offer a simple, intuitive way to understand the emotional pulse behind a trend. We wanted to build a tool for marketers, researchers, and curious individuals to not just see if a topic is popular, but to understand the sentiment behind it – the 'what' and the 'why' – all through a clean, interactive interface. The Data Hackfest 2025, with its focus on turning raw data into meaningful stories, was the perfect catalyst to bring this idea to life.
What it does
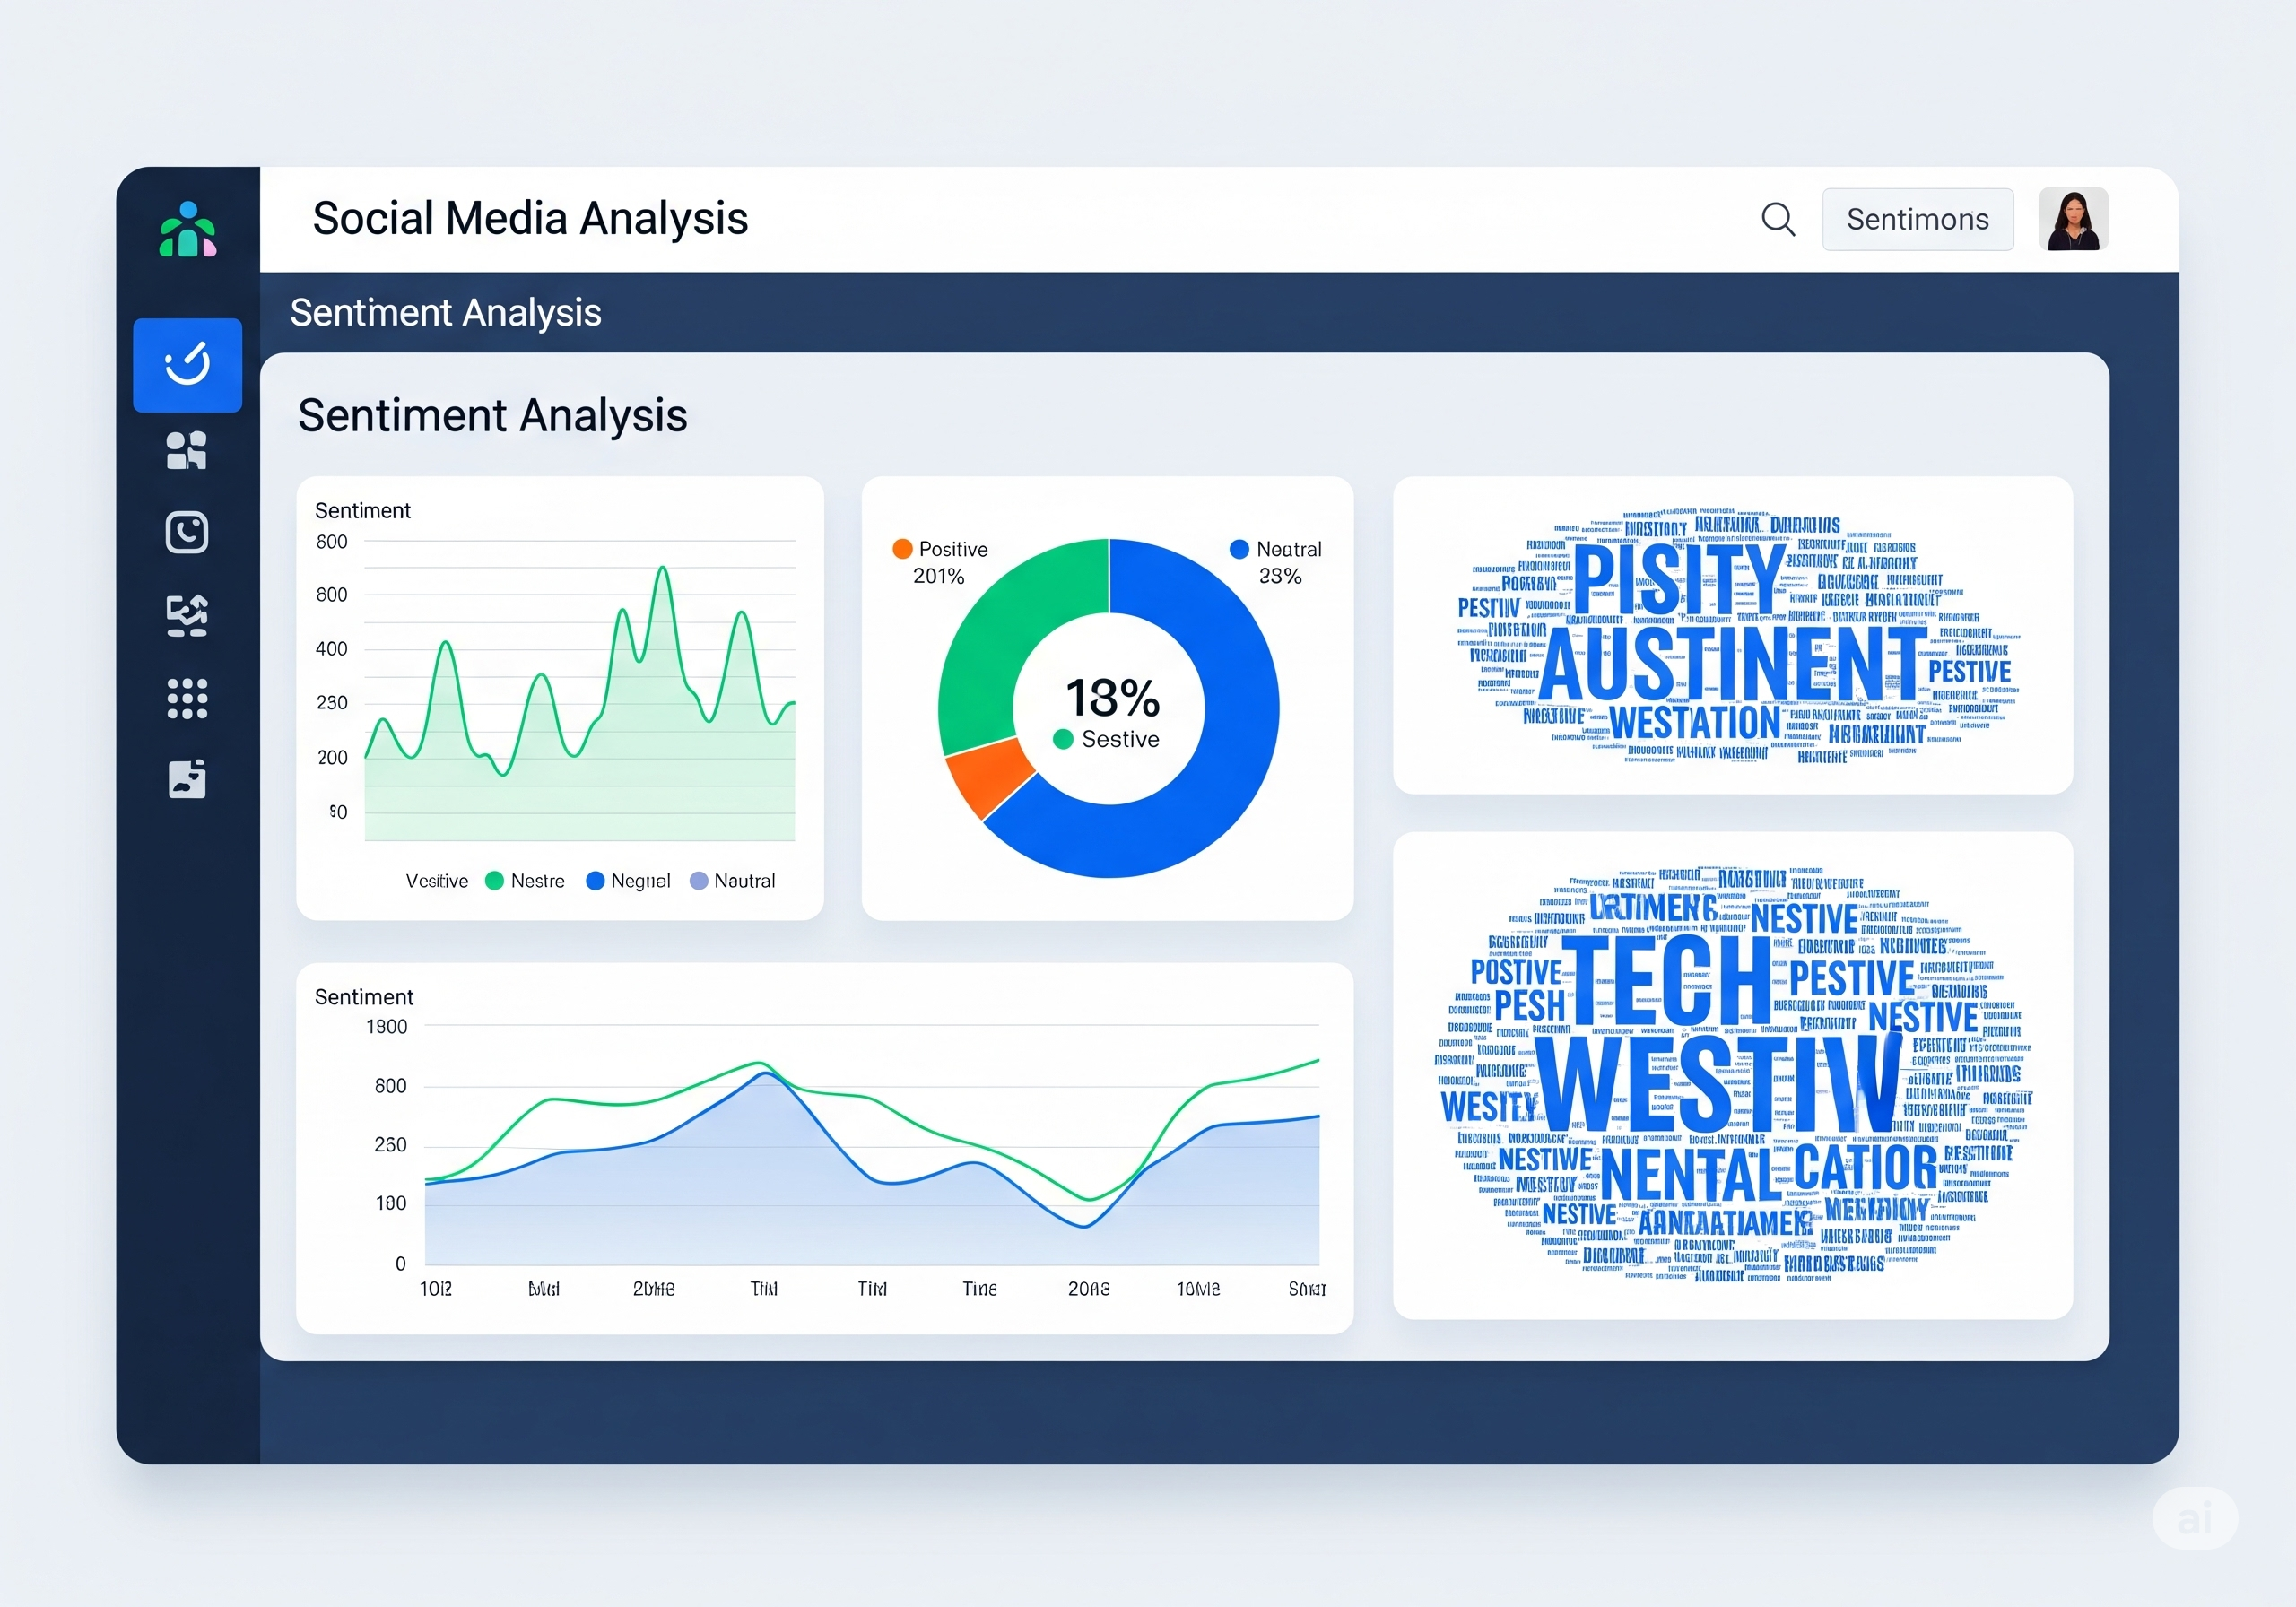
The Social Media Trend Sentiment Analyzer is a web application that transforms a raw dataset of social media posts into a powerful, interactive sentiment analysis dashboard. Here's what it does:
- Analyzes Sentiment at Scale: It processes thousands of posts and uses the VADER NLP model to accurately classify each one as Positive, Negative, or Neutral. VADER is specifically tuned for social media, understanding slang, capitalization, and emojis.
- Visualizes Trends Over Time: It plots the average sentiment on a dynamic line chart, allowing users to pinpoint specific dates where public opinion shifted dramatically.
- Provides an At-a-Glance Summary: A clean donut chart shows the overall proportion of positive, negative, and neutral posts across the entire dataset.
- Uncovers the 'Why': To provide deeper context, the dashboard generates separate word clouds for positive and negative posts. This highlights the specific keywords and topics that are driving the sentiment, offering qualitative insights beyond simple scores.
How we built it
We approached this project as an end-to-end data science workflow, from data wrangling to deployment.
- Backend & Logic: The entire application is built in Python. We used Pandas and NumPy for all data manipulation, from loading the initial raw CSV to aggregating the sentiment scores for visualization.
- NLP Pipeline: Text preprocessing was handled using the NLTK library to clean the raw posts (removing URLs, mentions, stopwords, etc.). For the core analysis, we chose the VADER (Valence Aware Dictionary and sEntiment Reasoner) model because of its proven effectiveness on social media text.
- Interactive Frontend: We used Streamlit to build the web dashboard. Its simplicity and power allowed us to create an interactive and aesthetically pleasing user interface with minimal boilerplate code.
- Data Visualization: The dynamic line and donut charts were created with Altair, which integrates beautifully with Pandas DataFrames. The insightful word clouds were generated using the WordCloud library and displayed with Matplotlib.
- Deployment: The final application is deployed on Render, making it publicly accessible.
Challenges we ran into
- Noisy Data: Raw social media text is notoriously messy. Our biggest initial challenge was creating a robust preprocessing pipeline that could effectively clean the text (removing links, mentions, special characters) without stripping away important context like emojis or negations that are crucial for sentiment analysis.
- Performance: Our first prototype performed the NLP analysis on the fly, which caused a noticeable lag when loading the dashboard. We solved this by pre-processing the entire dataset in a Jupyter Notebook and saving the results to a new, clean CSV file. The Streamlit app now loads this pre-computed data, making the user experience instantaneous.
- Meaningful Word Clouds: Initially, our word clouds were cluttered with common but uninformative words (e.g., "product," "trend"). We had to iterate on our stopword list and fine-tune the WordCloud generator to ensure that it highlighted the most significant and context-specific terms that truly explained the sentiment.
Accomplishments that we're proud of
We are incredibly proud of creating a polished, end-to-end data science application within the hackathon's timeframe. Moving from a raw, messy dataset to a deployed, interactive, and insightful web application feels like a huge achievement. We are particularly proud of the dashboard's intuitive design; it requires no technical expertise to use and understand. Finally, the implementation of the contextual word clouds is a key accomplishment, as it elevates the tool from a simple sentiment scorer to a genuine analytical dashboard that helps users understand the narrative behind the numbers.
What we learned
This project was a fantastic learning experience. We learned the critical importance of choosing the right tool for the job, as VADER proved far more effective than generic sentiment analysis libraries for this specific use case. We gained a deeper appreciation for the importance of pre-computation in creating responsive and user-friendly data applications. Most importantly, we honed our skills in data storytelling—learning how to select and design visualizations that work together to present a clear, compelling, and actionable narrative from a complex dataset.
What's next for Social Media Trend Sentiment Analyzer
We see a lot of potential for expanding this project. Our roadmap includes:
- Real-Time Analysis: Integrating with the Twitter/X API or other social media APIs to allow for real-time analysis of trending topics.
- User-Driven Input: Allowing users to input their own keywords, hashtags, or even upload their own datasets for analysis.
- Advanced Topic Modeling: Implementing NLP techniques like LDA to automatically discover and categorize the key sub-topics within the positive and negative conversations.
- Comparative Analysis: Building a feature that allows users to compare the sentiment trends of two different topics side-by-side.
Built With
- altair
- jupyter
- matplotlib
- nltk
- numpy
- pandas
- python
- scikit-learn
- streamlit
- vader
- wordcloud


Log in or sign up for Devpost to join the conversation.