-
-
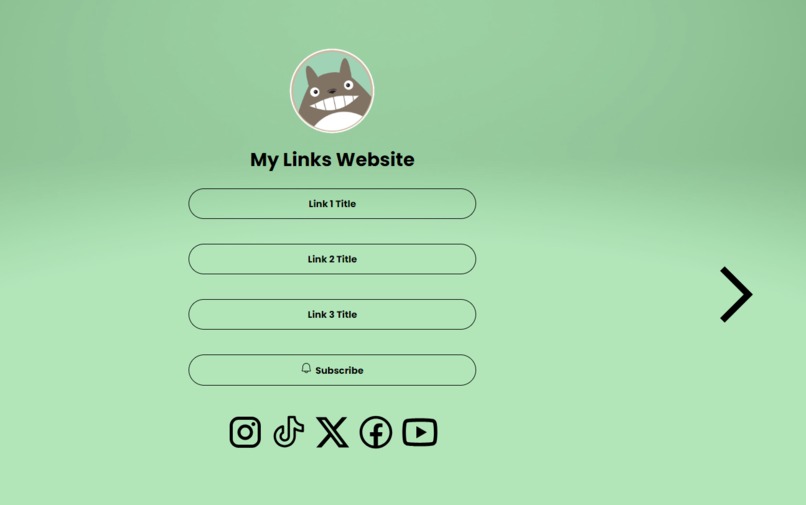
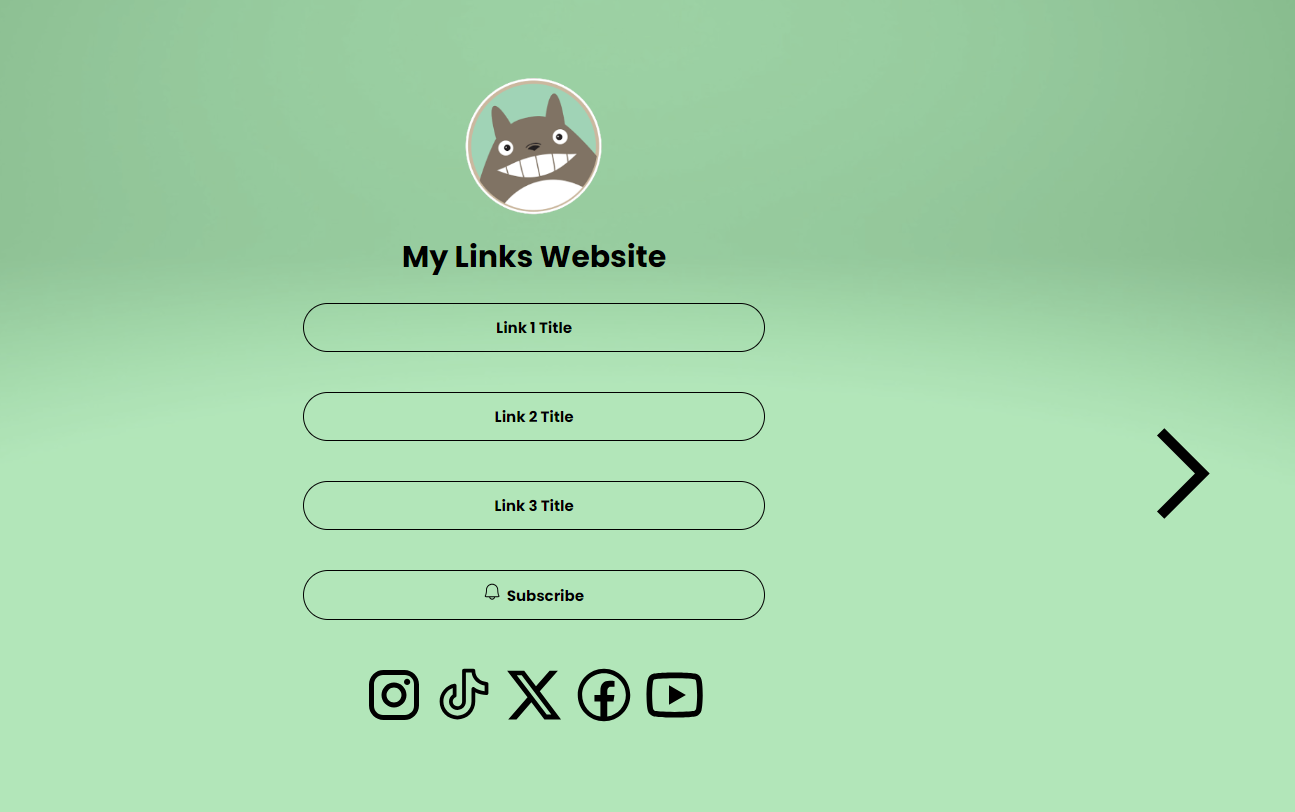
Main Page
-

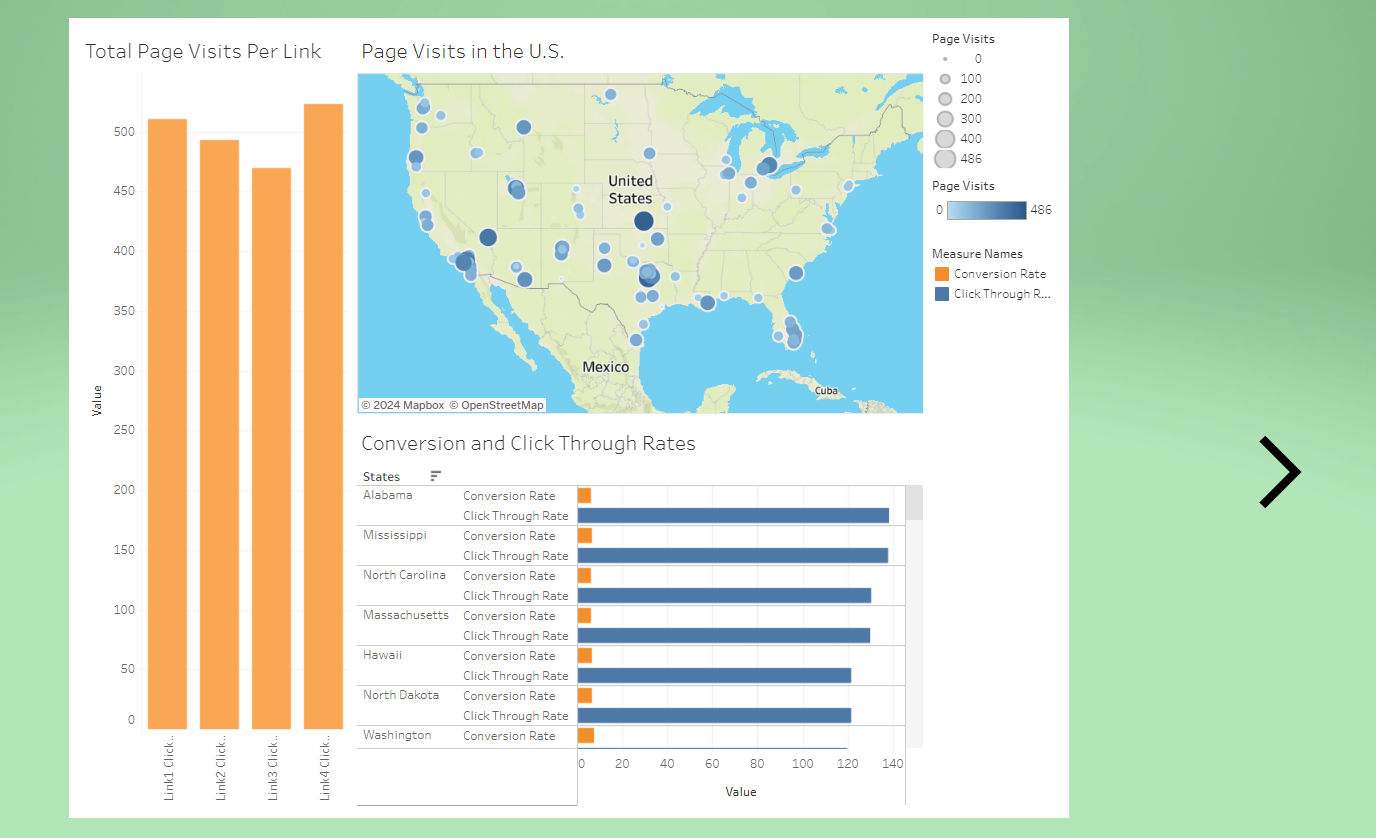
Analytics Page
Inspiration
Social media is one of the greatest marketing tools and also a valuable way to make data-driven decisions. As a group, we knew we wanted to do something in the area of social media, so we browsed social media apps and APIs to get some inspiration.
We noticed that LinkTree, an easy social media tool to replicate, did not use have a geographic map in its analytics/insights page. Nor did it have a functioning API for developers to use. Therefore, given our limited experience, our goal was simply to build a proof-of-concept analytics dashboard that displayed geographic data on a map. Due to there being no API to use, it gave us a chance to practice developing our own API and backend.
What it does
This project shows a LinkTree-like front page as well as an analytics page with an embedded Tableau dashboard. The project uses generated user data, but the back-end is equipped with API endpoints that push real-time updates to our database with actual user-interaction with the website.
This is a tool intended for social media influencers or content creators, similar to LinkTree. However, last we checked, most social media analytics/insights pages don't show spatial, geographic data. While some of those dashboards include various graphs, or even data segmented by regions, it's only numerical or textual. A particular use-case could be if a content-creator or artist is planning in-person events, fan-base meetings, or even a whole tour. Seeing the geographic data on a map better visualizes the data than any other geographic data on any other dashboard that we've seen.
How we built it
The front-end uses React, deployed to GitHub Pages. The back-end uses Python's Flask framework and a MySQL database, all hosted on PythonAnywhere and tested using Postman. The data was generated using Python scripts and a RandomUser API.
Challenges we ran into
Our first challenge was configuring the whole architecture of the project, especially the back-end. Since none of us had ever worked with back-end technology, a lot of time was spent learning how to use Flask, set up API routes, test using Postman, learn and use SQL, use Flask's SQL ORM called SQLAlchemy, and then specifically adapting and configuring PythonAnywhere's environment.
Another challenge was to connect the front-end and the back-end. CORS was a huge issue, and we ended up adding many headers to the response and request objects to comply with CORS. Then we also needed certain functions and events to run only once, which was more difficult than anticipated due to JavaScript's/React's asynchronous behavior. But it sure was hilarious to see +5000 database entries!
Specifically for Tableau, we had some difficulty setting up the viz embedding. While the tutorials, playgrounds, and documentation work great for vanilla JavaScript and HTML, there was no useful instructions for how to set it up using React. We eventually found a solution while searching through the hackathon discord, but it felt largely like a miraculous stroke of luck than an intuitive walk through the documentation.
Small challenges included making our own data, and then figuring out the correct format for Tableau to recognize it correctly. For example, it did not initially recognize our geographic data. It was a science experiment clicking, double clicking, and dragging every possible thing to figure out how to show meaningful insights. We also had to learn a couple animations for React. Also, after a little experimentation, we hypothesize that PythonAnywhere's MySQL database is "internal", meaning that it probably can't connect to other applications like a normal MySQL server. We were going to implement a workflow for our dashboard to get real-time data from the database, but at that point there wasn't enough time to learn and migrate our data to another platform.
Accomplishments that we're proud of
Personally for me (Joseph), this project was the steepest learning curve in my (early) career as a Software Developer. Learning a new front-end framework (React) and back-end framework (Flask) and a new database (MySQL) took a substantial amount of my time. But, I'm very proud of the lessons and skills I've learned in the process of this project.
As far as the project itself goes, I'd say the proudest accomplishment is just getting anything to render at all with zero errors. Knowing that all of the various pieces of the tech stack are working feels like quite the accomplishment.
For me (Sarah), I'm proud of building a dashboard with Tableau for the first time after grinding hours of Tableau videos.
What we learned
For the back-end, we learned Flask, MySQL, SQLAlchemy, and how to configure all of that together on PythonAnywhere. For the front-end, we learned React, animations, and Tableau's Embedding API v3. For generating our own fake data, we learned the RandomUser API. Some of us had to learn Python, HTML, CSS, and JavaScript as languages that supported these frameworks. Shoutout to Tableau with Tim Youtube channel for his help!
What's next for Social Media Analytics Dashboard
We had many other features and functionalities planned, but as is often the case, the learning curve feels steeper on the mountain than viewing it from a distance. We wanted to include user authentication and login, as well as personal page creations so that people could customize and configure their own page of social media and product links on their own account. For this, we would probably have utilized Fire Base. We also wanted to design and implement a fully fleshed out API that was equipped with API tokens, developer API documentation, and possibly even monetization using Stripe, especially since the lack of this feature is what caught our eye with LinkTree in the first place. For the data visualization aspect of the project, we would have liked to include data for whether particular products were purchased, expanded the possible geographic data to beyond the United States, include temporal data, added insights into where internet traffic was coming from (we have a column in our database that stores the inbound URL, but we didn't have time to build functionality around this that could, for example, help a content creator see if followers from YouTube, Instagram, or X were particularly clicking their LinkTree link), and then also to programmatically add a layer of intractability to the dashboard, such as to select or filter certain US states.
Built With
- css
- flask
- github
- html
- javascript
- mysql
- python
- pythonanywhere
- randomuserapi
- react
- sql
- sqlalchemy
- tableauembedding


Log in or sign up for Devpost to join the conversation.